
Trading Educators Blog
Inverted Yield Curve
Lately, we've been hearing a lot about an Inverted Yield Curve. What is it, and what does it mean?
- Yield curve inversion signals late phases of bull market rally.
- The market's "melt-up" phase is coming.
- Some of the best gains lie ahead.
Canaccord Genuity's Tony Dwyer is known for being incredibly prescient regarding his market calls. As a result, many Wall Street asset managers listen to whatever he says about market direction.
Dwyer has come to believe we're in the final innings of this long bull market. He'd been waiting for a signal to tell him when it may end. When the signal comes it's when the "Melt Up" phase of the market takes place and investors can make some of their best gains. This time is no different. A "melt-up" is the last rise in market prices prior to a "melt-down." Melt ups typically involve a wild rally to new highs amidst great euphoria. It is a time where the professionals sell (dump) their shares to the naïve public before prices peak and then begin to descend.
For anyone unfamiliar, a yield curve inversion happens when the interest rate on shorter-duration Treasury's eclipses the yield on longer-duration. In this case it's the two-year and 10-year. It means traders are demanding more money for a two-year risk then they are for ten years. That's because they think the dangers near term are greater - i.e. recession coming - than they are further out. And there's a reason why the markets pay attention to inversions - the last seven times the two-year and 10-year inverted, a recession followed.
But look at the chart below highlighting the performance of the market the last three times this signal was triggered:
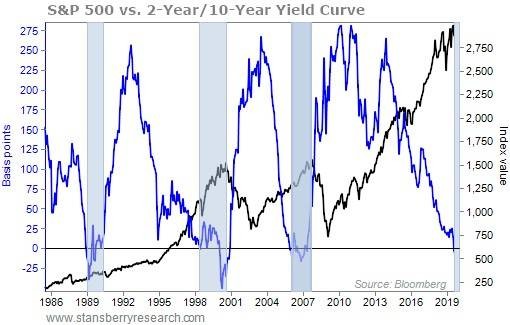
You'll notice that even after the yield curve was telling us a recession is in the cards, it took a while for it to show up in stock prices. Nor did the recessions hit right away either. During those last seven times an inversion happened, it took about two years for the recession to arrive.
Consider this data that Dwyer has highlighted from the last inversions:
Since 1988, there have been three cycles when the yield curve has first inverted:
- Average number of months before peak: 21
- Average number of months before a recession: 25
- Average return from that date to peak for the S&P 500 Index of 34%
Since 1965, there have been seven cycles:
- Average number of months before peak: 5
- Average number of months before a recession: 19
- Average return to peak of 21.1%
We want to hear from you, Joe Ross wants you to learn trading. Email us your questions or if you need additional information. Another great investment is private mentoring with Joe, our students find this very helpful and accelerates their trading successes.

