One concept that every trader must master is that of knowing which elements of analysis are telling him the truth at any given time. The overriding factors of trading are those of common sense and trading what you see. However, there may be a time to use technical indicators, knowledge of cyclicals, perhaps even your own theories to help you in trading what you see. There is also a time to virtually discard all of these and trade only what you see without regard to confirmation. You might call that “intuitive” trading. At other times, confirmation can be achieved from the fundamentals in the market place. It is best to have confirmation of some sort before trading.
Although an individual trader, without the benefit and support of a research staff, can hardly afford to delve deeply into the underlying fundamentals, almost any individual trader can easily ascertain from the news and various reports and advisories some of the basic fundamentals needed for confirmation.
In this way a technical trader differs from a fundamentals trader, who may spend hours and days researching the fundamentals of a market in which he wishes to trade. Technical traders can satisfactorily use the research of others to know which futures, stocks or currencies to watch, and can outperform fundamentals traders by correctly timing his trades through both chart and technical analysis.
In a demand driven market, only an appreciation of the fact that prices are rising should suffice. All the technical and fundamental analysis in the world goes out the window in such a market. Only trading what you see on a chart makes any sense.
A demand driven bubble in stocks, which resulted in a corresponding bubble in the stock indexes such as seen in the latter part of the twentieth century, defies every type of analysis other than an admission that if you see prices rising, you should be long, albeit with protective stops to make sure you lock in profits.
The demand driven bubble situation in the U.S. stock markets left many analysts shaking their heads in confusion. Avoiding confusion is one reason why we maintain that you should trade what you see. For safety sake and a feeling of reassurance in non-bubble markets, what you see usually should be backed up and confirmed by some other method of analysis. There are situations in which there is no time for confirmation. Choosing that “other” area is an individual choice based upon experience and success. You learn to use what works for you.
Avoiding confusion is why you should never marry a market, a certain way of trading, or a particular method of analysis. The most successful traders we’ve seen learn to trade from a toolbox of analytical methods. They learn to use the appropriate tool for a particular market condition.
To avoid confusion, you must not marry a philosophy. When asking yourself or asked by others which way you think a market will go, you should be able to answer, “I don’t know, but by following the market’s own action and my own analysis, then more often than not, I will be positioned appropriately – even if that position is one of standing aside.”
As a trader, you must learn to dance with the market. You, also, must learn that if a market you are trading decides to do the “Cha-cha,” you do it too. But before you can dance with the market you have to learn how. You have to get to know and understand the basic forces that drive prices (Hint: Fear and Greed). You have to develop pattern recognition skills, and it can be helpful to include indicators that tell you things about the market you cannot readily see. The indicators are there to enhance your analysis, not to be your analysis. Indicators are no substitute for your own perception based upon what you see and know.
What is it that was driving the stock markets throughout the latter part of the decade of the 1990's? It was demand! People were pouring money into mutual funds at a fantastic rate. Those funds could not just sit on that money, they had to invest it where the people want it placed – in the U.S. stock market. Anyone paying attention to their constantly rising price charts could have seen that.
A Turnkey Business?
There are far too many traders who enter this profession looking for a turnkey business.
An accountant can buy an existing practice. So can a doctor and, to some extent, an attorney. An engineer can usually buy into an existing firm. Entrepreneurial-minded individuals can buy a franchise. If you have enough money, you can get a high-profile, big-name franchise. A good one comes with training for you and for your hired help. It comes fully equipped with everything you’re supposed to need to run the business. Your advertising is laid out for you. You have an employee manual and an operations manual. You are shown how to set up your books, and trained in how to do it all on a computer using the software provided by the franchiser. Unless you are at the level of a functional idiot, you can pretty well be certain that you are going to succeed.
However, trading is far from being a turnkey business. You simply cannot go out and buy a mechanical trading system that is going to guarantee you any viable degree of success. Oh, we know they are advertised that way – so are some franchises in other areas of business. But there are fakes and frauds the world over. Caveat emptor!!
When you are a trader, no one gives you an employee manual. No one offers you an operations manual. There is no school to which traders can go to be trained specifically in this business. (We are hoping to correct that somewhat with our books, webinars, and tutoring sessions.)
No one will sit down with you to show you which markets to trade and in which time frame to trade them. Trading is something that cannot be packaged. There are too many aspects of trading that derive from the individual personality and mind set of the trader him/herself. Trading is not the only occupation that is that way. Anything truly creative cannot be packaged as a business.
The Art of Trading
People talk about trading as though it were scientific. With varying degrees of success (failure??), they try to apply mathematics and scientific theories to markets, and consequently to the trading of them. But if you allow trading to define itself, it is quickly seen that it is an art form and not a science. Trading is more nearly compared with art and music than it is with science. Great traders are individuals, and almost always creative ones at that. Could anyone package and franchise the ingredients that created a Salvador Dali, or a Picasso? Would it have been possible to package and franchise the make-up of an Arthur Rubenstein, Elvis Presley, or Whitney Houston? Trading is an art based on an artist’s perception of what is happening in the markets. If it weren’t, there would be many more traders.
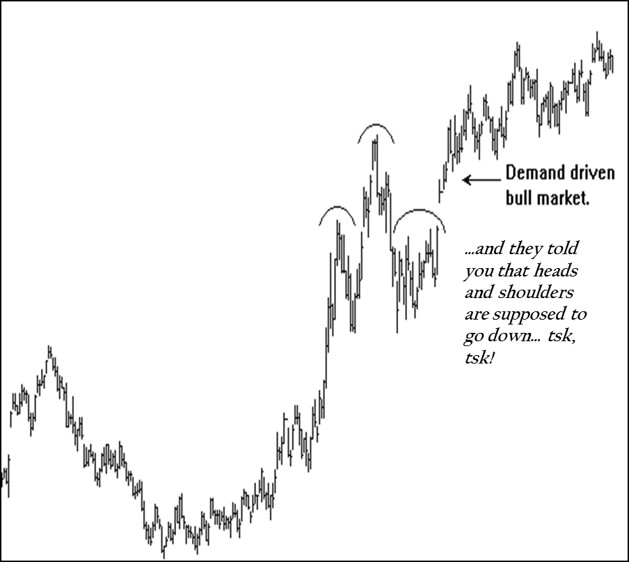
Notice the head and shoulders pattern on the preceding chart. If prices followed some sort of law, or if chart analysis were a science, why didn’t that result in the market moving down instead of up? If something is scientifically provable, then it ought to be able to be reproduced repeatedly with the same results. If markets and trading were scientific, you ought to be able to obtain the same results every time you see a particular market pattern. But it just isn’t so! If it were, you could enter the trading profession and memorize all the major price patterns made by markets. You would then know exactly what to do in every case. You would have learned a job, and the pay for trading would be like most other paying jobs – low.
A similar observation can be made about theories. A theory is a theory until it becomes a fact. A fact is a fact because it is a result that can be proved repeatedly. A fact becomes fact when the result of something is always the same. If you jump out of an airplane, you’re going to fall – fact. If you slide down a forty foot razor blade...well you know! So why have we never seen an Elliott Wave fact? Because seemingly, no two people can agree on which wave they are in until after the fact!!
Many artists train and study with and under great artists, but to become successful on their own, they have to develop their own style based on their own perception of the world around them.
Musicians study under musicians having greater knowledge, experience, and maturity than themselves. But before they, too, can become proficient or achieve a level of greatness, they have to interpret music from their own perception of what they see and hear.
Not every trader is destined to be a great one. You should be the last one to ever consider yourself to be a great trader. Your success in trading will be derived from becoming proficient in the discipline of perceiving markets for what they really are and how they really work.
Classical Trading Patterns
We would have to guess that one of the first attempts at a scientific approach to the markets was that of pattern recognition. Pattern recognition has come full circle. It went out of vogue many years ago and now is back via the route of computer generated pattern recognition. The old-timers did a lot of their trading from these patterns, and maybe some still do: heads and shoulders, ascending and descending triangles, flags, pennants, coils etc. Do they work? Yes and no! You see, it is all a matter of perception. There were rules about how to trade these patterns. We can tell you this, they will work for you if you know when they are telling you the truth, and when to discard them as worthless.
Remember the heads and shoulders pattern we showed you on the previous page? The fact of real demand removed any semblance of reality for the heads and shoulders pattern – heads and shoulders tops are supposed to go down!
Nevertheless, an understanding of what is behind classic chart patterns will help to make you a better trader.
Classic Price Patterns
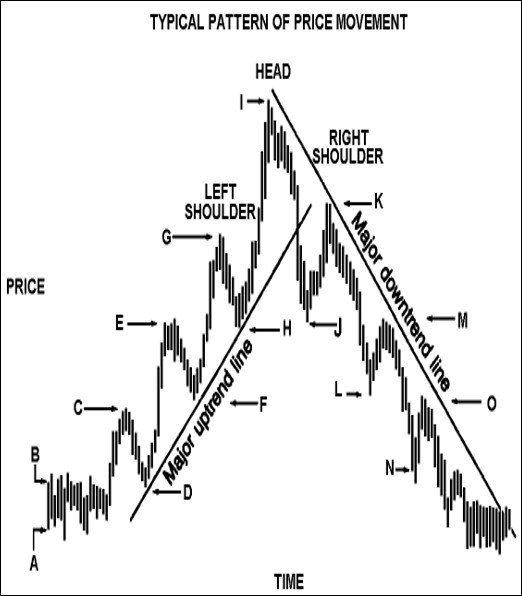
Assume prices trade within a relatively narrow Trading Range (between points “A” and “B” on the chart).
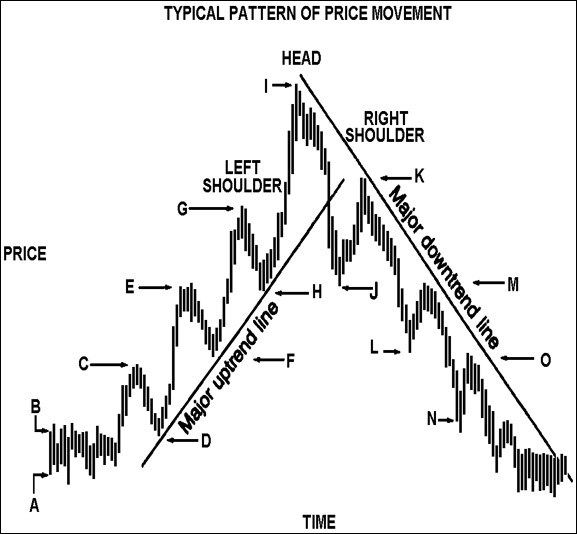
Recognizing the sideways price movement, the ‘longs’ might buy additional contracts if the price advances above the recent Trading Range. They may even enter orders to buy at “B,” to add to their position if they should get some confirmation the trend is higher. But by the same token, recognizing prices might decline below the recent Trading Range and move lower, they might also enter sell orders below the market at “A” to limit their loss.
The ‘shorts’ have exactly the opposite reaction to prices. If the price advances above the recent Trading Range, many of them might enter orders to buy above point “B” to limit losses. But they, too, may add to their position if the price should decline below point “A” with orders to sell short at some point below point “A.”
A third group is not in the market, but they are watching it for a signal either to go long or short. This group may have orders to buy above point “B,” because presumably the price trend would begin to indicate an upward bias if point “B” were penetrated. They may also enter orders to sell below point “A” for converse reasons.
Assume the market advances to point “C.” If the Trading Range between points “A” and “B” has been relatively narrow and the time period of the lateral movement relatively long, the accumulated buy orders above the market could be quite numerous. Also, as the market breaks above point “B,” the result is a stream of market orders to buy. As this flurry of buyers becomes satisfied and profit-taking from previous long positions causes the market to dip from the high point of “C” to point “D,” another distinct attitude begins working in the market.
Part of the first group that went long between points “A” and “B” did not buy additional contracts as the market rallied to point “C.” Now they may be willing to add to their position ‘on a dip.’ Consequently, buy orders trickle in from these traders as prices drift down.
The second group of traders with short positions established in the original Trading Range have now seen prices advance to point C, then decline to move back closer to the price at which they originally sold short. If they did not cover their short positions with a buy order above point “B,” they may be more than willing to cover on any further dip to minimize the loss.
Those not yet in the market will place price orders just below the market with the idea of ‘getting in on a dip.’
The net effect of the rally from “A” to “C” is a psychological change in all three groups. The result is a different tone to the market, where some support could be expected from all three groups on dips. (Support on a chart is defined as the place where buying brings sufficient demand to halt a decline in prices.) As this support is strengthened by an increase in market orders and a raising of buy orders, the market once again advances toward point “C.” Then, as the market gathers momentum and rallies above point “C” toward point “E,” the psychology again changes subtly.
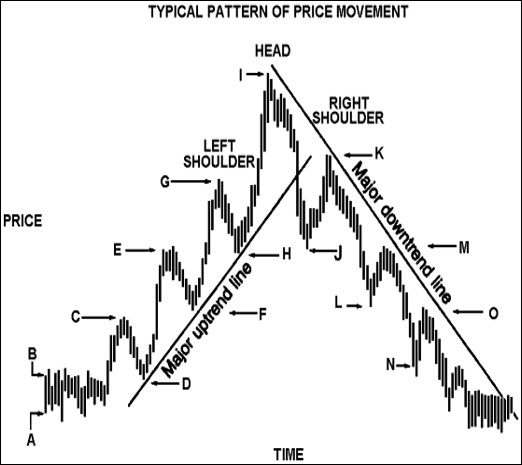
The first group of long traders may now have enough profit to pyramid additional contracts with their profits. In any case, as the market advances, their enthusiasm grows and they set their sights on higher price objectives. Psychologically, they have the market advantage.
The original group who sold short between “A” and “B” and who have not yet covered are all carrying increasing losses. Their general attitude is negative because they are losing money and confidence. Their hopes fade as their losses mount. Some of this group begin liquidating their short positions either with stops or market orders. Some reverse their position and go long.
The group which has still not entered the market – either because their orders to buy the market were never reached or because they had hesitated to see whether the market was actually moving higher – begins to "buy at the market".
Remember that even if a number of traders have not entered the market because of hesitation, their attitude is still bullish. And perhaps they are even kicking themselves for not getting in earlier. As for those who sold out previously-established long positions at a profit only to see the market move still higher, their attitude still favors the long side. They may also be among those who are looking to buy on any further dip.
So, with each dip the market should find the support of: 1) traders with long positions who are adding to their positions; 2) traders who are short the market and want to buy back their shorts if the market will only “back down some;” and 3) new traders without a position in the market who want to get aboard what they consider a full-fledged bull market.
This rationale results in price action that features one prominent high after another, and each prominent reactionary low is higher than the previous low. In a broad sense, it should appear as an upward series of waves of successively higher highs and higher lows.
But at some point the psychology again subtly shifts. The first group with long positions and fat profits is no longer willing to add to its positions. In fact, they are looking for a place to “take profits.” The second group of battered traders with short positions has really been worn down to a nub of die-hard shorts who absolutely refuse to cover their short positions. They are no longer a supporting element, eagerly waiting to buy the market on dips.
The third group of those who never quite get aboard the up-move become unwilling to buy because they feel the greatest part of the upside move has been missed. They consider the risk on the downside too great when compared to the now-limited upside potential. In fact, they may be looking for a place to “short the market and ride it back down.”
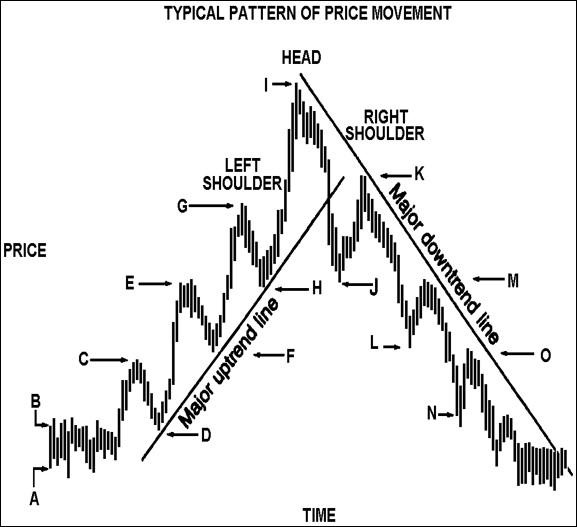
When the market demonstrates a noticeable lack of support on a dip that “carries too far to be bullish,” this is the first signal of a reversal in psychology. The decline from point “I” to point “J” is the classic example of such a dip. This decline signals a new tone to the market.
The support on dips becomes resistance on rallies, and a more two-sided market action develops. (Resistance is the opposite of support. Resistance on a chart is the price level where selling pressure is expected to stop advances and possibly turn prices lower.)
The Downturn
Now the picture has changed. As prices begin to advance from point “J” to point “K,” traders with previously-established long positions take profits by selling out. Most of the hard-nosed traders with short positions have covered their shorts, so they add no significant new buying impetus to the market. In fact, having witnessed the recent long(er) decline, they may be adding to their short positions.
If the rally back toward the highs fails to establish new highs, this failure is quickly noticed by professional traders as a signal the bull market has run its course. This is even more true if the rally carries only up to the approximate level of the rally top at point “G.”
As profit-taking and new short-selling forces the market to decline from point “K,” the next critical point is the reactionary low point at “J.” A major bear signal is flashed if the market penetrates this prominent low (support) following an abortive attempt to establish new highs in prices. In the vernacular of chartists, a head-and-shoulders reversal pattern has been completed. But rather than simply explaining away price patterns with names, it is important to understand how the psychology of the market action at different points causes the market to respond as it does. It also explains why certain points are quite significant.
In a bear market, the attitudes of the traders would be reversed. Each decline would find the bears more confident and prosperous and the bulls more depressed and threadbare. With the psychology diametrically opposite, the pattern completely reverses itself to form a series of lower highs and lower lows.
But at some point, the bears become unwilling to add to their previously-established short positions. Those who were already long the market and had refused to sell higher would eventually be reduced to a hard core of traders who had their jaws set and refused to sell out. Traders not in the market who were perhaps unsuccessfully attempting to short the market at higher levels will begin to find the long side of the market more attractive. The first rally that “carries too high to be bearish” signals another possible trend reversal.
With this basic understanding of market psychology through three phases of a market, a trader is better equipped to appreciate the significance of all chart price patterns.
No one expects to establish short positions at the high or long positions at the low, but development of a feel for market psychology is the beginning of the quest for trades that even hindsight could not improve upon.
When you analyze charts, approach them with the idea that they reflect human ideas about prices that are the result and the struggle between supply and demand forces. Your attitude and ability to judge market psychology will determine your success at chart analysis. Unexpected occurrences can change price trends abruptly, and without warning. Also, some of the chart formations may be hard to visualize, you’ll sometimes need a good imagination as well.
MEMORIZE THESE THREE PHASE SCENARIOS – EVERY TRADER SHOULD BE ABLE TO RECITE IT FROM MEMORY!!
This concludes our free trading lesson series by Joe Ross. We thank you for investing in yourself by broadening your trading knowledge.
The correspondence sent by trading educators is intended to help teach you how to trade, improve your trading skills, or both. As you continue to receive our weekly emails, there may be sections which are difficult to understand upon first reading. Our material and concepts are meant to be studied, and studied multiple times. Many traders may not be able to grasp these with just a cursory reading of the text. Feel free to email us with questions and check our blog.
Chart Scan Newsletter is delivered to your inbox every Friday. Happy studying!
Joe Ross wants you to succeed! Check out our many products that Trading Educators has to offer. Our most popular resource that our students take advantage is Private Mentoring. Accelerate your trading knowledge and work one-on-one with the trader of your choice. Click here for more information and book your session today!


