Edition 598 - November 20, 2015

The team at Trading Educators is proud to announce the fresh, new look in our newsletter and website. You will still receive our high quality products and services with the most noticeable changes being an easier and more logical flow throughout our website. Happy Trading!
GRAND RE-OPENING SALE ~ 30% OFF*
Coupon Code: CELEBRATION30
Offer ends December 6, 2015
* This offer excludes 1-month subscription products and private tutoring

The Law of Charts with Commentary
by Master Trader Joe Ross
Author, Trader, Trading Mentor, and Founder of Trading Educators, Inc.
Old-Fashioned Chart Reading
The law of charts is to a large extent about chart reading, and chart reading incorporates some of the observations traders made over 100 years ago.
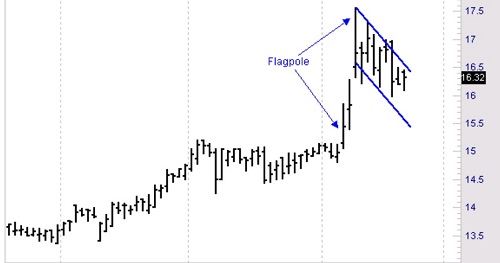
While these kinds of observations do not follow the strict rules of the Law of Charts, they are interesting, and it is exciting to see them work. Of course, we know that nothing works all the time, but it might be interesting to follow the chart of an investment (see the chart below).

The “wisdom of the ages” states that following a breakout from consolidation, if prices shoot up creating what looks like a “flagpole,” and are then followed by a flag or pennant formation such as you see on the chart, when prices resume rising, they will rise again by the height of the flagpole. The flagpole begins its ascent at 15.20, which is a violation of the high of the consolidation. Prices then rise to a high of 17.56, so the total height of the flagpole is 2.36.
The low of the pennant formation is 15.98. Therefore the projection is that prices will rise to at least 18.34.
© by Joe Ross. Re-transmission or reproduction of any part of this material is strictly prohibited without the prior written consent of Trading Educators, Inc.

Spread Scan with Commentary
by Master Trader Andy Jordan
Educator for Spreads, Options, Swing/Day Trading, and Editor of Traders Notebook
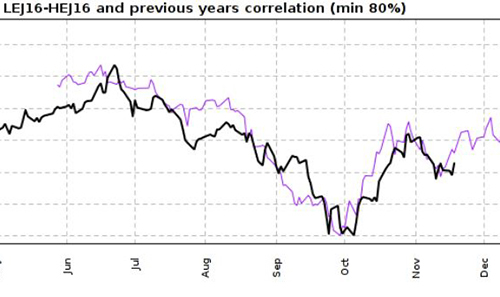
This week, we're looking at LEJ16 – HEJ16: long April 2016 Live Cattle and short April 2016 Lean Hogs (CME at Globex).

Today we consider an inter-market spread in the meats: long April 2016 Live Cattle and short April 2016 Lean Hogs (elec. symbols: LEJ16 – HEJ16). This spread has been nicely following the correlation chart (correlated with the years 1976 and 1983, see chart above) and we might see a strong up-move during the next few days. In addition to the close correlation to the years 1976 and 1983 there is a strong seasonal up-move in the time between 11/24 and 12/21.
Find out more about how to manage this and other trades in our daily detailed trading newsletter Traders Notebook.
© by Andy Jordan. Re-transmission or reproduction of any part of this material is strictly prohibited without the prior written consent of Trading Educators, Inc.
Stealth Trader with Commentary
by Master Trader Andy Jordan
Educator for Spreads, Options, Swing/Day Trading, and Editor of Traders Notebook
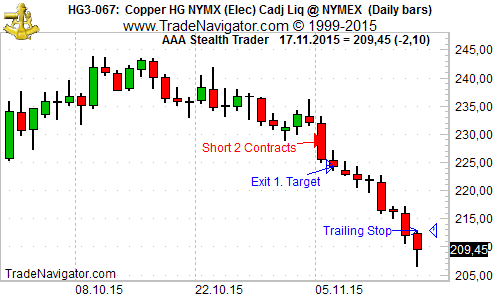
On November 4th, our method "Stealth Trader" generated an entry signal for the next trading day. We got short with 2 contracts: December Copper (first red arrow), and we reached our first target on the second day (first blue arrow). We are still in the trade with one contract using a simple trailing stop at the high of each daily bar (second blue arrow).

With an initial risk of approximately $1,100.00 per contract, the method generated a profit of $1,140.00 on the first contract, with an open equity of about $4,840.00 on the second contact.
Learn more about Stealth Trading!
© by Andy Jordan. Re-transmission or reproduction of any part of this material is strictly prohibited without the prior written consent of Trading Educators, Inc.
Trading Article
by Master Trader Marco Mayer
Educator for Forex and Futures, System Trader, and Creator of Ambush Trading Method
Hi Marco, looking at the successful large hedge funds who’re considered to be the best in the industry, is it really possible to outperform them?
That’s a really good question, and it can lead to some interesting insights - especially since the best performers often don't do better than making 10-15% a year, which for most retail traders with small accounts simply wouldn’t be worth the effort, right? What’s the point of making 10% on a $10,000 account in a year by day trading, when you’d make more by flipping burgers?
While most traders focus on what they consider the big advantage of large funds over retail traders, that is tons of capital, I have to strongly disagree. Nothing could be further from the truth, and talking to any successful CTA who started out with $100,000 and had a great performance for many years - as soon as the big money discovers them, that’s when things start to get much more difficult.
Imagine you have found a system that works great in a couple of markets like the DAX, Gold, and the E-Mini S&P 500. You have to get in and out of these markets multiple times a day. No problem to do that with 5 contracts in the DAX or gold, and for sure not in the S&P 500. You manage to achieve 50% a year for 3 years in a row. Of those 50%, 40% come out of the DAX and Gold trades, 10% you make in the ES.
At that point, big money gets interested in your fund, and now instead of managing half a million, you have 10 million to manage. Very quickly you start noticing the results of your system getting much worse due to lots of slippage in the DAX and Gold futures, and you’re forced to more actively trade the market which performed worst, the E-Mini S&P 500.
While more money comes in, you have to close the fund to new investors, think about new markets to trade, and how to adjust your system in the DAX and Gold markets. You develop new entry-techniques using limit-orders only, and limiting the trading times in those markets. This way you can still get a nice performance, but much less than before.
To make a long story short, yes, I think it’s possible to strongly outperform the big guys since it’s considerably easier to make 50% on a $10,000 account than on a $10,000,000 account! Think about it.
If you like, take it one step further and use that as an inspiration to think about what you can do by trading one contract in the DAX or any other small market, that you couldn’t do with 100 contracts. This might result in some interesting trading strategies...at least it did for me.
Happy Trading!
Marco
© by Marco Mayer. Re-transmission or reproduction of any part of this material is strictly prohibited without the prior written consent of Trading Educators, Inc.
To view previous published Chart Scan newsletters, please log in or click on "Join Us," shown above, to subscribe to our free "Members Only" section.
A WEALTH OF INFORMATION & EDUCATION:
Joe Ross-Trading Educators' popular free Chart Scan Newsletter has been published since 2004.
Note: Unless otherwise noted, all charts used in Chart Scan commentary were created
by using Genesis Financial Technologies' Trade Navigator (with permission).
Legal Notice and Copyright 2015 Disclaimer - Published by Trading Educators, Inc.
Chart Scan is a complimentary educational newsletter.
© by Trading Educators, Inc. Re-transmission or reproduction of any part of this material is strictly prohibited without prior written consent.


