Edition 599 - November 27, 2015

The team at Trading Educators is proud to announce the fresh, new look in our newsletter and website. You will still receive our high quality products and services with the most noticeable changes being an easier and more logical flow throughout our website. Happy Trading!

The Law of Charts with Commentary
by Master Trader Joe Ross
Author, Trader, Trading Mentor, and Founder of Trading Educators, Inc.
A 15-Minute Chart of the Euro/Dollar Forex Pair
"Trading by the Book" states that if prices break out of a trading range in one direction and then reverse and come through that range in the other direction, it is time to "sell the store."
However, looking at the chart below, we see that there was little way to know that such a thing would happen after the upside breakout of the trading range which was caused by an economic report.
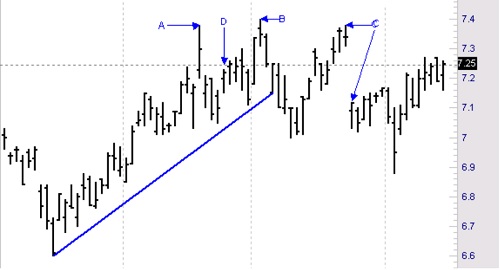
Nevertheless, the Law of Charts came to the rescue by providing a Reverse Ross hook.
The question is this: is the Reverse Ross hook telling us that momentum has truly changed, and should we risk going short based on a Traders Trick entry? Please note that a Reverse Ross hook can be somewhat different from a 1-2-3 high. A 1-2-3 high comes only at the end of a trend or a swing, but we have neither at the time in question.
We have an upside breakout of a trading range, and then a Ross hook due to the fact that following the breakout of the trading range, prices failed to go higher. So the formation I’ve labeled a-b-c is what is known as a Reverse Ross hook (RRh). The RRh is discussed in detail in my book "Trading the Ross Hook."
There is a reliable way to know with a high degree of certainty whether or not to use the Traders Trick to try to get into the trade. It is a specialized use of the stochastic study. The settings are nothing special, 5-3-3. It is the use that is special. If the fast stochastic has crossed below the slow stochastic at the time you seek to enter the trade, then it is a low risk opportunity to enter short using a tight stop for protection. The graph is not very clear because of the colors I used, but if you look closely, you can see the upper dotted line (the fast Stochastic) cross the lower line (the slow Stochastic). The result of taking the trade was a handsome profit.
© by Joe Ross. Re-transmission or reproduction of any part of this material is strictly prohibited without the prior written consent of Trading Educators, Inc.

Spread Scan with Commentary
by Master Trader Andy Jordan
Educator for Spreads, Options, Swing/Day Trading, and Editor of Traders Notebook
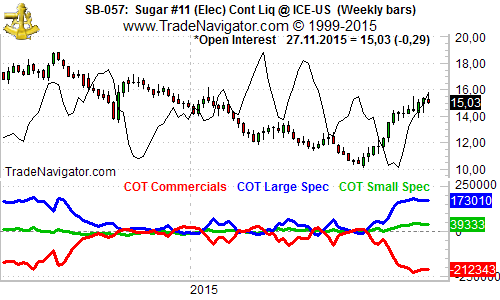
Sugar has been moving higher since September, almost reaching the January high. As we note from the chart below, Commercials are extremely net short at the moment, while the Large Speculators can be found at the other extreme to the long side. While this is not a guarantee that the market will turn around and move lower, there is at least a good chance that the market will not move much higher at the moment. We consider selling calls under these conditions, but with the idea of hedging the calls with some puts as soon as the market starts to shoot higher again.
Find out more about how to manage this and other trades in our daily detailed trading newsletter Traders Notebook.
© by Andy Jordan. Re-transmission or reproduction of any part of this material is strictly prohibited without the prior written consent of Trading Educators, Inc.
Trading Article with Commentary
by Master Trader Andy Jordan
Educator for Spreads, Options, Swing/Day Trading, and Editor of Traders Notebook
Benefits of Long-Term Charts
The longer term charts can be very revealing, even if you are a shorter term trader. Longer term charts are educational, and definitely help you to see things in perspective. Pay attention to what you see, and analyze in accordance with the following questions:
Note the yearly ranges for the commodities you trade. What is this yearly high and low, are they higher highs, lows and closes compared with last year? Does the close confirm price action? What is the long-term trend? How does this year's range compare with the last three years' average range? Should next year have greater volatility than this year? How much, in dollars, was the price move from the annual lowest low to highest high? How much did you take out of that range? What should next year's high and low be for the commodities you trade, based on the yearly trend analysis?
These questions define the yearly long-term price bars, using the monthly price bars to answer them. Use weekly price bars to answer major trend questions for monthly highs and lows.
© by Andy Jordan. Re-transmission or reproduction of any part of this material is strictly prohibited without the prior written consent of Trading Educators, Inc.
Ambush Method Trade and Performance Report
by Master Trader Marco Mayer
Educator for Forex and Futures, System Trader, and Creator of Ambush Trading Method
It’s time to look at the stock market again, after all the examples about currencies and commodities! This week, I've chosen one of the less popular futures markets among traders, the EuroSTOXX 50, traded at Eurex.
It seems that retail traders usually prefer the DAX, since there’s more action, and the tick value is much higher. In my opinion, the DAX tick is too high for most traders, often leading to margin calls. Happily, there’s a Mini-DAX Futures now, which I think has a lot of potential!
For a strategy like Ambush that require larger stops, the EuroSTOXX is a much better choice for most traders. It’s also easier to predict, and has less noise and fewer crazy moves than the DAX. Plus, there’s a lot more volume in the EuroSTOXX.
Looking at the daily chart of the FESX, we can see tons of consolidations, hard to predict price moves, and many reversal-bars or other bars with long-tails. This is perfect for Ambush, which was built to exploit exactly that kind of market action!
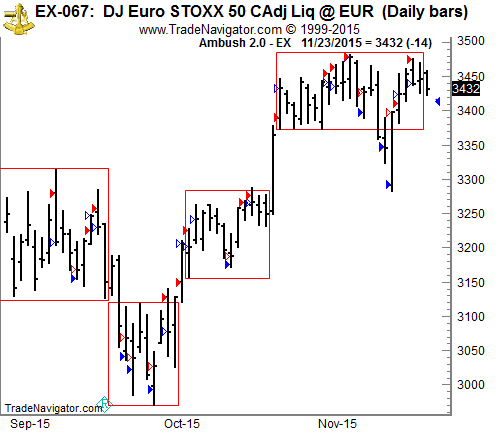
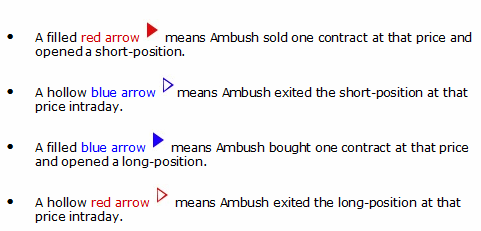
On the chart above are four different kinds of arrows:
Let's examine the results of those trades (including $10 for commissions and slippage round-turn) trading just one EuroSTOXX 50 Futures (FESX) contract:
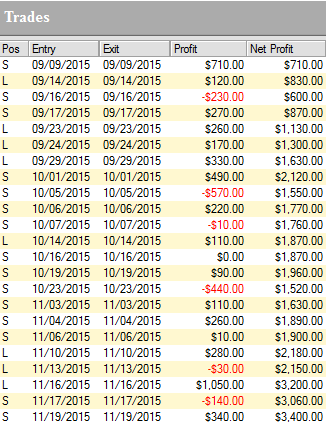
As you can see, Ambush managed to make a total of $3,400.00 profit (including $10 for commissions and slippage round-turn) trading just one contract without keeping any positions overnight!
Click on the link below to see the long-term performance of the EuroSTOXX 50 Futures (FESX) and all other markets supported by Ambush:
View The Reports Now
© by Marco Mayer. Re-transmission or reproduction of any part of this material is strictly prohibited without the prior written consent of Trading Educators, Inc.
To view previous published Chart Scan newsletters, please log in or click on "Join Us," shown above, to subscribe to our free "Members Only" section.
A WEALTH OF INFORMATION & EDUCATION:
Joe Ross-Trading Educators' popular free Chart Scan Newsletter has been published since 2004.
Note: Unless otherwise noted, all charts used in Chart Scan commentary were created
by using Genesis Financial Technologies' Trade Navigator (with permission).
Legal Notice and Copyright 2015 Disclaimer - Published by Trading Educators, Inc.
Chart Scan is a complimentary educational newsletter.
© by Trading Educators, Inc. Re-transmission or reproduction of any part of this material is strictly prohibited without prior written consent.


