Edition 601 - December 11, 2015

The holidays are approaching. As you prepare for your festivities, we hope you'll take the time to slow life down enough to enjoy and make many fond family memories. To help you with any last minute gift ideas, please visit our Traders Wish List.

The Law of Charts with Commentary
by Master Trader Joe Ross
Author, Trader, Trading Mentor, and Founder of Trading Educators, Inc.
Tradable Markets
Quite often I am asked about what condition a market has to be in to be tradable. Sometimes it is easier to show with a picture when a market is not tradable except for a very short-term scalper.
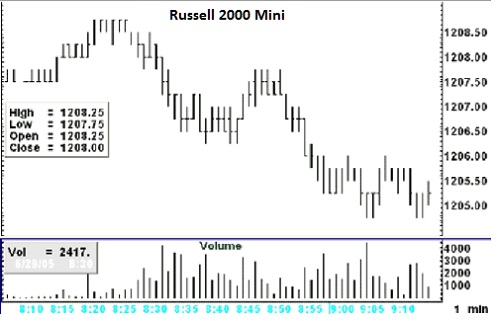
When prices have a "boxy" look, the market becomes very difficult to trade. What causes a boxy appearance? If you look at the chart below, I will attempt to explain.

Notice the following:
- Volume at 8:30, the opening minute, is only 2,417. Three minutes later, the per-minute volume is 4,193, an acceptable amount it would seem. But is it? Volume does not take into consideration liquidity. Liquidity consists of both decent volume and good participation, meaning buyers are hitting the offer and sellers are hitting the bid. The volume of 4,193 might have involved as few as two traders.
- Prices tend to make multiple exact highs and lows, giving the chart a boxy look.
- Opens and Closes tend to cluster at the same level.
- Prices do not look much different from the way they looked in the early morning Globex trading.
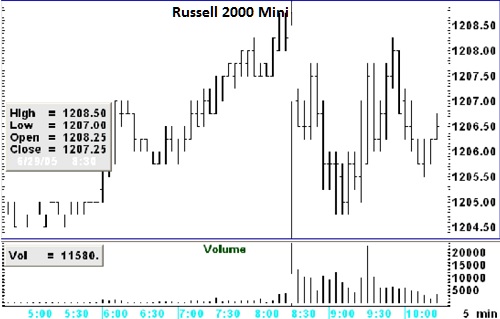
If we go to a 5-minute chart, things do not look a whole lot better.

Volume in the first five minutes of trading was 11,580, which amounts to an average of only 2,316 contracts/minute. Not a very healthy volume for doing much of anything. The 5-minute chart displays the same type of problems we saw on the 1-minute chart: double highs and lows, and clusters of Opens and Closes. The boxiness of the 5-minute chart is a sign of lack of liquidity. This means that traders are not trading. The action that is going on is limited to a few traders who are literally picking each-others’ pockets.
The e-mini Russell 2000 has often been as you see it on the charts above. The situation goes back at least three years. Is it any wonder that 90% or more of newbies are getting their heads handed to them in this market? Unless you go out to the larger time frames, you are facing a very difficult situation.
© by Joe Ross. Re-transmission or reproduction of any part of this material is strictly prohibited without the prior written consent of Trading Educators, Inc.

Spread Scan with Commentary
by Master Trader Andy Jordan
Educator for Spreads, Options, Swing/Day Trading, and Editor of Traders Notebook
Last week we looked at the Japanese Yen, and we developed a trading idea using futures contracts on a breakout of the trading range. Trading the breakout idea using the Japanese Yen futures contract is high risk (about $1,000 per contract), and is not always suitable for traders with smaller trading accounts.
Traders with smaller accounts can use the Forex pair USD-JPY or the ETF with the symbol FXY, but keep in mind the ETF will not trade 24 hours (as does the Futures or the Forex pair).
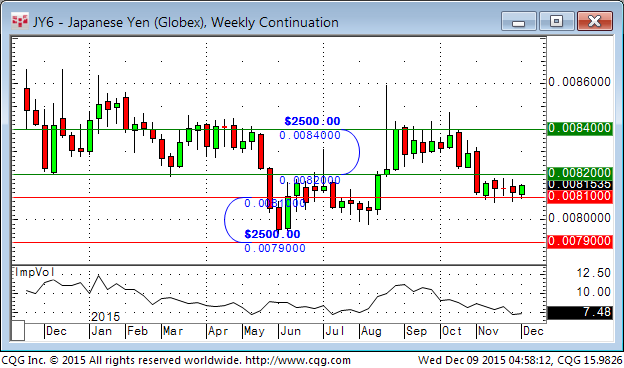
Another possibility would be to use options. As you can see on the weekly chart below, the Implied Volatility for the Japanese Yen is very low at the moment. Therefore, I'd rather buy options instead of selling them (even if I am not really a friend of buying options). More specifically, I'd look into buying a March 82/84 call spread or buying a March 81/79 put spread, depending on the breakout.
Remember: we use far out-of-the-money strikes when we sell options, but we go very close with the strike when we buy options.

As of today, the price for spreads is approximately $700 to $800, but might be slightly higher on the breakout. The maximum profit we can make on the trade would be $2,500 – entry price.
The advantage of this strategy would be the maximum risk in form of the payed premium. The disadvantage is the limitation of the profits.
We can, of course, also buy a naked call or a naked put, but this would markedly increase the premium we have to pay for the options.
Profitable trades are attainable! To find out how to manage this and other trades, and also to receive our daily detailed trading newsletter, subscribe to Traders Notebook.
© by Andy Jordan. Re-transmission or reproduction of any part of this material is strictly prohibited without the prior written consent of Trading Educators, Inc.
Stealth Trader with Commentary
by Master Trader Andy Jordan
Educator for Spreads, Options, Swing/Day Trading, and Editor of Traders Notebook
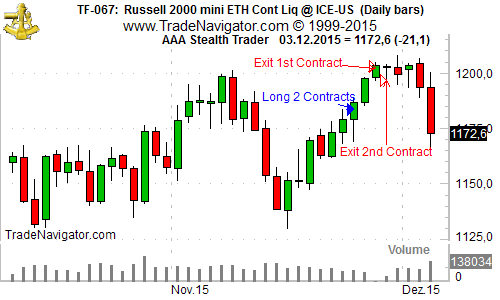
On November 23rd, our "Stealth Trader" method generated an entry signal for the next trading day. We got long with 2 contracts on the December Russell 2000 mini (first blue arrow), and we reached our first target on the third day (first red arrow). We trailed the stop for the second lot at the low of each daily bar, and got stopped out on November 27 with a nice profit (second red arrow).

With an initial risk of approx. $1,500 per contract, the method generated a profit of $3,240 (trading two contracts).
Find out more about Stealth Trader!
© by Andy Jordan. Re-transmission or reproduction of any part of this material is strictly prohibited without the prior written consent of Trading Educators, Inc.
Trade Article
by Master Trader Marco Mayer
Educator for Forex and Futures, System Trader, and Creator of Ambush Trading Method
Hi Marco, I'm thinking of moving forward from a discretionary into a more systematic trading approach. Is it worth doing so?
That's a really good question, and one I thought about 5 years ago when I decided to dive into developing trading systems. I could tell you a lot about this topic, but here are some thoughts that might help you decide.
First of all, developing and trading systems is everything but easy. There is a steep learning curve with many challenges. If you don’t know how to program, it's even harder, since you need to learn some programming basics if you seriously want to do this.
Some more challenges are getting the right data, understanding which data to use for what (especially with futures, think about rolling contracts, etc.) and knowing the many pitfalls, such as how to avoid overfitting a system, and checking if the backtests are realistic and likely to work in the real markets. For example, you can’t imagine how easy it is to come up with a system that looks like magic in the backtest, but has zero value in the world of trading, because you didn’t think about slippage and commissions.
Now, having said all this, I personally am happy I made the transition, and wouldn't want to go back to 100% discretionary trading right now. I still enjoy it, but do only some day trading that’s not systematic. For me, the serious money is in trading systems. Here are some of the reasons:
-
A backtest will always be a backtest, but if you know how to do it right it will tell you a lot about what to expect:
- What drawdowns to expect in the future.
- When something is wrong, such as the markets changing.
- How much to risk per trade.
-
Psychologically, I find it easier to trade systematically, but don't think it's easy:
- I don’t have to make decisions every day, which is a big relief, especially on bad days.
- I don’t get burnout from watching the charts all day.
- I’m less likely to do something stupid from looking at live quotes all day.
- If there is a drawdown, I can look back and understand that it’s nothing unusual. When do you know that in discretionary trading?
-
I personally am not the most important factor anymore:
- If I am "the edge" everything depends on me and my moods, etc.
- If I have a bad day, my trading probably does too. But when I’m out of the zone for whatever reason, I can still run my systems as usual.
- And the biggest one: My trading takes just a couple of minutes a day. Even though I'm day trading some markets, I know at what time I have to place my orders, if any, and when to come back again. For some markets this is on different times each day, but it’s still just a couple of minutes in total. I am not tied to the screen anymore! A good example of such a method is the Ambush Method - it day trades, but you have to be there only at the open and the close.
Not having to babysit the markets all day gives me time to work on new systems, to improve things, or to simply do what a trader likes to do: enjoy the free time. Isn’t that why we all started?
Happy Trading!
Marco
If you don’t like to develop trading systems on your own, consider Marco’s Ambush Method. If you would like to learn about how to develop trading systems, then sign-up to be tutored by Marco to help speed up the process.
© by Marco Mayer. Re-transmission or reproduction of any part of this material is strictly prohibited without the prior written consent of Trading Educators, Inc.
To view previous published Chart Scan newsletters, please log in or click on "Join Us," shown above, to subscribe to our free "Members Only" section.
A WEALTH OF INFORMATION & EDUCATION:
Joe Ross-Trading Educators' popular free Chart Scan Newsletter has been published since 2004.
Note: Unless otherwise noted, all charts used in Chart Scan commentary were created
by using Genesis Financial Technologies' Trade Navigator (with permission).
Legal Notice and Copyright 2015 Disclaimer - Published by Trading Educators, Inc.
Chart Scan is a complimentary educational newsletter.
© by Trading Educators, Inc. Re-transmission or reproduction of any part of this material is strictly prohibited without prior written consent.


