Edition 602 - December 18, 2015

The team at Trading Educators wish you and your family a very special holiday. We hope that you balance family and work, to keep you, as a trader, and your family, happy, healthy, and strong.
We will not publish a newsletter next week, December 25, 2015. The new year edition will arrive on January 1, 2016.
Our Traders Wish List, which includes both our products and those of others, is still available on our website if you need some last-minute gift ideas.

The Law of Charts with Commentary
by Master Trader Joe Ross
Author, Trader, Trading Mentor, and Founder of Trading Educators, Inc.
Euro Fx

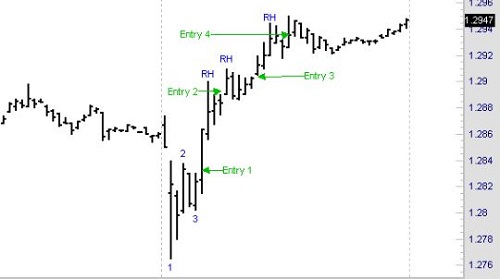
As you can see, Euro FX (10-minute chart) made a 1-2-3 low. On the bar marked 3, there was a Traders Trick entry to go long 1-tick above the high. I marked that "Entry 1."
Prices shot up and then corrected, giving me my first Ross hook (RH) of the day. Entry 2 from the Traders Trick, along with good trade management, offered an opportunity for a small win, but more than likely a breakeven trade.
Another RH formed a couple of bars later, which provided a second Traders Trick Entry. This time prices moved up nicely, and good profit was available. I labeled that Ross Hook "Entry 3."
Finally, you see Entry 4, which took place just ahead of exhaustion. The Close of the highest bar shows that momentum was no longer there. Still, the worst that could have happened with that trade was to break even. There were enough ticks to ensure that result.
The Traders Trick, along with The Law of Charts (TLOC), continue to provide opportunities for traders willing to learn to use them. Keep your eyes on the charts, they are the sources of the best trades.
© by Joe Ross. Re-transmission or reproduction of any part of this material is strictly prohibited without the prior written consent of Trading Educators, Inc.

Spread Scan with Commentary
by Master Trader Andy Jordan
Educator for Spreads, Options, Swing/Day Trading, and Editor of Traders Notebook
This week, let's examine one of the meats market: Lean Hogs.
.png?i=756)
As you can see on the chart above, Lean Hogs has been moving slightly higher since mid-November. Is this a change of direction or only a correction of the strong down-move in October/November? So far, we don't know, but as long as the 55.000 level holds, there is a good chance Lean Hogs will not move much lower. And that's all an options seller needs to know. With the Implied Volatility at a good level, aggressive traders might start to sell puts at the current level while more conservative traders might want to wait for the next up-move.
Find out more about how to manage this and other trades in our daily detailed trading newsletter Traders Notebook.
© by Andy Jordan. Re-transmission or reproduction of any part of this material is strictly prohibited without the prior written consent of Trading Educators, Inc.
Trading Article with Commentary
by Master Trader Andy Jordan
Educator for Spreads, Options, Swing/Day Trading, and Editor of Traders Notebook
Andy, if I get all my buy and sell signals to work properly, I should come out a winner, right?
Wrong! The perennial questions are, "Should I buy? Should I sell?" All too many traders focus their efforts on identifying buy and sell signals. In fact, that’s what most trading books consist of—some way to find buy and sell signals. Trading systems are usually all about "where to get in."
The research and analysis traders use is geared towards reaching the goal of getting that magic "base line" directive to guide their actions. How misguided can they be?
Any successful, experienced trader will tell you that although properly identifying buy/sell signals is important, it’s not the key to being successful. Instead, the way you manage each trade is what will determine your success.
Traders who take the baseline approach tend to believe that the success of their trading activity is dependent on following the right buy/sell signals at the right time. Clearly, it’s important that a trader be able to understand the process of generating signals and to use the methods involved. Realistically though, almost any trader can find a way to generate signals (whether using technical methods already out there, coming up with their own system, or using their platform’s automated signal generation tools).
Successful, experienced traders will tell you that your trade doesn't begin and end with a buy or sell. There’s a trade management process involved. For each trade you make, you’re making a group of decisions. The way you manage and time those decisions is what will determine the success of your trade. Let’s say two traders get the same signal at the same time, and act on it. One’s trade may result in profits, while the other's results in losses. How is this possible? It can occur because each trader made a different combination of decisions throughout the course of the trade. The decisions might include scaling in and/or out of the trade, using or not using trailing stop losses, setting or not setting profit objectives prior to entry, patience or lack thereof, etc. The trader who made the most effective overall combination of decisions will have the better trade results in the end. Of course, there are times when pure chance gives the better result to the worst trader.
It's very important to regard trading as a process, and to understand that as a trader, your efforts need to be focused on the activity of trading itself, as opposed to getting a quick base line answer. Because there are many things to take into consideration in making your trades successful, it’s essential that you educate and train yourself in all the different areas. Learn how to develop better trading plans and analysis methods, and then learn how to apply what you’ve developed to the process of making a trade – from the original impulse to enter or stay out of a trade to the control, of your thought processes and emotions in managing that trade.
© by Andy Jordan. Re-transmission or reproduction of any part of this material is strictly prohibited without the prior written consent of Trading Educators, Inc.
Ambush Method Trade and Performance Report
by Master Trader Marco Mayer
Educator for Forex and Futures, System Trader, and Creator of Ambush Trading Method
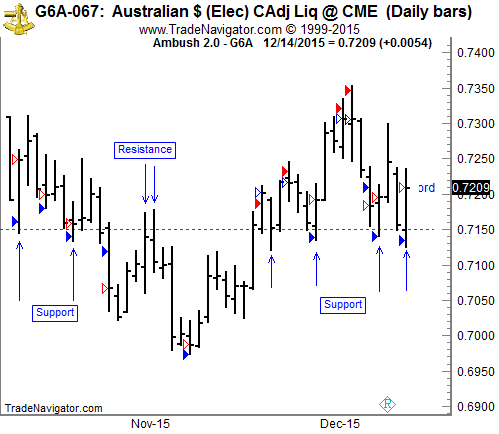
This week, let’s share some thoughts on support/resistance using the daily chart of the Australian Dollar Futures (6A, AUD/USD Spot Forex).
I’ve marked the most important price level in this market during the last couple of months, and that is 0.7150. Even if you don’t pay much attention to the concept of support and resistance levels in your trading, you should be aware of it.
Why? Because it’s simply too obvious to ignore. And if that is the case for you, be sure other traders are aware of it too. That is why you should have marked that exact level on your charts, because it is then a self-fulfilling prophecy. Whether you believe in it or not, others will!
How do you spot such a level of interest? Look for accumulations of swing highs/lows around the same price. On a daily chart it will never be exactly the same price, but fairly close. Also, look for levels that react on both sides, support that turns into resistance, and the other way around. The longer the timeframe in which you can spot these, the more important they usually are. Simply put, if you can see them on a weekly chart, they will also be obvious on a daily, on a 4-hour, and on an hourly chart. More traders will notice them. The other way around, you’ll have many potential levels on a 5-minute chart, but those trading on a daily chart won’t notice 90% of them (unless they mark the high/low of a day).
One more thing to notice here is how well Ambush traded at that 0.7150 level multiple times. It nicely got in around that price pretty much at the low of the days price, and then reversed at the support mark. This is to some degree accidental, since Ambush doesn’t use support/resistance directly, but it is surely a nice coincidence!

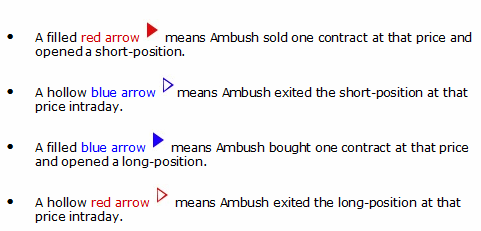
On the chart above are four different kinds of arrows:

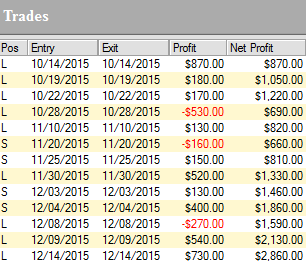
Let's examine the results of those trades (including $10 for commissions and slippage round-turn) trading just one Australian Dollar Futures (6A) contract:

As you can see, Ambush managed to make a total of $2,860.00 profit (including $10 for commissions and slippage round-turn) trading just one contract without keeping any positions overnight!
Click on the link below to see the long-term performance of the Australian Dollar Futures (6A) and all other markets supported by Ambush:
View the Reports Now
© by Marco Mayer. Re-transmission or reproduction of any part of this material is strictly prohibited without the prior written consent of Trading Educators, Inc.
To view previous published Chart Scan newsletters, please log in or click on "Join Us," shown above, to subscribe to our free "Members Only" section.
A WEALTH OF INFORMATION & EDUCATION:
Joe Ross-Trading Educators' popular free Chart Scan Newsletter has been published since 2004.
Note: Unless otherwise noted, all charts used in Chart Scan commentary were created
by using Genesis Financial Technologies' Trade Navigator (with permission).
Legal Notice and Copyright 2015 Disclaimer - Published by Trading Educators, Inc.
Chart Scan is a complimentary educational newsletter.
© by Trading Educators, Inc. Re-transmission or reproduction of any part of this material is strictly prohibited without prior written consent.


