
Edition 629 - July 1, 2016

"If you are going to trade, try to learn something about everything and everything about something." ~ Joe Ross

The Law of Charts with Commentary
by Master Trader Joe Ross
Author, Trader, Trading Mentor, and Founder of Trading Educators, Inc.
Trading Range
The chart below shows a typical trading range on the crude oil chart. The range shown was defined in my manuscript “Trading by the Book.”
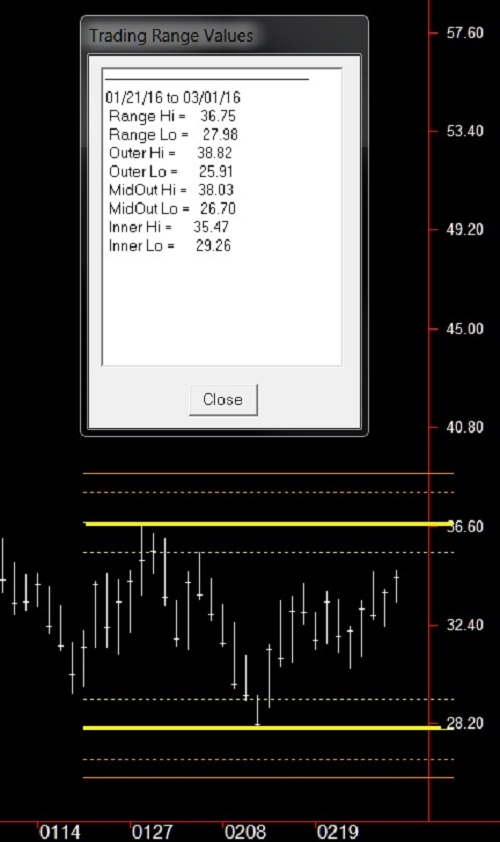
Let´s take a look at the various horizontal lines you see on the chart, which form a trading envelope.
The high and low of the range are defined by the bright yellow bars. The high is set at 36.75, and the low at 27.98.
The dotted white lines above and below the yellow range lines are set at a fixed distance .146 above the low of the range (29.26), and below the high of the range (35.47). These form an inner envelope. Prices that enter into the inner envelope have a high propensity to bounce and move opposite to the direction from which they came.
The dotted orange lines below (26.70), and above (38.03) the yellow range lines are set at a fixed distance .146 outside of the range, and form an intermediate external envelope. Prices that enter into the intermediate envelope offer a warning to be cautious of a possible breakout coming.
The solid orange lines above and below the yellow range lines are set at fixed distance .236 above the range high at (38.82), and below the low at (25.91). These form the outer limits of the trading envelope. If prices violate the outer limits of the envelope, prices are probably trending, and will have formed a 1-2-3 high or low within the envelope, and possibly have formed a Ross Hook as well.
The trading envelope has proven to be excellent for trading option boxes, and for trading within the general limits of the envelope.
© by Joe Ross. Re-transmission or reproduction of any part of this material is strictly prohibited without the prior written consent of Trading Educators, Inc.

The Future is Never Certain
by Master Trader Joe Ross
Author, Trader, Trading Mentor, and Founder of Trading Educators, Inc.
When trading the markets, uncertainty is often a fact of life. Consider the plight of Jack who tried to add as much certainty into his trading as possible. He decided to invest in a solid retailer. Consumer confidence was high and sales had been high at the retail stores for the past two years. He looked closely at the five-year chart and noticed a clear, upward trend. When the price did temporarily drop, the most it had ever fallen in the past five years was about $3. It was currently trading at $40. He decided to buy 2000 shares and protected himself by placing a stop at $37. He reasoned that the past five years would be a good indicator of what might happen in the next year: the stock price should continue to rise and should only fall by $3 at the most.
There was something psychologically pleasing about studying the fundamentals of the company and its past stock performance. He felt assured. Even though his risk was almost 8% of his trading capital, he decided the risk was worth the reward.
Unfortunately, history only repeats itself when it does. A month after entering the trade, the stock price fell to $35. Jack couldn't believe what happened. He thought, "How could I have been so wrong? I had considered all possibilities." Many novice traders think like Jack. They seek out a level of consistency in the financial markets that just does not exist. They believe that the markets follow natural laws and falsely believe that there are some magical mathematical principles that underlie it all. Big time institutional investors may be able to forecast the market action in the long term, but they have mountains of capital and can attempt to hedge risk, and even they have great difficulty merely matching the yearly increases of the indexes. For the smaller investor or trader, there are no secret mathematical formulas. The past is the past, and what happened in the past may not forecast the future.
Don't falsely think that you can forecast market action with the same precision a physicist can program a satellite to reach Mars. The markets don't follow natural laws. There are many unknown factors that underlie the price action. The best you can do is study all available information and make an educated guess. As long as you manage risk, you can make trade after trade and get the odds to work in your favor. You won't be right all the time, but you'll be right enough of the time to make a profit. It may be pleasing to think that you can add certainty to trading, but you can't. You'll feel better in the long run and trade more profitably if you accept the fact that the future is uncertain.
Whether you are a long-term investor or a short-term trader, you might be looking through reams of information, such as charts, analyst commentaries, and financial statements, to arrive at a wise decision. You may have to sift through it all, weigh it appropriately, and use your intuition to make the most informed decision possible.
Usually, it's merely an educated guess in the end. Traders are hardly objective, logical processors of information. They suffer from what decision-making theorists call confirmation bias. When devising a trading plan, there is strong pressure to reach a decision and implement a plan. The consequences of a wrong decision can be financially disastrous. The added pressure can get to us. Rather than look at each piece of information objectively, we tend to pay closer attention to information that confirms our initial decision while ignoring contrary information.
If you want to make sound trading decisions, you must fight the urge to seek out information that supports your initial expectations. As a basic rule of thumb, when trying to arrive at a sound decision, you should spend most of your time looking for information that goes against your initial hunches than information that confirms it.
© by Joe Ross. Re-transmission or reproduction of any part of this material is strictly prohibited without the prior written consent of Trading Educators, Inc.

Trading Idea
by Master Trader Andy Jordan
Educator for Spreads, Options, Swing/Day Trading, and Editor of Traders Notebook
This week, Andy is looking at the 30 Year T-Bonds and he explains an interesting trading idea using Options.
© by Andy Jordan. Re-transmission or reproduction of any part of this material is strictly prohibited without the prior written consent of Trading Educators, Inc.
This Week's Blog Post - Risk Management - Over-Trading
by Master Trader Andy Jordan
Educator for Spreads, Options, Swing/Day Trading, and Editor of Traders Notebook
Winners learn more from losses than from profits. When a profit is taken, there may be little room for improvement. When a loss is taken, a trader's self-discipline is the first thing to be examined. Read more.
© by Andy Jordan. Re-transmission or reproduction of any part of this material is strictly prohibited without the prior written consent of Trading Educators, Inc.
Watch Andy Jordan's Trading Plan Series:
Trading Plan Part 1 - The trading plan.
Trading Plan Part 2 - Who needs a trading plan? What will a trading plan do for you?
Trading Plan Part 3 - It is important to know yourself and your purpose.
Trading Plan Part 4 - How to set the right trading goals.
Trading Plan Part 5 - Explains the markets, time frames, trading vehicle, brokers, software, and much more.
© by Andy Jordan. Re-transmission or reproduction of any part of this material is strictly prohibited without the prior written consent of Trading Educators, Inc.

Q&A Series - Episode 4
by Master Trader Marco Mayer
Educator for Forex and Futures, Systematic Trader, and
Creator of Ambush Trading Method and AlgoStrats.com
In his new Episode of his Questions & Answers Series, Marco answers the questions you sent in. Including a follow-up question of last week's video related to Pinbars, recommendations on Forex brokers, and why it's so hard to trade successfully on a 5-minute chart. Enjoy! If you have any questions, feel free to This email address is being protected from spambots. You need JavaScript enabled to view it., or post it in our Blog or Forum.
© by Marco Mayer. Re-transmission or reproduction of any part of this material is strictly prohibited without the prior written consent of Trading Educators, Inc.
AlgoStrats.com, Marco Mayer's (Systematic and Forex Expert) newest development is live and ready for you to experience it. AlgoStrats:FX Free Trials will start soon in early July, stay tuned! Follow Marco on Facebook and Twitter.

Check out our Blog!
To view previous published Chart Scan newsletters, please log in or click on "Join Us,"
shown above, to subscribe to our free "Members Only" section.
A WEALTH OF INFORMATION & EDUCATION:
Joe Ross-Trading Educators' popular free Chart Scan Newsletter has been published since 2004.
Note: Unless otherwise noted, all charts used in Chart Scan commentary were created
by using Genesis Financial Technologies' Trade Navigator (with permission).
Legal Notice and Copyright 2016 Disclaimer - Published by Trading Educators, Inc.
Chart Scan is a complimentary educational newsletter.
© by Trading Educators, Inc. Re-transmission or reproduction of any part of this material is strictly prohibited without prior written consent.

