
Edition 638 - September 2, 2016

Grab a copy at the current price while you still can. The price of Ambush Trading Method will increase to $1,299 of September 17, 2016. Use coupon code "ambush10" to get an additional 10% off the current price. Coupon is valid only through September 16, 2016 on the current price. No exceptions. Coupon is valid for the Ambush only. It is not valid for the Ambush/Stealth combo.

The Law of Charts with Commentary
by Master Trader Joe Ross
Author, Trader, Trading Mentor, and Founder of Trading Educators, Inc.
CCI
The lesson we want to gain from the chart below is how to anticipate the direction of a breakout from an area of consolidation – in this case a rather sloppy-looking congestion.
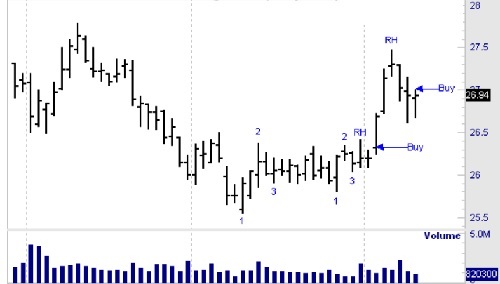
Notice that shortly after prices began to move sideways, at the end of the trend there was a 1-2-3 formation. However prices failed to violate the #2 point. Instead they moved into a tight consolidation containing too many price bars to be considered a ledge (10 bars limit). Within the congested area, a second 1-2-3 formed. This was followed by a Ross hook (Rh).
In anticipation of a breakout to the upside, a buy stop could have been placed as shown. The second 1-2-3 formation defined a trend. The Rh established the trend. A few days later, a second Ross hook formed. The last "buy" involves an ideal Traders Trick Entry, the kind we show people in our recorded Traders Trick webinar. Over the years there have been several refinements to the Traders Trick. In the recorded webinar, we show you how to receive a very high percentage of wins using the Traders Trick with the various refinements.
© by Joe Ross. Re-transmission or reproduction of any part of this material is strictly prohibited without the prior written consent of Trading Educators, Inc.
Does volume figure into your trading?
by Master Trader Joe Ross
Author, Trader, Trading Mentor, and Founder of Trading Educators, Inc.
It didn’t in the past because volume figures, when trading the daily charts, were a day late and a dollar short. But these days, where volume is live, it does count.
At Trading Educators we use both contract volume and tick volume as a guideline and filter for our trading.
Here’s a simple idea that works well for indexes. Most people ignore volume as an indicator. I think it’s overlooked and I will show you here how to use it to figure out possible turns in the market. The concept is that of a volume spike. If you will look at just about any weekly chart of the E-mini S&P 500, you will see what I'm talking about. Note the volume spikes that occur at the turning points in the market. This occurs when large numbers of contracts change hands. Usually it happens when the smaller trader gives up and sells his contracts. If enough traders do this at once and the price is right the professionals will come in and snatch up those contracts.
Therefore you have a large volume that occurs right at the bottom of a decline as the market is churning. The contracts move from the weak hands (the man on the street) to the strong hands (professionals).You need to look for volume that is larger than the last 10 bars´ volume. This is not cast in stone but is generally a good average to go by. You might decide that 8 bars are enough, it´s up to you. It also helps if the volume is substantially larger than the previous volume and is accompanied by a large downward move in price. I wouldn’t necessarily trade this as a standalone indicator but use it as a general warning of a possible change in Market direction. Does this work with intraday charts?
Absolutely. Volume is important.
© by Joe Ross. Re-transmission or reproduction of any part of this material is strictly prohibited without the prior written consent of Trading Educators, Inc.
WYNN Trade
Instant Income Guaranteed
Developer: Joe Ross
Administration and New Developments: Philippe Gautier
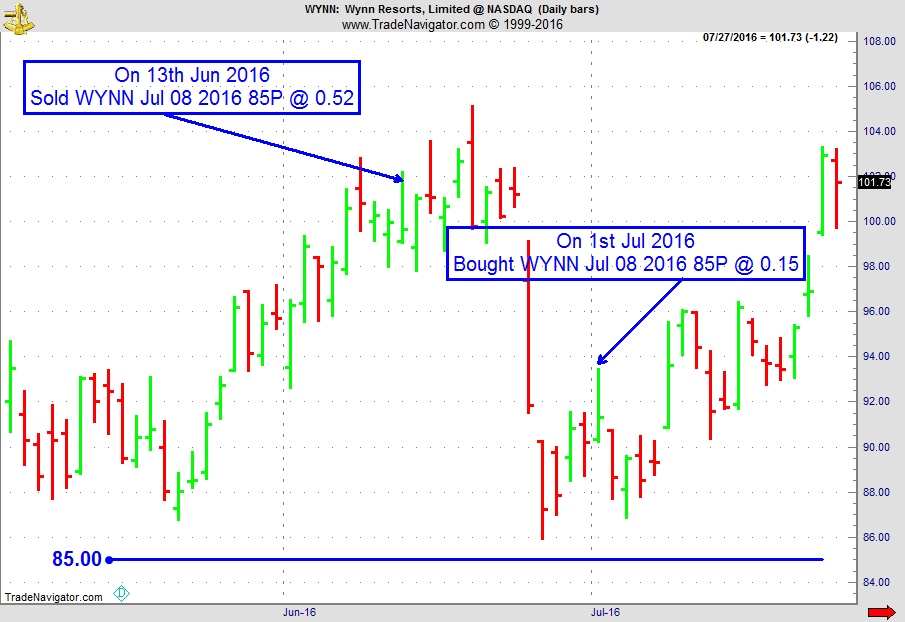
On 12th June 2016, we gave our IIG subscribers the following trade on WYNN, which was in an established uptrend, and was still under accumulation. We decided to sell price insurance as follows the following day:
- On 13th June 2016, we sold WYNN July 08 2016 85P @ $0.52, i.e. $52 per option sold; the short strike was well below price action (15% away) and below a major support level, so that the trade was safe, with only 25 days to expiration.
- On 1st July 2016, we bought back WYNN July 08 2016 85P @ $0.15, after 18 days in the trade; we easily "survived" the strong down move which happened 9 trading days after our entry, thanks to quick the time decay and our safely placed short strike.
Profit: $37
Margin: $1,700
Return on Margin Annualized: 44.13%
We have also added new types of trades for our IIG daily guidance, "no loss" propositions with unlimited upside potential, still using other people's money to trade.
Philippe
Receive daily trade recommendations - we do the research for you!
Instant Income Guaranteed
♦ SIGN UP TODAY! THIS IS WORTH THE INVESTMENT ♦
This includes a daily 80+ page report along with a daily podcast!
We review and supply the following:
-
our daily fills (entries, exits)
-
full real-time statistics of our weekly trades, closed trades for the current month, monthly statistics (detail and summary) since the beginning of IIG
-
daily market commentary (indices/sectors, volatility indices, main commodities related to our trade)
-
new trades for the following day
-
comments on our open trades, with all relevant news
-
updated earnings dates for our open positions
-
full details (days in trade, days to expiration, underlying close and price change, etc.) on our open trades (classic trades, complex positions, remaining rolled trades and covered calls)
-
active good till cancelled orders
-
dividends for the stocks owned
We also supply quite a number of extra "slides" in the appendix which are quite useful for new subscribers: recommendations, answers and explanations on the most frequent questions, techniques for entering trades, historical trades and real life examples, broker information, etc.
© by Joe Ross and Philippe Gautier. Re-transmission or reproduction of any part of this material is strictly prohibited without the prior written consent of Trading Educators, Inc.

Trading Idea
by Master Trader Andy Jordan
Educator for Spreads, Options, Swing/Day Trading, and Editor of Traders Notebook
On August 22nd our method “Stealth Trader” generated an entry signal for the next trading day. We got short with 2 contracts: September Copper (first red arrow), and we reached our first target on the third day (first blue arrow). We trailed the stop for the second lot at the high of each daily bar, and got stopped out on August 26th with a nice profit (second blue arrow).
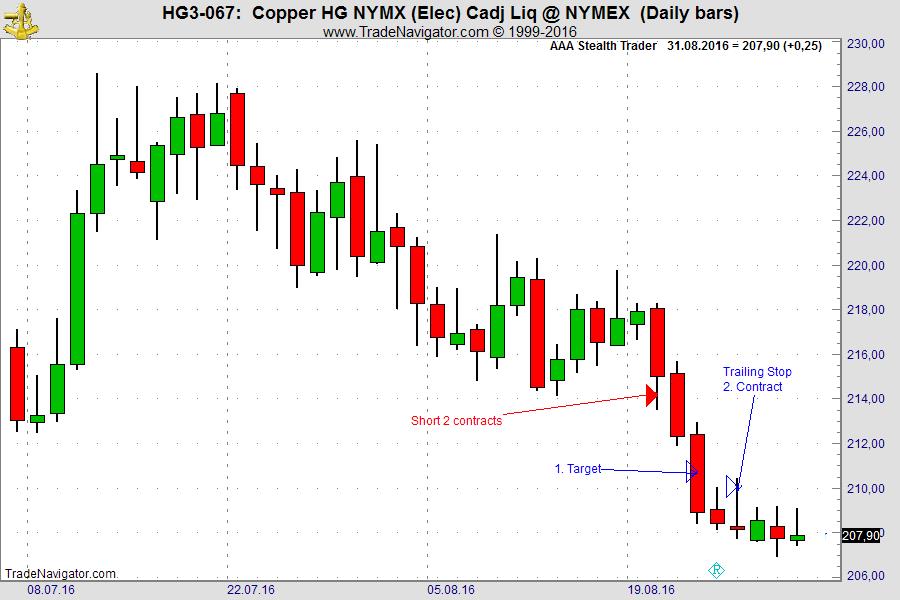
With an initial risk of approx. $840 per contract, the method generated a profit of $1,843 (trading two contracts).
Learn more about Stealth Trading!
© by Andy Jordan. Re-transmission or reproduction of any part of this material is strictly prohibited without the prior written consent of Trading Educators, Inc.
This Week's Blog Post - Learning from Mistakes
by Master Trader Andy Jordan
Educator for Spreads, Options, Swing/Day Trading, and Editor of Traders Notebook
If you make mistakes during trading, go back in your mind to see what you could have done better, or differently. There is usually something to learn from each...read more.
© by Andy Jordan. Re-transmission or reproduction of any part of this material is strictly prohibited without the prior written consent of Trading Educators, Inc.

This Week's Blog Post - Trading on Vacation: Good or Bad Idea?
by Master Trader Marco Mayer
Educator for Forex and Futures, Systematic Trader, and
Creator of Ambush Trading Method and AlgoStrats.com
Should you take your laptop to the beach to trade, or just close out all positions and forget about the markets for two weeks? Marco is just leaving for vacation, he'll let you know how he handles this as a systematic trader. Read more to find out!
© by Marco Mayer. Re-transmission or reproduction of any part of this material is strictly prohibited without the prior written consent of Trading Educators, Inc.
AlgoStrats.com - AlgoStrats:FX
by Master Trader Marco Mayer
Educator for Forex and Futures, Systematic Trader, and
Creator of Ambush Trading Method and AlgoStrats.com
Learn all you need to know about AlgoStrats:FX during this presentation by Marco Mayer. What is it, what's the idea behind it, why it is different from other services and how you'd profit from AlgoStrats:FX as a subscriber!
Join AlgoStrats:FX today!

Feel free to email questions to This email address is being protected from spambots. You need JavaScript enabled to view it., or post it in our Blog or Forum. Follow me on Facebook and Twitter!
© by Marco Mayer. Re-transmission or reproduction of any part of this material is strictly prohibited without the prior written consent of Trading Educators, Inc.

Check out our Blog!
To view previous published Chart Scan newsletters, please log in or click on "Join Us,"
shown above, to subscribe to our free "Members Only" section.
A WEALTH OF INFORMATION & EDUCATION:
Joe Ross-Trading Educators' popular free Chart Scan Newsletter has been published since 2004.
Note: Unless otherwise noted, all charts used in Chart Scan commentary were created
by using Genesis Financial Technologies' Trade Navigator (with permission).
Legal Notice and Copyright 2016 Disclaimer - Published by Trading Educators, Inc.
Chart Scan is a complimentary educational newsletter.
© by Trading Educators, Inc. Re-transmission or reproduction of any part of this material is strictly prohibited without prior written consent.

