
Edition 646 - October 28, 2016
 Let's be real. How many times have you encountered failed promises to "get rich quick" with your trading, and have taken huge hits to your bank account? Well, you won't find that here. Our philosophy is very clear and concise:
"Teach our students the truth in trading - teach them how to trade," and "Give them a way to earn while they learn - realizing that it takes TIME to develop a successful trader."
Invest in yourself today! Private tutoring is available with any of our three professional traders. Ask them the difficult questions, revise your trading plan, or whatever you feel that needs extra attention taking you to your next level of trading.

The Law of Charts with Commentary
by Master Trader Joe Ross
Author, Trader, Trading Mentor, and Founder of Trading Educators, Inc.
Trading Tops and Bottoms
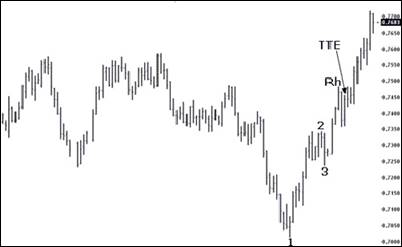
How do you trade markets that form "V" bottoms, or for that matter, "A" tops. The method I usually follow causes me to miss the first part of the move, but I feel that with "V" bottoms and "A" tops it is better to be safe than sorry. Typically, when prices form sharply-turned bottoms and tops, the move is considerable once it becomes established. Such was the case shown on the chart below. I've pointed out on the chart the way my method would allow me entry into the trade. It follows the rules for the Law of Charts. The Law states that the breakout of the #2 point of a 1-2-3 low defines a trend; a breakout of a Ross Hook establishes a trend.
Prices formed a potential #2 point at .7342. The pattern then corrected, but not enough to establish the #2 point. A #2 point by definition requires both a lower high and a lower low to form before a #2 point is in effect. Prices moved to .7343 where, by definition of both a lower low and a lower high following the move to .7343, there was a defined #2 point. Prices then made a higher low and a higher high, putting into effect the #3 point. Two bars later, a Ross hook was formed when prices failed to move higher. A Traders Trick Entry was in effect at .7459, leaving plenty of room to cover costs and take a profit. The rest is history, and it seemed that prices would soon arrive at .8000.
© by Joe Ross. Re-transmission or reproduction of any part of this material is strictly prohibited without the prior written consent of Trading Educators, Inc.
Question from a Subscriber:
by Master Trader Joe Ross
Author, Trader, Trading Mentor, and Founder of Trading Educators, Inc.
A reader asks: "Hey Joe! I’m pretty new at this. Can you tell me the rules for buy and sell stops?"
When the market trades above (“trades through”) a buy stop price order, it becomes a market order. The first down tick after the market order price is activated determines the highest price at which the buy stop order may be filled. The rule to remember placing stops is this, "Buy above and sell below." Buy stops are placed above the current market price, and sell stops are placed below the current market price. If a buy stop price is hit, the order then becomes a market order to be filled electronically or by the floor broker at the best price possible. If a buy stop is hit at 40, and the market trades 40, 45, 50, then 45, the worst fill a trader can receive is a 50, because 45 is the first down tick. In general, you must expect to get the worst fill possible. Anything better is a bonus. The exception to this rule is a fast market condition, when no one is legally held to any price.
© by Joe Ross. Re-transmission or reproduction of any part of this material is strictly prohibited without the prior written consent of Trading Educators, Inc.
SLB TRADE
Instant Income Guaranteed
Developer: Joe Ross
Administration and New Developments: Philippe Gautier
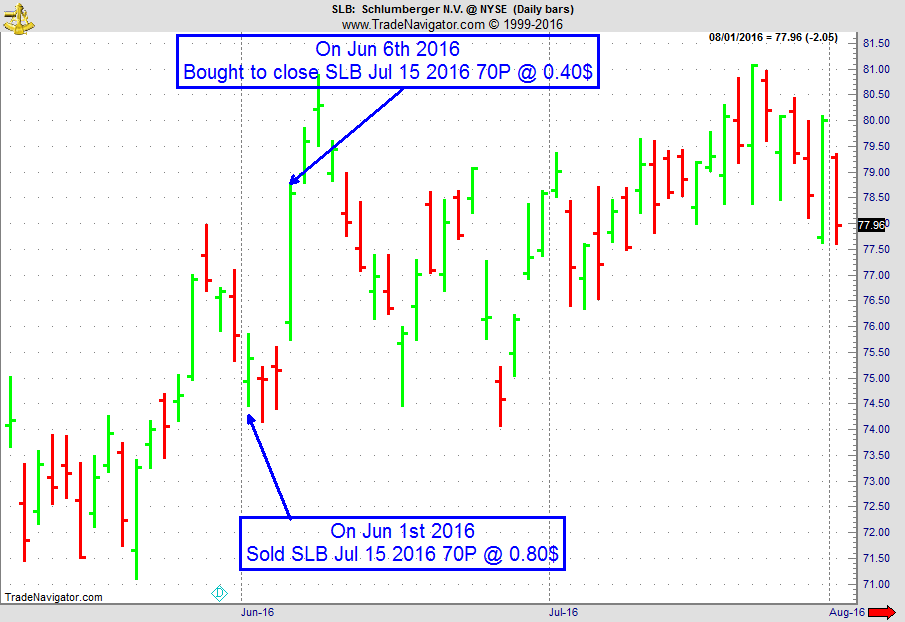
On 31st May 2016, we gave our IIG subscribers the following trade on SLB, which was showing accumulation on a pullback. We decided to sell price insurance as follows the following day:
- On 1st June 2016, we sold to open SLB Jul 15 2016 70P @ $0.80, i.e. $80 per option sold, with 44 days to expiration, and our short strike below a major support zone.
- On 6th June 2016, we bought to close SLB Jul 15 2016 70P @ $0.40, after 6 days in the trade, for quick premium compounding.
Profit: $40
Margin: $1,400
Return on Margin Annualized: 208.57%
We have also added new types of trades for our IIG daily guidance, "no loss" propositions with unlimited upside potential, still using other people's money to trade.
Philippe
Receive daily trade recommendations - we do the research for you!
Instant Income Guaranteed
♦ SIGN UP TODAY! THIS IS WORTH THE INVESTMENT ♦
This includes a daily 80+ page report along with a daily podcast!
We review and supply the following:
-
our daily fills (entries, exits)
-
full real-time statistics of our weekly trades, closed trades for the current month, monthly statistics (detail and summary) since the beginning of IIG
-
daily market commentary (indices/sectors, volatility indices, main commodities related to our trade)
-
new trades for the following day
-
comments on our open trades, with all relevant news
-
updated earnings dates for our open positions
-
full details (days in trade, days to expiration, underlying close and price change, etc.) on our open trades (classic trades, complex positions, remaining rolled trades and covered calls)
-
active good till cancelled orders
-
dividends for the stocks owned
We also supply quite a number of extra "slides" in the appendix which are quite useful for new subscribers: recommendations, answers and explanations on the most frequent questions, techniques for entering trades, historical trades and real life examples, broker information, etc.
© by Joe Ross and Philippe Gautier. Re-transmission or reproduction of any part of this material is strictly prohibited without the prior written consent of Trading Educators, Inc.

by Master Trader Andy Jordan
Educator for Spreads, Options, Swing/Day Trading, and Editor of Traders Notebook Complete and Traders Notebook Outrights
Andy is looking into the seasonal Feeder Cattle spread long May and short March 2017.
Traders Notebook Outright Futures Trading
by Master Trader Andy Jordan
Educator for Spreads, Options, Swing/Day Trading, and Editor of Traders Notebook Complete and Traders Notebook Outrights
If you are interested in outright futures short term swing trading, you should check out our new service Traders Notebook Outrights.
Traders Notebook Outright Guide explains the Outright trading service from Trading Educators. It shows you around on the Outright Campus and how to use the information provided by the service.
© by Andy Jordan. Re-transmission or reproduction of any part of this material is strictly prohibited without the prior written consent of Trading Educators, Inc.
Blog Post - Time
by Master Trader Andy Jordan
Educator for Spreads, Options, Swing/Day Trading, and Editor of Traders Notebook Complete and Traders Notebook Outrights
You pay a price for every profit you take with time and effort required to obtain it. Not to mention the years of experience upon which your knowledge and system methodology have...read more.
© by Andy Jordan. Re-transmission or reproduction of any part of this material is strictly prohibited without the prior written consent of Trading Educators, Inc.

This Week's Blog- FOMC Days = Crazy Days?
by Master Trader Marco Mayer
Educator for Forex and Futures, Systematic Trader, and
Creator of Ambush Trading Method and AlgoStrats.com
This Tuesday, we'll have another Federal Open Market Committee (FOMC) day. Whenever the FOMC meets and releases its rate decision and its statement, it’s seen as one of the most important data releases in the markets in the currency markets. But is it really such a market mover? What kind of moves can we actually expect on such a day? Well, let's find out and look at some statistics! Read more.
© by Marco Mayer. Re-transmission or reproduction of any part of this material is strictly prohibited without the prior written consent of Trading Educators, Inc.
Check out our Blog!
To view previous published Chart Scan newsletters, please log in or click on "Join Us,"
shown above, to subscribe to our free "Members Only" section.
A WEALTH OF INFORMATION & EDUCATION:
Joe Ross-Trading Educators' popular free Chart Scan Newsletter has been published since 2004.
Note: Unless otherwise noted, all charts used in Chart Scan commentary were created
by using Genesis Financial Technologies' Trade Navigator (with permission).
Legal Notice and Copyright 2016 Disclaimer - Published by Trading Educators, Inc.
Chart Scan is a complimentary educational newsletter.
© by Trading Educators, Inc. Re-transmission or reproduction of any part of this material is strictly prohibited without prior written consent.

