Edition 652 - December 9, 2016

Finding your trading nitch in the market just got easier! Trading Educators offers several Trading Advisory Services. Select the service that fits your trading style or look into entering a different market.
 Trading on News Days - Ambush Day Trading the E-Mini S&P 500
by Master Trader Marco Mayer
Educator for Forex and Futures, Systematic Trader, and
Creator of Ambush Trading Method, Ambush Signals, and AlgoStrats.com
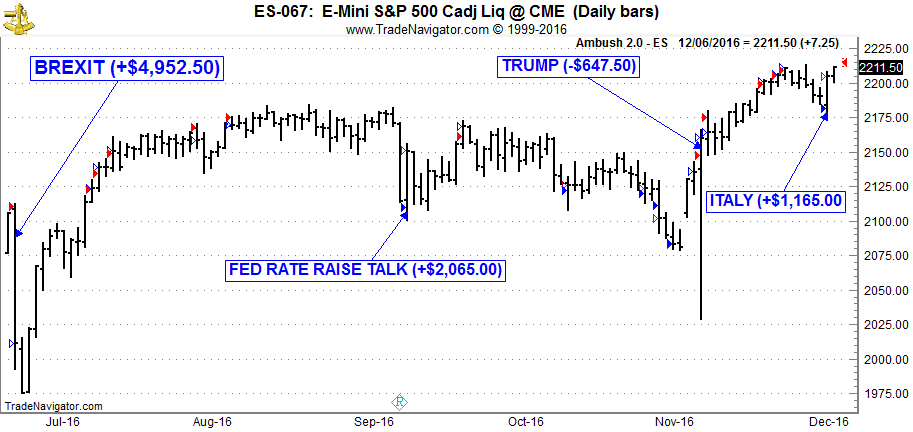
This year we’ve had a couple of events that were likely to have a strong impact on the markets:
- BREXIT Decision in June
- FED Rate Raise Comments in September
- US Elections in November
- Italy Referendum in December
All of them happened over a weekend so the question many traders have been asking themselves was whether to trade on these days or not. Ambush traders have been no exception here so I got a lot of emails asking what to do.
My answer is always the same. It’s impossible to know what the actual news will be and how the markets will actually react.
What we do know though is that on such days it’s very likely that volatility will be much higher than on average. How that volatility will play out is impossible to know. In case of Ambush this means it’s much more likely on such days to either get stopped out with a big loss or to catch a really big winner. Because of that the question comes back to the trader: Take the risk or not? Another option is of course to trade less size on such days, knowing that volatility is likely to explode.
Now the good news is that on most of these events Ambush traders who have been ready to accept the risk made a killing day trading in the E-Mini S&P 500. The only even where Ambush lost was on the Trump event where the stop loss avoided bigger losses and made most of it back already on the next day.

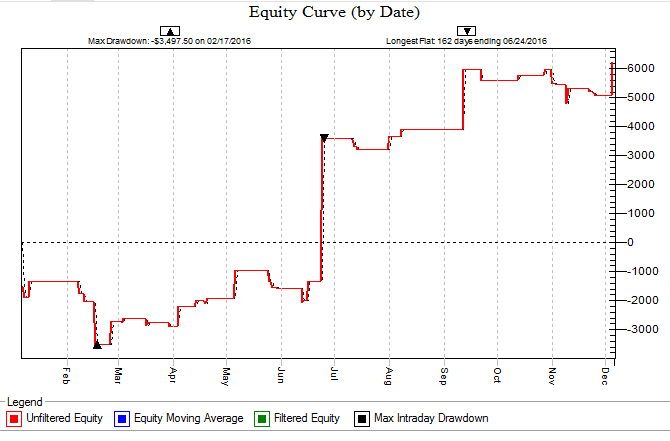
Overall Ambush had a great year in the E-Mini S&P 500 and thanks to the Italy-Trade the equity is now at new all time highs, here’s this years equity curve showing all E-Mini S&P 500 Day Trades, trading one contract including $10 per round-turn for commissions:

The average trade has been about $145 (including $10 commissions round-turn), which is amazing considering that Ambush is a Day Trading method, meaning you never keep positions over night!
Now if you want to become an Ambush Trader too, there’s different ways to do so. You can either buy the Ambush eBook and learn all about how the method works and set everything up yourself.
Or you join Ambush Signals and simply get access to the daily Ambush Signals for all of the supported Futures markets. This way you can just follow Ambush without having to go through the hassle of setting up charts, indicators and taking care of getting the right data and so on.
© by Marco Mayer. Re-transmission or reproduction of any part of this material is strictly prohibited without the prior written consent of Trading Educators, Inc.

The Law of Charts with Commentary
by Master Trader Joe Ross
Author, Trader, Trading Mentor, and Founder of Trading Educators, Inc.
Ledges
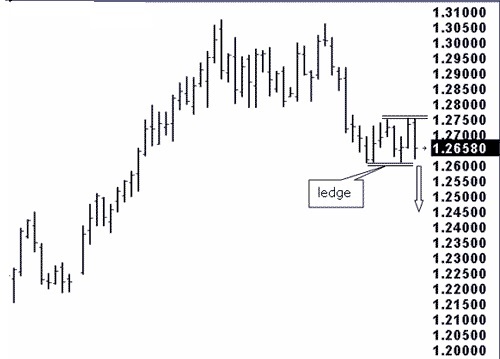
On the chart below we see that prices have formed an 8-bar ledge.
The Law of Charts states that a ledge begins with the profit taking that occurs during or at the end of a trend or swing. All ledges begin with Ross hooks. However, due to indecision, a sense of fair value, or confusion as to which way prices will go, the normal progression of the swing or trend does not continue.
The Law of Charts states that the percentage in favor for a successful trade is to take a breakout from a ledge in the direction of the former swing or trend. The arrow indicates that the best chance for success would be a breakout to the down side.

© by Joe Ross. Re-transmission or reproduction of any part of this material is strictly prohibited without the prior written consent of Trading Educators, Inc.
Trading Article - Looking at how the money supply affects trading in the markets.
by Master Trader Joe Ross
Author, Trader, Trading Mentor, and Founder of Trading Educators, Inc.
There are two important components of federal market activity which affect long- term economic activity and stock and commodity values; these are interest rates and money supply. A contracting money supply was one of the factors that caused the Great Depression of the 1930's.
In the early 1980's most traders focused almost totally on the money supply figures, which would cause cash bonds and T-Bill rates to react violently as soon as the M-1 and M-2 figures were released every Friday afternoon. The Fed Funds Rate and Discount Rate are the most important rates, and three consecutive increases or decreases establish a trend. When money supply decreases and interest rates increase, they tend to suppress economic growth.
The Fed also buys and sells government securities, through special authorized dealers, to affect the overall money supply.
Inflation becomes a problem when the CRB spot index and CRB raw industrial commodities begin to increase sharply. Stock traders will decrease holdings in interest rate sensitive stocks, like utilities, and buy cyclical stocks in the Dow Industrials, like Alcoa, or steel stocks. Expect higher interest rates to follow inflation. When interest rates move higher, T-Bonds, all T-Notes, T-Bills, and Eurodollars can be expected to feel downward pressure.
Usually, but not always, rising interest rates help the dollar as long as interest rates in the U.S. are relatively higher than those in other nations. By relatively, I mean that the differential between U.S. interest rates vs. those of competing nations is somewhat out of line to the up side.
© by Joe Ross. Re-transmission or reproduction of any part of this material is strictly prohibited without the prior written consent of Trading Educators, Inc.

Blog Post - Simplicity of Trading
by Professional Trader Andy Jordan
Educator for Spreads, Options, Swing/Day Trading, and
Editor of Traders Notebook Complete and Traders Notebook Outrights
Keeping things simple can benefit you and your bottom line in the long run. Read more.
© by Andy Jordan. Re-transmission or reproduction of any part of this material is strictly prohibited without the prior written consent of Trading Educators, Inc.
Check out our Blog!
To view previous published Chart Scan newsletters, please log in or click on "Join Us,"
shown above, to subscribe to our free "Members Only" section.
A WEALTH OF INFORMATION & EDUCATION:
Joe Ross-Trading Educators' popular free Chart Scan Newsletter has been published since 2004.
Note: Unless otherwise noted, all charts used in Chart Scan commentary were created
by using Genesis Financial Technologies' Trade Navigator (with permission).
Legal Notice and Copyright 2016 Disclaimer - Published by Trading Educators, Inc.
Chart Scan is a complimentary educational newsletter.
© by Trading Educators, Inc. Re-transmission or reproduction of any part of this material is strictly prohibited without prior written consent.


