
Edition 656 - January 6, 2017

“We all get the exact same 365 days. The only difference is what we do with them.” – Hillary DePiano
Start your year off right with a free EBook "A Trader's Musings: A compliation Of Observations, Thoughts and Lessons From Over 50 Years of Trading" by Joe Ross. It's available at Amazon for free from January 6th through January 8th. Click here to get your copy. If you don't have a Kindle, you can download a free app.

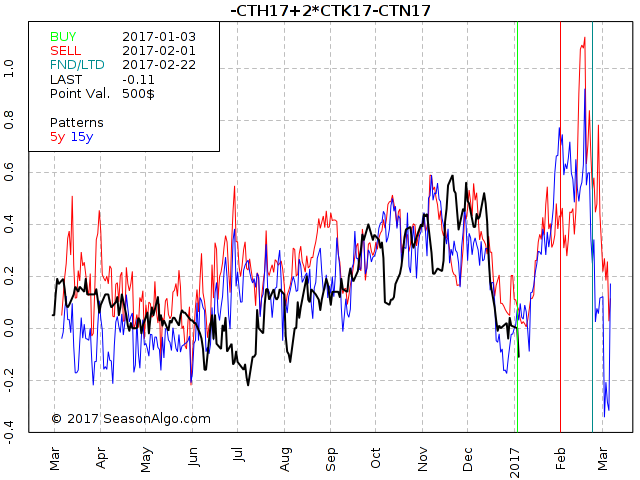
Trading Idea - Cotton Butterfly -CTH17+2CTK7-CTN17
by Professional Trader Andy Jordan
Educator for Spreads, Options, Swing/Day Trading, and
Editor of Traders Notebook Complete and Traders Notebook Outrights
While outright futures in the so called “Softs” are usually difficult to trade, I like to trade spreads because they usually behave less “crazy”. Today I want to look into a Cotton Butterfly shown on the seasonal chart below. At the first look the spread looks kind of wild but at a closer look you might notice only the big moves, like the down move from November into January really matter in terms of US$. All the rest is just noise. The spread is also following its seasonal patter nicely and the seasonal up-move right in front of us looks promising.
If you want to know how we trade this spread in Traders Notebook, please follow the link below. There is a special deal available for the ones new to our Newsletter.
Yes, show me how you do it, click here!
© by Andy Jordan. Re-transmission or reproduction of any part of this material is strictly prohibited without the prior written consent of Trading Educators, Inc.
 Trading Article -Why You Can Still Lose Money Winning 99% of Your Trades
by Master Trader Marco Mayer
Educator for Forex and Futures, Systematic Trader, and
Creator of Ambush Trading Method, Ambush Signals, and AlgoStrats.com
I’m sure you’ve all seen advertisements of trading systems that have 95% winning trades. And traders tend to get all excited when they see a high win rate. But while having a high win rate is nice, it can also be a very misleading performance metric.
The winning rate tells you how much percent of the trades in a backtest (or real past trades) have been winning trades. So if you have 100 trades in total, and 75 of those trades closed with a profit, you have a winning rate of 75%. Now the first thing to notice here is how those winning trades are defined. Are breakeven-trades included? What about commissions? If you have 100% winning trades in the E-Mini Dow Future and each of those trades was closed at 1 tick profit ($5) and you pay $7.50 per round turn, you actually lost money even if you hit your profit target 100% of the time.
Which leads us to the next fact. And that is that without knowing how much money was made on the winning trades vs. the losing trades, the winning rate is completely useless. Here’s an extreme example. Let’s say you have 90 out of 100 winning trades, a winning rate of 90%. Sounds great right? But what if on average you had an average profit of $100 per winning trade ($100 x 90 = $9000) but an average loss of 1000$ per losing trade ($1000 x 10 = $10000)? Right you have lost $1000 even with a winning rate of 90%. Of course this also works the other way around, if you only have 10% winners, but those are 10 times the size of your 90% losing trades, you’ll come out ahead!
Here things get interesting from a psychological point of view. Most traders are not ready to trade a strategy that only wins just 10 out of 100 times. Even if it’s numbers look amazing in the long run and it’s a really good system. Most traders simply can’t deal with this as it’s going to have long flat periods and you can easily have 10 and often 20 or more small losing trades in a row.
On the other side usually the drawdowns will be much steeper trading a system with a high win rate. When it finally hits those big losing trades, months of profits can be destroyed within a single day.
So to sum this up, the winning % is a key number to watch out for but it’s far less important than most traders think and without additional information completely useless. So you shouldn’t get all excited if you see a very high winning rate right away.
All of the 99% winning trade systems that try to capture a few pips on each trade I’ve seen in the past have blown up sooner or later. And any such systems that will come up in the future will end up in the same way. It’s always a ticking time bomb and the longer it’s been running and making money - the higher the odds are it will implode soon.
Happy Trading!
Marco
© by Marco Mayer. Re-transmission or reproduction of any part of this material is strictly prohibited without the prior written consent of Trading Educators, Inc.

The Law of Charts with Commentary
by Master Trader Joe Ross
Author, Trader, Trading Mentor, and Founder of Trading Educators, Inc.
Time Independent Charts
There is something I want to point out about trading methods. Very often you have to be discretionary when trading them. For example, we discovered that with one of the methods we used to use, 100% of the time the method made 2 1/2 - 3 points per contract very soon after entry. To use the method you had to do as we suggested and take something out of the trade as soon as you could. That meant trading at least 2 contracts—one for a short-term objective and the other to stay with the trade as long as possible.
Every method comes with a stated objective; however, discretion dictated that it was advisable to take some profit out of the trade as soon as it was possible to see at least 100 (it was up to the trader as to the amount). That way a trader was being paid to trade.
We told method users to not let greed overcome them by trying to get the stated objective every time.
During the time the method was working I took a trade in corn. The trade lost if I would have stayed in until I was stopped out. But there was ample opportunity to have taken something out of the trade. Discretion is what makes a method different from a mechanical trading system. When you know that a high percentage of the time you can make 125-150 dollars from the circumstances that created the trade entry, then isn't it wise to ensure that you are paid to trade? Take some profit and move your stop to breakeven. If you are stopped out, you will still be profitable or have mitigated any loss.
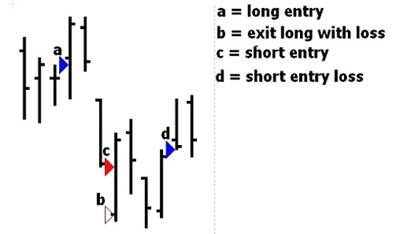
The long entry (a) was at 260 dollars. Prices moved as high as 263.50 dollars, i.e. 3.5 points = 175 dollars /contract before being stopped out at breakeven the same day. If I stayed in, this amount of profit or slightly less was available on 2 consecutive trading days.
The short entry (c) was at 252.50 dollars. Prices moved as low as 248.50 dollars after entry that same day; 4 points = 200 dollars before being stopped out the following day on a gap open at 250.50 dollars. The net gain available was 2 points = 100 dollars. If I stayed in, there was still another opportunity to have come out of the trade with a nice profit. The following day prices gapped down and 4 1/2 points = 225 dollars were available. Taking something there and moving my stop to breakeven would have avoided suffering a loss on the trade.
© by Joe Ross. Re-transmission or reproduction of any part of this material is strictly prohibited without the prior written consent of Trading Educators, Inc.
Trading Article - Chess and Trading. What do you think?
by Master Trader Joe Ross
Author, Trader, Trading Mentor, and Founder of Trading Educators, Inc.
Although I haven't the faintest idea of how to play chess, it certainly seems like a great idea. I imagine you can improve stock and futures trading by learning how to play chess. It might also help to develop an interest in physics. Every trader should learn to develop his problem-solving and pattern recognition abilities. I’ve been told that nothing does this better than learning how to play chess. Some of the first computer algorithms were designed to play chess. Just as chess taught the computer how to think, it seems likely chess can teach traders how to think more logically and effectively. Chess is something that might be taught in the first grade through high school in all schools to help children develop problem-solving abilities, and to create self-confidence and self-reliance. Chess, when taught to under-privileged children, was responsible for the greatest overall grade improvement for all students on all levels. Of course no one knows for sure what the social impact of such a plan might be. What about the kid who really has trouble seeing ahead; kids who have dyslexia like me? Pattern recognition is the key to understanding bar chart structure. Variations of similar patterns are constantly occurring in the markets. Prices move either up or down 100% of the time. Truly, prices do not move sideways. Markets move sideways, not prices. If a price moves, it is either up or down. Sideways for the market indicates virtually all price movement within a certain range. A key to correct technical analysis is simplicity; breaking the market down to its basic price structures for comparisons of highs, lows, opens and closes within various time periods. Profitable trading can be derived from recognition of simple recurring price patterns based on the action, reaction, and interaction of market perception.
© by Joe Ross. Re-transmission or reproduction of any part of this material is strictly prohibited without the prior written consent of Trading Educators, Inc.
Receive daily trade recommendations - we do the research for you!
Instant Income Guaranteed
♦ SIGN UP TODAY! THIS IS WORTH THE INVESTMENT ♦
Check out our Blog!
To view previous published Chart Scan newsletters, please log in or click on "Join Us,"
shown above, to subscribe to our free "Members Only" section.
A WEALTH OF INFORMATION & EDUCATION:
Joe Ross-Trading Educators' popular free Chart Scan Newsletter has been published since 2004.
Note: Unless otherwise noted, all charts used in Chart Scan commentary were created
by using Genesis Financial Technologies' Trade Navigator (with permission).
Legal Notice and Copyright 2017 Disclaimer - Published by Trading Educators, Inc.
Chart Scan is a complimentary educational newsletter.
© by Trading Educators, Inc. Re-transmission or reproduction of any part of this material is strictly prohibited without prior written consent.

