
Edition 657 - January 13, 2017


 Ambush Trading Method - Performance Update
by Master Trader Marco Mayer
Educator for Forex and Futures, Systematic Trader, and
Creator of Ambush Trading Method, Ambush Signals, and AlgoStrats.com
As we’re heading into 2017, I thought it was a good time to reflect on the trading performance of Ambush in 2016.
To do so, let’s look at the performance of the Ambush All Stars Small Portfolio consisting of:
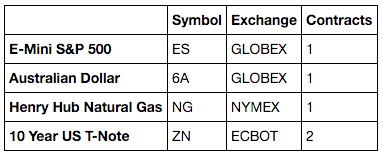
The following Performance Report includes trading costs of $5 commissions round turn and 1/2-tick slippage per market order. We’re assuming to get 1-tick slippage on 50% of all executed stop-market or market orders, and of course, no slippage on limit-orders.
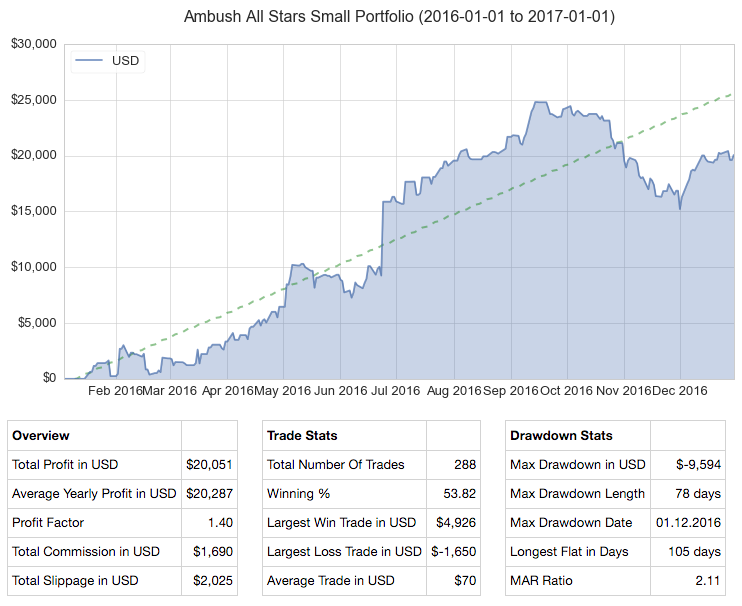
Now, there’s not much to say about that performance report. 2016 has simply been an exceptional year for Ambush traders and all performance metrics look just as a trader would wish for. Out of 12 months there have been only 2 losing months (October/November). The resulting drawdown of these two happening in a row wasn’t very nice, but compared to the overall profits of the year, it was still very moderate. This gives us a MAR Ratio of over 2 which is still excellent.
You can learn more about Ambush and Ambush Signals on the Ambush Signals Website.
Watch my short presentation to find out more about Ambush Signals.
Join Marco Mayer - Ambush Signals!
© by Marco Mayer. Re-transmission or reproduction of any part of this material is strictly prohibited without the prior written consent of Trading Educators, Inc.

Trading Article - Do Something Else!
by Professional Trader Andy Jordan
Educator for Spreads, Options, Swing/Day Trading, and
Editor of Traders Notebook Complete and Traders Notebook Outrights
You need to find other things to do while padding the time waiting for better trades. Try to study the markets or different ways of trading, or simply do something completely different like going to the beach. It is critical that you learn to enjoy yourself in ways other than being in a trade.
The fact is, if you are trading in a professional way, you are out of the market much of time. So you need to think of ways to fill this time. Trading is not a full-time job where a person works 8 hours a day. Also, trading doesn't get better by trading more. The opposite is often the case.
When you are not satisfied with your trading, try to reduce the number of trades instead of putting on more trades. This might help to move your trading to a higher level and you might get better results.
© by Andy Jordan. Re-transmission or reproduction of any part of this material is strictly prohibited without the prior written consent of Trading Educators, Inc.

The Law of Charts with Commentary
by Master Trader Joe Ross
Author, Trader, Trading Mentor, and Founder of Trading Educators, Inc.
Spreads
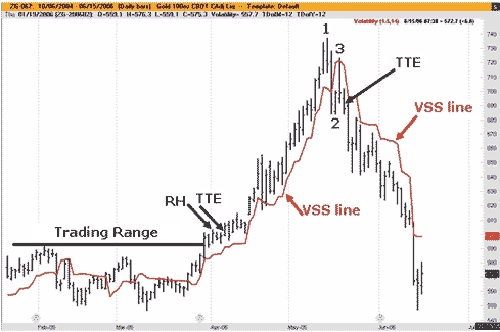
The years go by quickly. Seems like yesterday that I presented a webinar for the CBOT, in which I showed how to stay in a trend using the Volatility Stop Study (VSS).
The market I used was CBOT gold. Since that time, gold has dramatically changed, but what I want to show hasn’t changed at all.
One person wrote to me doubting that I could have used the VSS to get into the gold uptrend until it was too late. That was not at all true. I submit that it is quite possible to have used VSS in conjunction with The Law of Charts to get into and out of the gold trend, but also to have used VSS along with The Law of Charts to get into and remain with the gold downtrend.
Furthermore, there was no need to change the VSS parameters in order to make use of a combination of The Law of Charts, the Traders Trick Entry (TTE), and the VSS. The long entry into the uptrend could have been made in several places. For example, the breakout from the trading range could have been set lower. There was a Ross hook (first failure to move higher after a breakout from consolidation) lower than the Ross hook that gave the TTE shown for long entry. The chart below tells the whole story.
© by Joe Ross. Re-transmission or reproduction of any part of this material is strictly prohibited without the prior written consent of Trading Educators, Inc.
Trading Article - Support and Resistance
by Master Trader Joe Ross
Author, Trader, Trading Mentor, and Founder of Trading Educators, Inc.
I received a couple of emails asking whether or not I believe in support and resistance. In fact, one subscriber said if I didn't believe in support and resistance, then I couldn't possibly believe in trend! Why? Because in all cases the situation ends.
Here's what I believe: The trend is your friend until the end. The swing is the thing until it goes "ding."
What is support and what is resistance? Are those not simply convenient terms to describe an area of fair value? Prices bounce off of those areas of so-called support and they bounce off of areas of so-called resistance. Why? Because temporarily no one is willing to sell for less than "support" and no one is willing to pay more than "resistance." "Support" and "resistance" are equally as mythological as "trend." Why do I say that?
Every market is in a trading range between the highest price it ever achieved (resistance) and the lowest price it ever reached (support). So what is all that stuff in-between? Can we call the junk in between "support" and "resistance?" What are trends and swings? Are they not simply connectors connecting the temporary areas of fair value? So-called support areas fail to support, are broken, and are connected to a lower fair value area by a swing or trend. So-called resistance areas fail to resist, are broken, and are connected to a higher fair value area by a swing or trend.
Trend lines and swing lines are also broken, and lead to areas of fair value, where prices chop sideways for awhile. So, what's the bottom line of all this clap-trap about support, resistance, swings, and trends?
As far as I'm concerned, the only thing that counts is whether or not you have found a way to make money from any of this. If you are able to make money when prices bounce off of so-called support and resistance, then congratulations, you have probably made it as a trader. If you have found a way to make money from trends or swings, or have found a way to make money from broken trend or swing lines, then you deserve praise and are well on your way, or have already succeeded as a trader. The rest is just a mincing of words — semantics. Support, resistance, trend, swing — all are nothing more than ways to identify what prices appear to be doing. Any one of them can see the beginning of the end with the next price bar. If you tell me prices are at support, I will probably know what you mean. That is all the word "support" is good for! If you tell me prices are at "resistance," I will probably know what you mean. The same thing is true for the words "trend" and "swing" — I will probably know what you mean. We will have found a common way to communicate to one another as to the condition and location of prices.
Do I believe in support, resistance, trends, and swings? The answer is no! I do not believe in any of it. What I do believe, most of the time, are the numbers on the statement of my trading account. If they are getting bigger, then I am winning.
© by Joe Ross. Re-transmission or reproduction of any part of this material is strictly prohibited without the prior written consent of Trading Educators, Inc.
Instant Income Guaranteed - VLO Trade
Developer: Joe Ross
Administration and New Developments: Philippe Gautier
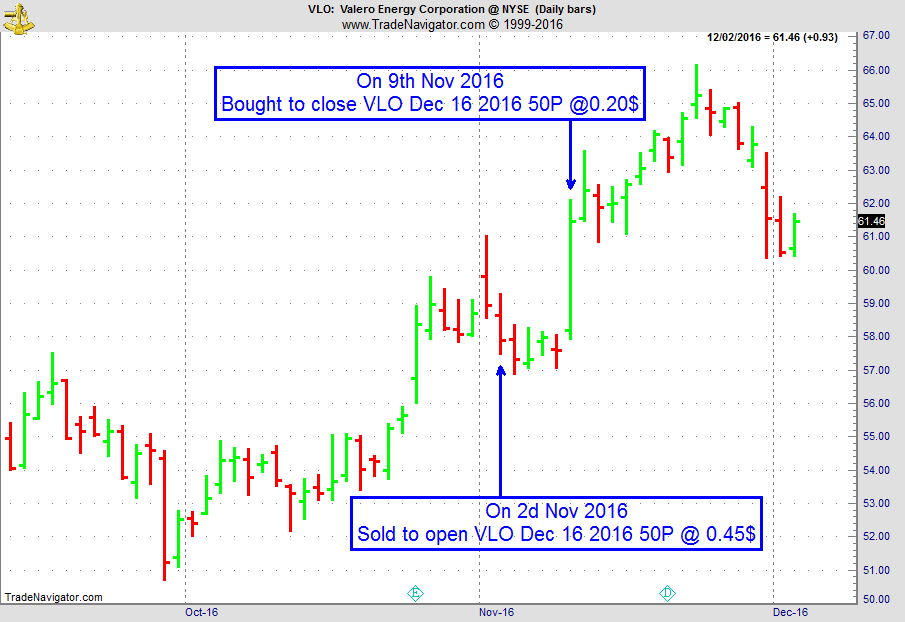
On 25th Oct 2016, we gave our IIG subscribers the following trade on VLO, for which we expected a retracement. We decided to sell price insurance as follows (we were filled on a GTC order on 2nd Nov 2016 at our minimum price):
We entered a "complex position" for a net credit (still working with OPM, i.e. other people's money, as usual), but with unlimited upside potential.
- On 2nd November 2016, we sold to open VLO Dec 16, 2016 50P @ $0.45, i.e. $45 per option sold, with 44 days to expiration, and our short strike below a major support zone, about 13% below price action.
- On 9th November 2016, we bought to close VLO Dec 16, 2016 50P @ $0.20, after 7 days in the trade, for quick premium compounding
Profit: $25
Margin: $1,000
Return on Margin annualized: 130.36%
We have also added new types of trades for our IIG daily guidance, "no loss" propositions with unlimited upside potential, still using other people's money to trade (see recent EWZ example in Newsletter Edition 649, log in to our members only area).
Philippe
Receive daily trade recommendations - we do the research for you!
Instant Income Guaranteed
♦ SIGN UP TODAY! THIS IS WORTH THE INVESTMENT ♦
Check out our Blog!
To view previous published Chart Scan newsletters, please log in or click on "Join Us,"
shown above, to subscribe to our free "Members Only" section.
A WEALTH OF INFORMATION & EDUCATION:
Joe Ross-Trading Educators' popular free Chart Scan Newsletter has been published since 2004.
Note: Unless otherwise noted, all charts used in Chart Scan commentary were created
by using Genesis Financial Technologies' Trade Navigator (with permission).
Legal Notice and Copyright 2017 Disclaimer - Published by Trading Educators, Inc.
Chart Scan is a complimentary educational newsletter.
© by Trading Educators, Inc. Re-transmission or reproduction of any part of this material is strictly prohibited without prior written consent.

