
Edition 658 - January 20, 2017


The Law of Charts with Commentary
by Master Trader Joe Ross
Author, Trader, Trading Mentor, and Founder of Trading Educators, Inc.
WHAT SHOULD YOU TRADE?
During my private tutoring and recorded webinar, I prove to my students that what I teach can be used in any market and in any time frame.
People write to me to tell me, "All I want to trade is a 5-minute E-mini S&P 500 chart."
But why? Why would anyone want to restrict himself to one market and one time frame? There is no market in the world that is always good for trading in a single time frame. You need to look around to see exactly which markets and time frames are best suited to your personality, comfort level, account size, and current market conditions.
In fact, at Trading Educators, we are likely to trade a different market every day, and if it is the same market, we don't necessarily trade it in the same time frame as we did the previous day. The reason for that is that we want the best possible setups for the way we like to trade.
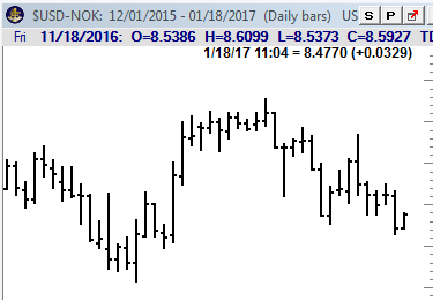
There are times when you can do just as well in the Russell 2000 ETF as you can do trading the E-mini Russell 2000 futures. Have you ever tried to trade the Norwegian Krone in the futures market? There's practically no liquidity. But you can trade it as USDNOK in the forex market as seen on the chart below. If you wanted to be short the krone, you can go long USDNOK.
Too many traders have tunnel vision. All they can see is one market and one single time frame. Trading that way is a great way to get killed. But if you truly learn how to trade; if you truly understand The Law of Charts; if you really understand market dynamics, and the correct approach to the markets, you can trade wherever and whenever the trading is best.
© by Joe Ross. Re-transmission or reproduction of any part of this material is strictly prohibited without the prior written consent of Trading Educators, Inc.
Trading Article - Conquering Passivity
by Master Trader Joe Ross
Author, Trader, Trading Mentor, and Founder of Trading Educators, Inc.
Winning traders take decisive action. The decisions you have to make to put on winning trades are crucial to success. Where do you enter? When do you exit? How much risk will you take? Each of these questions must be addressed quickly and with strong resolution. But not all traders can make the right decision at critical moments of investing. Passivity often sets in. It can take on many forms from failing to pull the trigger to holding onto a losing trade. Sometimes, actually taking action is a form of passivity. For instance, rather than actively letting a winning trade fully come to fruition, a passive trader may close out a position early to lock in profits and avoid the unpleasant feeling of embracing and accepting uncertainty. There may be three types of passive traders: Cautious, fearful, and insecure. If one of these types is descriptive of you, consider learning how to conquer passivity by gaining awareness of the psychological mechanisms that lie beneath it.
Cautious traders are passive in an attempt to avoid risk. They obsess over any possible flaw in their trading plan. They try to seek out perfect trading information in a fruitless attempt to control the inherent uncertainty of the markets. Many times, their thorough search for all pertinent sources of information is merely an excuse for not taking on risk. But information is never fully complete. When you are trading, you are taking a risk, and you must accept the fact that no amount of perfectionism or caution will guarantee success. All that cautious traders end up doing is failing to take action.
A second type of passive trader is the fearful trader. Fearful traders don't trade to win. They constantly try to avoid losing. It's not a very satisfying way to trade. You might say, their need to avoid loss "leads to a sense of quiet desperation." Rather than enthusiastically trading the markets, and expecting success, they passively wait for their doom, which they think is inevitable. Your destiny is never set, however. By taking an active approach to trading, you'll increase the odds of realizing huge payoffs.
Insecure traders are passive because they continually seek approval. Insecure traders seek out acceptance and reassurance. They can't make a decision independently and spend hours gathering the opinions of others, and hope that other people can make key decisions for them. Their primary intention is to avoid responsibility. If someone else were the impetus for their decision, then it's never their fault when the trade goes sour. It's always someone else's fault. By putting the blame on others, the insecure trader is able to avoid facing his or her limitations. A grandiose self-view can be maintained. But looking toward others and avoiding an honest look at your abilities will lead to stagnation. Trading requires action, and fully engaging in trading activities requires a full awareness of what you're doing. You must actively look inward to your own intuitive sense of the market action and trust what your instinct tells you. Only when you are fully committed to looking at the market through your senses, and fully accepting your experience on its own terms can you trade freely, creatively and profitably.
In the end, there are no guarantees. You must take risks. The key is to find the proper balance. Risks can motivate you, but they can also overwhelm. By finding a level of risk that motivates you, but does not overwhelm you, you will stay energized and be ready to actively trade the markets rather than allow profits to pass by.
© by Joe Ross. Re-transmission or reproduction of any part of this material is strictly prohibited without the prior written consent of Trading Educators, Inc.
Instant Income Guaranteed - X Trade
Developer: Joe Ross
Administration and New Developments: Philippe Gautier
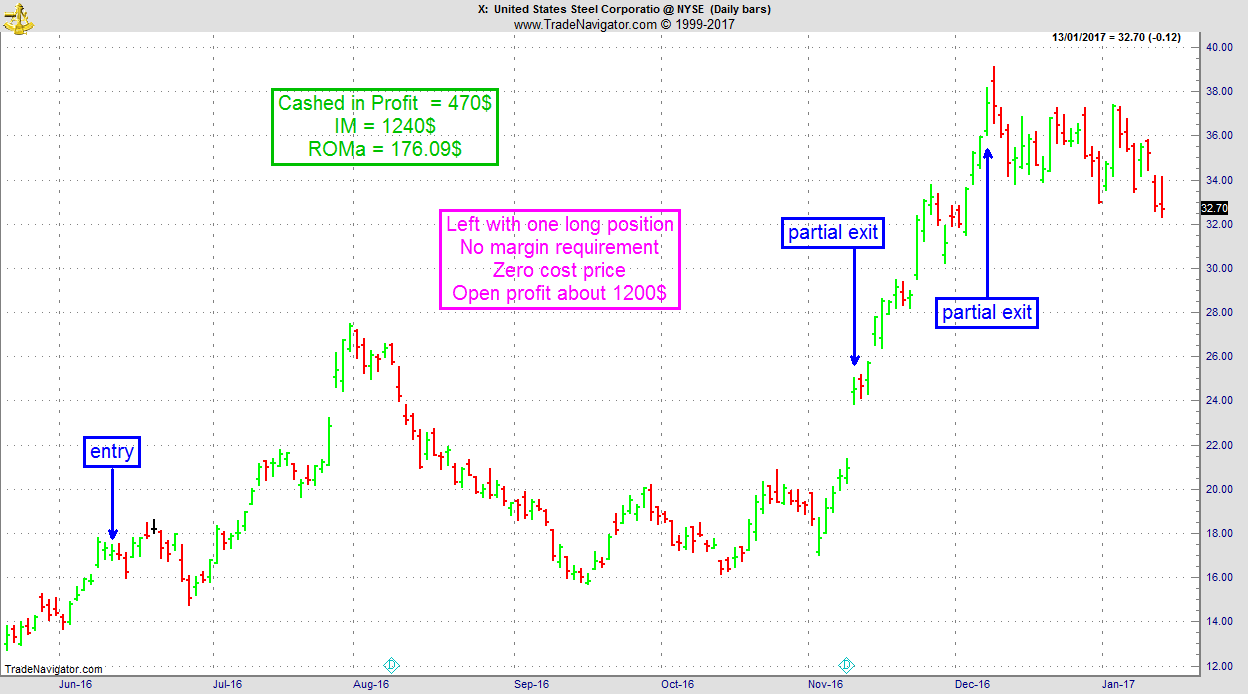
On 9th June 2016, we gave our subscribers a new type of trade on US Steel (X), which was showing accumulation on a pullback on the weekly chart.
We entered a "complex position", entered for a net credit (still working with OPM, i.e. other people's money, as usual), but with unlimited upside potential.
- On 10th June 2016, we entered the trade for a credit of $1.70 (or $170 per position).
- On 9th November 2016, we took partial profits on our long position.
- On 7th December 2016, we took new partial profits on our long position and closed our short position.
Profit: $470
Margin: $1,240
Return on Margin annualized: 176.09%
But this is only part of the story. As part of our profit maximizing strategy on these long term trades, we still have one long call position left, with a zero cost price, an extra open profit of around $1,200, and about one year left to play out.
These are low maintenance, low stress trades with lots of upside potential.
We presently have 19 of these trades opened.
Philippe
Receive daily trade recommendations - we do the research for you!
Instant Income Guaranteed
♦ SIGN UP TODAY! THIS IS WORTH THE INVESTMENT ♦

Trading Idea - GFJ17+ZCK17-2xLEQ17
by Professional Trader Andy Jordan
Educator for Spreads, Options, Swing/Day Trading, and
Editor of Traders Notebook Complete and Traders Notebook Outrights
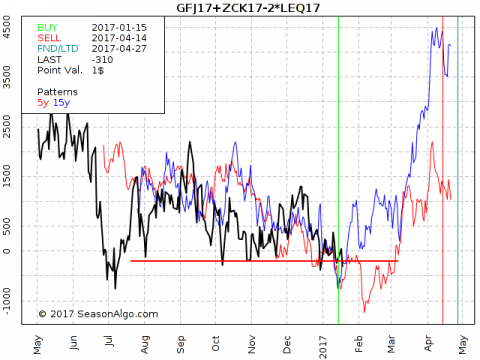
Today I am looking at a very “strange” butterfly spread: Long 1 April Feeder Cattle and one May Corn and short 2 Live Cattle August.
I have to admit that it is difficult to find an entry into this trade by looking for chart patterns, but it is easy to see the possible support around the current level. Okay, the spread moved a bit lower in July last year but this happened when there was not enough volume in all 3 legs of the spread. Since then, the spread stayed above -$500 on a close basis. Unfortunately, there is no way to trade this spread as a single contract and we need to “leg in” into each leg separately. I would also give this spread enough room to develop and therefore a risk of about $1,000 - $1,500 per butterfly seems to be necessary.
© by Andy Jordan. Re-transmission or reproduction of any part of this material is strictly prohibited without the prior written consent of Trading Educators, Inc.
 Trading Article - Indicators: Good or Bad?
by Master Trader Marco Mayer
Educator for Forex and Futures, Systematic Trader, and
Creator of Ambush Trading Method, Ambush Signals, and AlgoStrats.com
One of the most commonly discussed trading topics is whether indicators are good or bad. Should a trader use them or is it just a distraction that doesn’t add anything to the "pure" price-action you can see on a simple price chart?
The answer is that making a war of opinions out of anything related to trading and thinking in terms of "good" or "bad" is kind of silly. Remember, we’re talking about trading here, not about where you can get the best Burgers, which is the best soccer team or some other question of preferences. Trading is about making money, so it’s important to ask the right objective questions and for these, there usually are objective answers.
Does the indicator you’re looking at give you an edge in the markets or not? Or if it’s an indicator supposed to provide you a specific information in an easier way, does it do its job and make your life as a trader easier?
If it does it would be crazy to not use it. An indicator is nothing else than some kind of transformation/representation of whatever data you put in there and how you’d like to see it. The same can be said about OHLC charts. If you want it really pure then you should look only at tick data as an OHLC price bar is just a summary of that.
So don’t get fooled by the "Price Action is the only way!" crowd. Of their patterns, you can ask the very same question: "Does the shown price pattern provide an edge, yes or no? If the answer is no, and that is, unfortunately, the truth for most price patterns and indicators out there, then just forget about it and move on. Again this isn’t about a question of what appeals to you or not. It’s about whether it makes you money or not.
The truth is that any indicator is only as useful as the trader’s knowledge about the indicator. Obviously just randomly adding a couple of indicators to a chart isn’t going to be helpful. You should understand pretty well what an indicator actually does, how it works and what that number it spits out tells you. Otherwise, it’s going to be very hard to know when and how to use it. Most indicators „work“ only under certain conditions. But the very same thing can be said about any price pattern out there. If you blindly trade it without having done any testing on whether it provides you can edge or not in the market/timeframe/conditions you want to trade it, you can as well use any arbitrary indicator out there!
As a systematic trader, I use a lot of indicators in one way or the other. Most of them are indicators I came up with on my own to make my life as a trader easier. Others tell me whether a certain price pattern is there or not. But I know exactly how each indicator works and what it’s actually useful for. Whether it’s indicating some OHLC based price pattern or providing some measurement of volatility that might not be that easy to recognize by just looking at a price chart.
Happy Trading!
Marco
© by Marco Mayer. Re-transmission or reproduction of any part of this material is strictly prohibited without the prior written consent of Trading Educators, Inc.
Check out our Blog!
To view previous published Chart Scan newsletters, please log in or click on "Join Us,"
shown above, to subscribe to our free "Members Only" section.
A WEALTH OF INFORMATION & EDUCATION:
Joe Ross-Trading Educators' popular free Chart Scan Newsletter has been published since 2004.
Note: Unless otherwise noted, all charts used in Chart Scan commentary were created
by using Genesis Financial Technologies' Trade Navigator (with permission).
Legal Notice and Copyright 2017 Disclaimer - Published by Trading Educators, Inc.
Chart Scan is a complimentary educational newsletter.
© by Trading Educators, Inc. Re-transmission or reproduction of any part of this material is strictly prohibited without prior written consent.

