
Edition 660 - February 3, 2017


Trading Idea - Short May 2017 Soybeans Puts
by Professional Trader Andy Jordan
Educator for Spreads, Options, Swing/Day Trading, and
Editor of Traders Notebook Complete and Traders Notebook Outrights
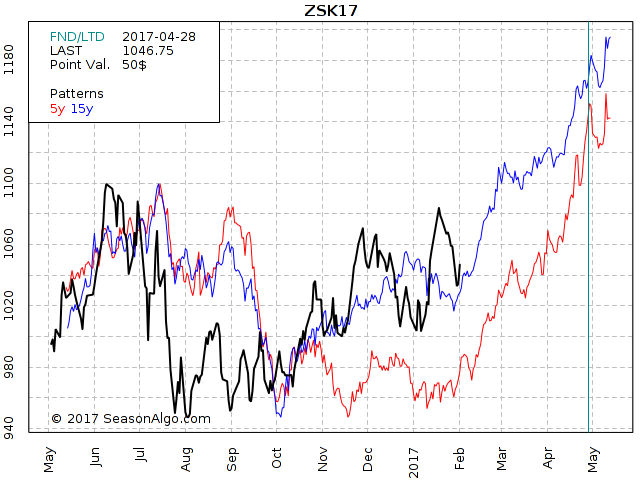
As you can see on the chart below the May 2017 Soybeans are in a long term up-trend since August/September 2016. Both seasonal charts (the blue 15 year and the red 5 year) a looking very strong for the next few months and this might help to drive Soybeans even higher. Therefore, selling May 2017 puts seems to be a good strategy for us as long as the May Soybeans are not dropping below the 1000 level.
Traders Notebook Complete
Learn how to manage this trade by getting daily detailed trading instructions, click here!
Andy is offering a FREE 2 Week Trial - Sign up before February 11th
Yes, sign me up!
© by Andy Jordan. Re-transmission or reproduction of any part of this material is strictly prohibited without the prior written consent of Trading Educators, Inc.
 Trading Article: The Well-Chosen Example
by Professional Trader Marco Mayer
Educator for Forex and Futures, Systematic Trader, and
Creator of Ambush Trading Method, Ambush Signals, and AlgoStrats.com
A fallacy you should be vividly aware of in the trading world is the well-chosen example. This comes in all kinds of forms but the most popular one is to show a single trade or a couple of trades on a chart and point out some really nice winning trades.
Here's one I ran into a few days ago. This was sent out to promote a trading education service:
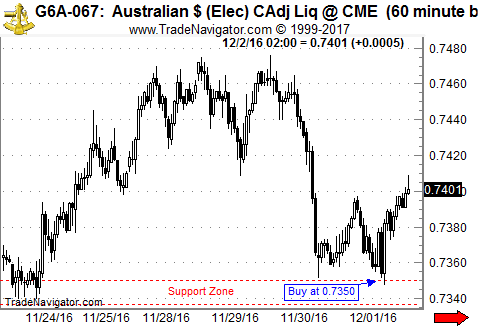
So yes that trade really worked out nicely huh? Bought down there right at the bottom, very tight stop and then got a quite nice rally out of it. Took profits of about two times the initial risk!
What they didn't show are the other 2 price levels they had suggested. In these cases, the Australian Dollar just traded through the levels:
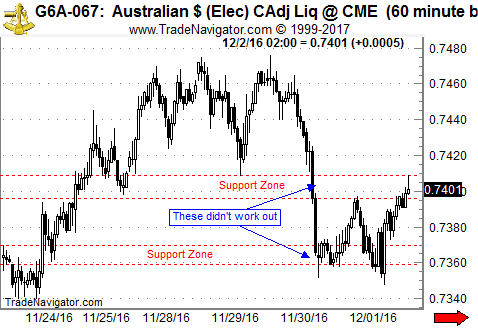
So actually there’ve been 3 trades on that day with a total result of barely breaking even.
And there’s no problem with this. Doesn’t mean that service or that their strategy is not good or at least somehow useful. What I want to point out here is simply this tendency in the trading industry to show the well-chosen examples. Obviously, that’s simply how marketing works, and there’s nothing wrong with that, just something to be aware of.
Once you’re aware of that you can start asking the right questions: "I’ve seen your sample trade in the Australian Dollar, nice one! Makes me really curious and I’d love to learn more about your performance. Can you send me a record of all the trades you did in this market using that strategy over the last 5 years? Or across all currency markets? If so, please let me know if it does include trading costs (commissions/slippage) and if it is based on real trades or just simulated results?"
If you hear back from them you can start to investigate and get a better idea of their potential edge in the markets. A single chart of an equity curve of 5 years of trading tells you much more than looking at 100 single trade sample charts. If you don’t hear back, you can save your time and move on.
Another popular "trick" of the same fallacy you should be aware of is whenever you see the result of a trading account. Especially if it’s on one of the popular social trading platforms. Might even be a small real money account. The trick goes like this: "Open up 10 accounts and put a couple of positions on one account, but do the opposite on the other one. Go crazy with your risk, doesn’t matter if you blow up an account. Repeat until out of the 10 accounts you’ll just by chance probably have at least one that survived and now looks really great. If not simply repeat starting with 10 new accounts." This works especially well for strategies that use very tight profit targets and no or very wide stops. As the odds of short-term profit are very high here anyway, doing this on multiple accounts you’ll surely have one that shows a very nice equity curve.
What you’ll see on their website is the result of that one account that did really well during the last few months. But you won’t learn about or about what happened to the other 9 accounts.
Happy Trading!
Marco
© by Marco Mayer. Re-transmission or reproduction of any part of this material is strictly prohibited without the prior written consent of Trading Educators, Inc.
DON'T FORGET TO VOTE!
Marco Mayer has been nominated for the "Forex Best Awards 2017" over at FxStreet.com for his educational Forex content. We are pleased and honored to have him as a part of our trading team and feel he deserves such an Award. This is your chance to show your support for Marco and all the free articles, blog posts and videos he provides on a regular basis. It'll only take a minute, no email or registration required. Go to the following link, https://www.surveymonkey.com/r/forexbestawards2017-Nominees, and if you don't know any of the other guys, just click through using "don't know" until page 4 of the survey. On page 4, select Marco Mayer's article (third on the list) and proceed to page 7 to vote for Marco again, and finish the survey.
Thank you!


Chart Scan - Exiting a Trade
by Master Trader Joe Ross
Author, Trader, Trading Mentor, and Founder of Trading Educators, Inc.
One of the requests made from a Chart Scan subscriber was about exiting from the market. In general, any signal that would cause you to enter a market in one direction should signal you to exit a market if you have entered it from the opposite direction. However, there is often more to it than that.
Let’s say you have held a long position, and you are wondering when or if you should exit. Let’s also say that one of your entry signals is a breakout of support. In other words, had you not been long, and were perhaps waiting for prices to drop, you would sell short if the support line was violated.
There are then things you can do:
You can exit on a Close below support, or, since a violation of support is an entry signal for you, you could reverse your long position and sell short.
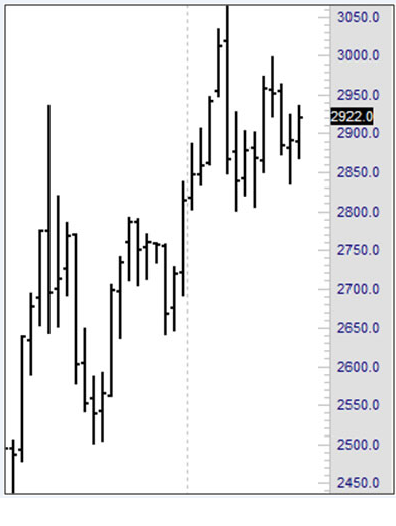
There is still another idea to be considered, and that is how long do you want to stay in a trade that is going nowhere? As we look at the chart we see that prices are definitely in a consolidation, which at TE we call congestion (11-20 bars with no real trend). In fact, the last 8 bars have all either opened, closed, or both inside the range of a measuring bar—that large bar that made the high of the recent move.
Might it not be better to take your money out now and wait for further developments? The margin you have tied up in the silver trade could be making you money in a market that is trending. It is a rare occasion that you end up getting every cent of an uptrend from bottom to top.
There is still another consideration which derives from the fundamentals for any market. You have to weigh the costs of getting out now against the costs of not staying in, if you believe that prices will go much higher.
The job of a trader is to make these kinds of decisions. There is still one more thing to consider: how does the trade “feel” to you? Are you comfortable staying in? Or would you be much more comfortable getting out, counting your money, and planning to get back into the market in whichever direction prices actually move.
© by Joe Ross. Re-transmission or reproduction of any part of this material is strictly prohibited without the prior written consent of Trading Educators, Inc.
Trading Article - Searching for a Winning Strategy
by Master Trader Joe Ross
Author, Trader, Trading Mentor, and Founder of Trading Educators, Inc.
Winning traders must identify profitable trading strategies. It's a creative process. Much like scientists find evidence to support a theory, traders must formulate hypotheses and determine whether their proposed strategy can produce a profit. You must sift through a wealth of information, mentally testing and retesting your hypothesis and trying to decide if it will work when the ideal market conditions are present.
In searching for a winning strategy, there comes a point when you start to believe that you're right. At some point, you must stop deliberating whether or not to go with a particular strategy, and make a final decision. But you don't want to jump in too early. On the other hand, you don't want to consider and reconsider your strategy so long that you miss a market move. The key is discerning when to stop deliberating and when to take action.
If you're like many traders, however, you've made your share of bad decisions. Psychologists have studied the thought processes that go into making decisions, such as determining whether a trading strategy will work or fail. It's a two-stage process, according. When evaluating a strategy, there's a point where you start to believe that it is true; in other words, you believe that your view of the markets is accurate and you'll make a profit if you use the strategy. That is the first stage of the decision making process, believing that you are right. The second stage consists of determining whether or not you are actually right. The human mind seems to work in a peculiar way. In order to fully understand and mull over a hypothesis, we must first believe it is true, even if it is actually false. After we accept the hypothesis as true, we then go through a process of thinking and re-thinking the hypothesis before finally deciding if our initial acceptance of the hypothesis was a prudent decision.
For example, if you decided that a product announcement was going to produce a dramatic price increase in a company's stock next week, you first accept that you're right, Stage 1 of the thinking process. By accepting you are right, you build up the motivation to further study your hypothesis and decide if you are in fact right. It makes sense when you think about it. If you thought that your hypothesis was wrong, you would just forget about it and move on. You might see how problems may arise in the way the mind works.
What if you decided your strategy was right, but then stopped deliberating, instead of continuing to question whether or not you made a good decision? If you stop too soon, and avoid Stage 2 of the thinking process, you'll continually jump to the wrong conclusion and erroneously implement unprofitable trading strategies. It's important that you think and rethink the strategy a little while longer. You must play Devil's Advocate and think about what might go wrong. For instance, a product announcement won't lead to a profit if media analysts report that the product will be a dismal failure. You must do a little extra research to decide if there is evidence of an unexpected event that may ruin your plan.
People often forget to fully evaluate their initial decisions. Why? Research studies have shown that when people are under time pressure, or tired and worn out, they do not fully deliberate their decisions. In other words, they engage in Stage 1 thinking, they accept that their hypothesis is true, but they avoid Stage 2 thinking; they assume their initial hunch is right without fully considering evidence that may refute its veracity.
When making a trading decision, fully deliberating your alternatives is essential. You don't want to over-deliberate, but you don't want to be impulsive. Don't rush the decision making process. Slow down, and realize your limitations. When you are overloaded with too much information to sift through, or you are just too tired to think straight, you will make an impulsive judgment. Make sure you are rested and relaxed. By staying psychologically alert, you'll increase the odds of choosing winning trading strategies.
© by Joe Ross. Re-transmission or reproduction of any part of this material is strictly prohibited without the prior written consent of Trading Educators, Inc.
Instant Income Guaranteed - KBH Trade
Developer: Joe Ross
Administration and New Developments: Philippe Gautier
With implied volatility at the lowest level since we started IIG daily guidance, it is much more difficult to find safe trades with sufficient premium levels, but it is still possible.
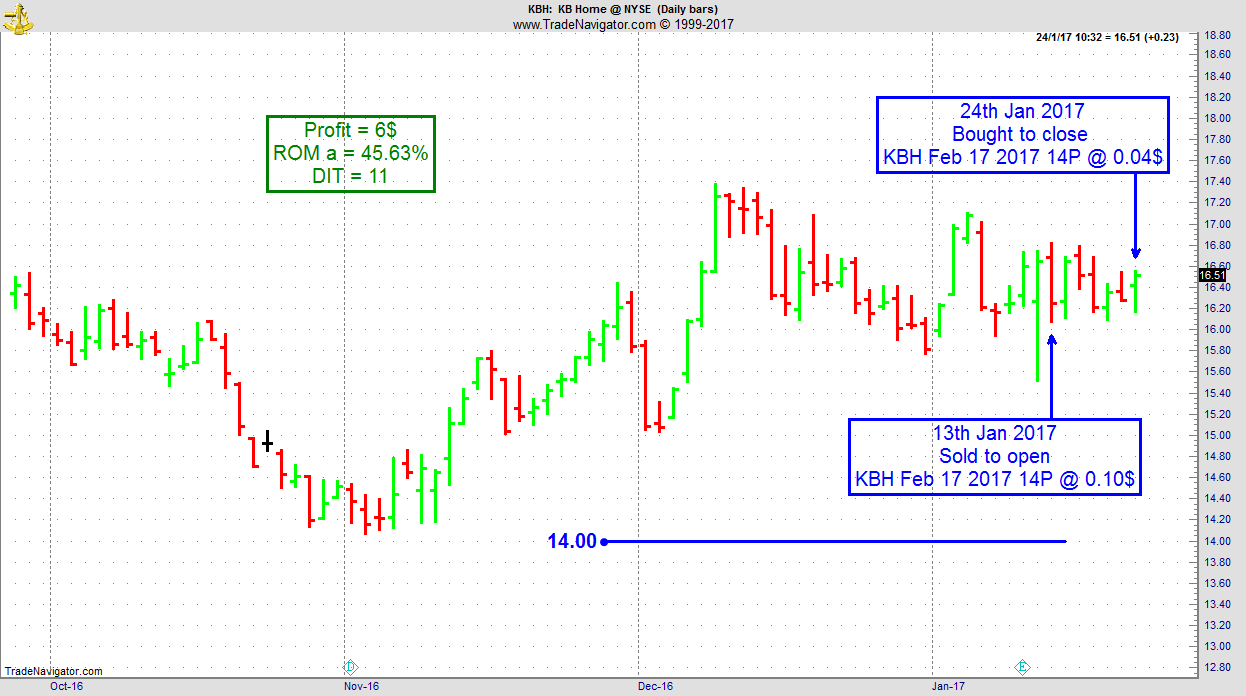
On 12th January 2017, we gave our IIG subscribers the following trade on KBH, which was in a trading range on the daily chart. We decided to sell price insurance as follows:
- On 13th January 2017, we sold to open KBH Feb 17, 2017 14P @ $0.10, i.e. $10 per option sold, with 34 days to expiration, and our short strike at a major support zone, about 16% below price action.
- On 24th January 2017, we bought to close KBH Feb 17, 2017 14P @ $0.04, after 11 days in the trade, for quick premium compounding
Profit for one contract: $6
Margin: $280
Return on Margin annualized: 45.63%
This trade was suitable for very small accounts due to the very low level of margin.
We have also added new types of trades for our IIG daily guidance, "no loss" propositions with unlimited upside potential, still using other people's money to trade (see recent EWZ and X recent examples).
Philippe
Receive daily trade recommendations - we do the research for you!
Instant Income Guaranteed
♦ SIGN UP TODAY! THIS IS WORTH THE INVESTMENT ♦
Check out our Blog!
To view previous published Chart Scan newsletters, please log in or click on "Join Us,"
shown above, to subscribe to our free "Members Only" section.
A WEALTH OF INFORMATION & EDUCATION:
Joe Ross-Trading Educators' popular free Chart Scan Newsletter has been published since 2004.
Note: Unless otherwise noted, all charts used in Chart Scan commentary were created
by using Genesis Financial Technologies' Trade Navigator (with permission).
Legal Notice and Copyright 2017 Disclaimer - Published by Trading Educators, Inc.
Chart Scan is a complimentary educational newsletter.
© by Trading Educators, Inc. Re-transmission or reproduction of any part of this material is strictly prohibited without prior written consent.

