
Edition 661 - February 10, 2017


Chart Scan - Where do I put the Stop?
by Master Trader Joe Ross
Author, Trader, Trading Mentor, and Founder of Trading Educators, Inc.
How much can you risk psychologically, emotionally, and financially before taking a loss that will put you into the fetal position, sucking your thumb in a catatonic state of existence?
Once you know how much risk you can stand to take, you can then begin to consider which time frame you should trade. You must match the risk you are personally willing to take with the amount of risk in the market.
Let’s say you are willing to risk $300 per contract. Does it make sense to risk $300/contract using a monthly chart? How about a weekly or daily chart? Do you see where I’m going with this? You need to choose a time frame in which the average risk/trade is around $300 or less.
How do you determine the amount of risk in the market and time frame you wish to use? There are several ways to do it.
You could use Wilder’s Volatility Stop Study, which would show you graphically where to place the stop. You could curve-fit a moving average to the chart, and then look to see the amount of risk you would be taking if the moving average were to be hit. You could test to see on average how much prices move against you based on the setup you are using.
For example: Let’s say you love to trade outside reversal bars (engulfing reversals for you candle heads). You could go back to look at the last 45 times you had an outside reversal in the market and time frame of your choice, to see on average how much prices move against you after you buy 1 tick (pip) above the high, or after you sell 1 tick (pip) below the low.
The main thing is to match your risk tolerance to the risk in the market. If the risk is too high, move to a shorter time frame. If the risk is too low, move to a greater time frame.
The chart below shows using Wilder’s Volatility Stop.
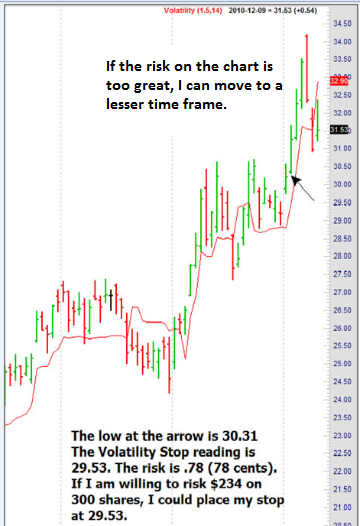
The chart above is a the price chart of a stock. Of course I can do the same thing with futures, or forex, or even CFDs. I simply move the time frames up or down until I find a match to my risk tolerance. Four bars later, I would have been stopped out of the trade where the risk was 74 cents. So I would have to subtract 74 cents/share from whatever unrealized profit I had in the trade. Actually I made this trade, using a Traders Trick Entry, at a price of 28.38, and exited at 29.53 for a profits of $1.15/share. There is another way I could have done it; those of you who have taken private tutoring or attended one of my seminars should know what else I could have done.
© by Joe Ross. Re-transmission or reproduction of any part of this material is strictly prohibited without the prior written consent of Trading Educators, Inc.
Trading Article - About Change
by Master Trader Joe Ross
Author, Trader, Trading Mentor, and Founder of Trading Educators, Inc.
People don't want to be changed. They don't want to be told that they need to change. Do you ever find yourself struggling in those areas? Thank you for your honesty. If there is a struggle, that means there is a battle for truth. If you're not battling, you've already lost. Truth has been lost and deceit has won.
We must come to a place where we are willing to unclothe our soul, ultimately, completely. And it's the hardest battle there is. It's doable. You can do it. Anyone can do it if they want to badly enough. It's doable. It is just that not all people really want it. Not all people are willing to be taught. People come to me all the time, years, I'm talking about decades of seeking success and people will come to me and say to me, "Please mentor me. Help me know how to trade the markets so that I can be profitable. Please mentor me." And in the past I would often say, "Okay. I'll teach what I know, that's all I can give."
But you know what I learned? I learned that people don't want to change. People don't want to be told that they have to change. People resent being corrected. Do you know anyone like that? It's understandable, right? It's not easy to be corrected. Yet experience shows that life as a trader is a life of correction. So whereas you may know people that don't want to be corrected, the fact is, if you are going to trade successfully you are going to have to learn how to receive correction. It's really the hardest part, what I'm giving you right now. It's the hardest part. Everyone wants to think that they are lovable just the way they are, and maybe they are lovable just the way they are but that's not going to necessarily help the real deep things that hide in your soul that will destroy true success. We can't like ourselves too much. Do you understand what I am saying? You know what to do, now do it! That’s a correction, by the way.
What will be your response? Will you turn and walk away?
If a person is rich in their self-love, do not like correction, loves trading, loves markets, and maybe have a great intensity – in the eyes of other traders, that person may be highly prized, but what is hidden deep in the recesses of the heart is “I love who I am, what I am, what I want. I don't like to be corrected. I don't like to be challenged, to be changed. I don't like those kinds of messages.”
How many of you know what that feels like? But the fact of the matter is if you really want success you have to come back to the center and the center has to be changed from pride to humility. When that happens, things inside of you will change. Maybe even some of the old things that are so deep you never thought they could be changed.
If you are not willing to be corrected, if you're not willing to take off the old, how can you put on the new? How can you clothe yourself with the necessary attitude, if you're not willing to change? If you're one of those traders that always has to be right and no one can question you on it no matter how badly it's needed, you'll never have success, not ever.
© by Joe Ross. Re-transmission or reproduction of any part of this material is strictly prohibited without the prior written consent of Trading Educators, Inc.
Instant Income Guaranteed - NOV Trade
Developer: Joe Ross
Administration and New Developments: Philippe Gautier
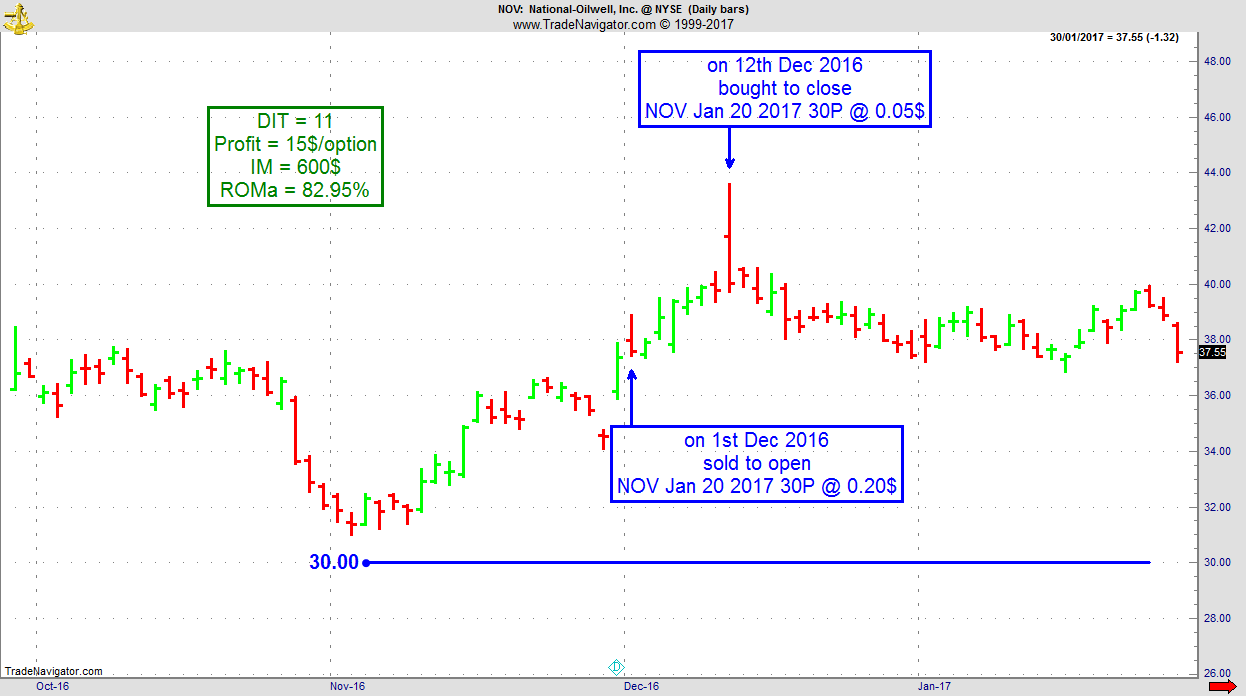
On 30th November 2016, we gave our IIG subscribers the following trade on NOV, which was in an established uptrend on the daily chart. We decided to sell price insurance as follows:
- On 1st December 2016, we sold to open NOV Jan 20 2017 30P @ $0.20, i.e. 20$ per option sold, with 49 days to expiration, and our short strike below a major support zone, about 20% below price action.
- On 12th December 2016, we bought to close NOV Jan 20 2017 30P @ $0.05, after 11 days in the trade, for quick premium compounding.
Profit: $15 per option
Margin: $600
Return on Margin annualized: 82.95%
This trade was pretty safe in spite of overall very low implied volatility levels.
We have also added new types of trades for our IIG daily guidance, "no loss" propositions with unlimited upside potential, still using other people's money to trade (see recent EWZ example in Newsletter Edition 649).
Philippe
Receive daily trade recommendations - we do the research for you!
Instant Income Guaranteed
♦ SIGN UP TODAY! THIS IS WORTH THE INVESTMENT ♦
 Ambush Trading Natural Gas back to new Equity Highs!
by Professional Trader Marco Mayer
Educator for Forex and Futures, Systematic Trader, and
Creator of Ambush Trading Method, Ambush Signals, and AlgoStrats.com
The Natural Gas Future is one of the favorite markets of Ambush Traders. And so for a good reason. Its performance has been very stable over the years and drawdowns tend to get recovered quickly.
But even trading Natural Gas there are times when it can get bumpy trading Ambush. And as we just experienced one of these periods, I thought this might be a good time to have a look at some statistics regarding Drawdowns.
Now Drawdowns are not what traders want to hear or even think about. And this probably isn’t the best way to advertise a product. But it’s a very important one and it’s what you should think about before starting to trade. What can go wrong? What kind of pain will you have to endure? Can you make it through that?
Let’s start with the equity curve. First of all, the results here assume we’re trading one contract all the time, pay $5 commissions per round-turn and get 1/2 tick slippage on any non-limit order.
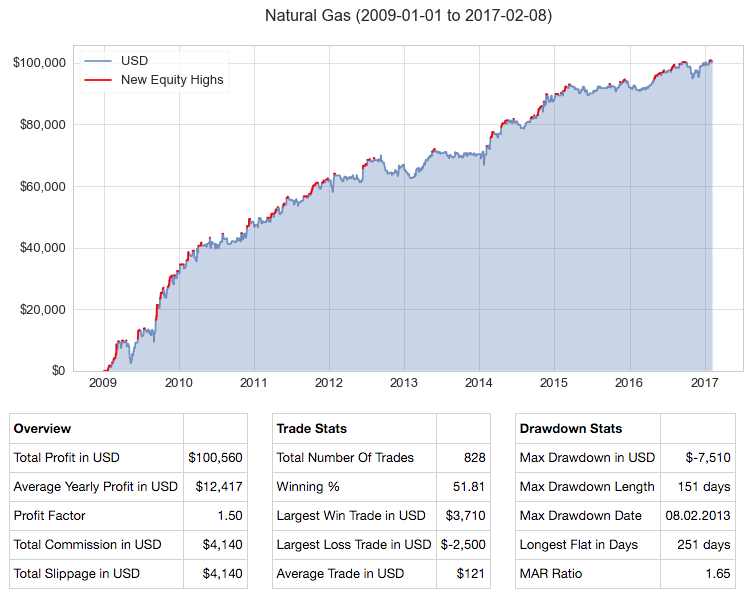
On the chart every new equity high is marked red and as you can see we just made new all time equity highs in NG. Another thing to notice is that new highs happen quite often compared to other strategies. During 2016 we had a huge draw-up period making lots of new equity highs.
One of the most useful metrics to measure the impact of drawdowns is the MAR Ratio. It takes the average yearly profit (usually compounded in %, in our case, it’s not compounded as we’re always trading 1 contract) and divides it by the maximum drawdown. Which means, the higher the number, the better. If it’s above 1 that’s a good sign, and anything above 1.5 is really good. In our case, we got a MAR Ratio of 1.65, so the average yearly profit ($12.5k) is 1.65 times the maximum drawdown (-$7.5k). Which means to make those $12.5k on average a year, you’d have to endure a drawdown of about -$7.5k sometime in between. Sounds like a very good deal, doesn’t it? If it doesn’t then trading maybe isn’t the right business for you. No pain, no gain.
Now let’s have a more detailed look at the drawdowns:
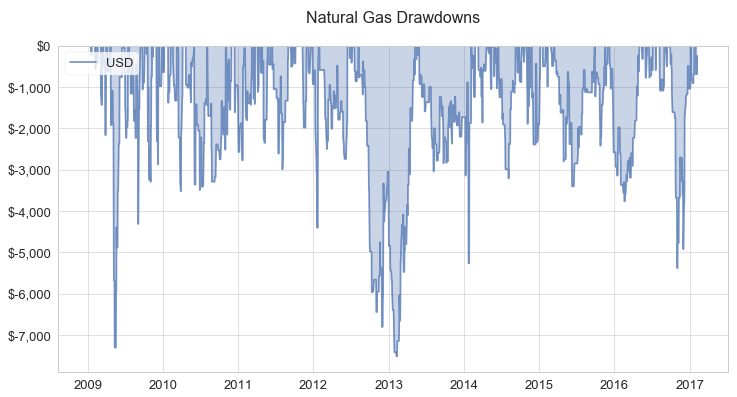
This gives you a pretty good idea what you’ll have to make it through on a regular basis (up to -$3k drawdowns), sometimes (up to -$5k drawdowns) and the two worst cases that don’t happen often but you better are aware that they could (up to -$7.5k drawdowns).
So what happened at the end of 2016 was ugly, but not that unusual. Also, notice how quickly these drawdowns tend to recover (with the exception of 2013).
Again this is not what most traders want to think about. It’s so much more fun to think about the $12k profits a year per contract! But the day will come when you’ll be much better off to have thought this through. To be prepared when the shit hits the fan, and it will sooner or later. Then this kind of knowledge is what helps you to now throw in the towel at exactly the wrong time, to keep on trading, keep on pushing through and to make it to the next equity highs!
How to reduce drawdowns? The wrong path would be to try and somehow filter out these losing periods. That’s going to work in the backtest, but not in real trading. The best way to reduce drawdowns is to diversify. Trade more than one market. Trade more than one system. That’s what will make that MAR ratio go above 2 and higher.
Happy Trading!
Marco
Become an Ambush Trader today!
Two Easy Ways:
- Buy the Ambush eBook and learn all about how the method works and set everything up yourself.
OR
- Join Ambush Signals and simply get access to the daily Ambush Signals for all of the supported Futures markets. This way you can follow Ambush without having to go through the hassle of setting up charts, indicators, or taking care of getting the right data and so on.
© by Marco Mayer. Re-transmission or reproduction of any part of this material is strictly prohibited without the prior written consent of Trading Educators, Inc.

Blog Post - How to Approach Trading? Part 1
by Professional Trader Andy Jordan
Educator for Spreads, Options, Swing/Day Trading, and
Editor of Traders Notebook Complete and Traders Notebook Outrights
To develop a trading plan is the key to your trading success. Read more.
Traders Notebook Complete had its most profitable year in 2016!
Learn how to manage this trade by getting daily detailed trading instructions, click here.
Andy is offering a FREE 2 Week Trial - Sign up before February 11th
Yes, sign me up!
© by Andy Jordan. Re-transmission or reproduction of any part of this material is strictly prohibited without the prior written consent of Trading Educators, Inc.
Check out our Blog!
To view previous published Chart Scan newsletters, please log in or click on "Join Us,"
shown above, to subscribe to our free "Members Only" section.
A WEALTH OF INFORMATION & EDUCATION:
Joe Ross-Trading Educators' popular free Chart Scan Newsletter has been published since 2004.
Note: Unless otherwise noted, all charts used in Chart Scan commentary were created
by using Genesis Financial Technologies' Trade Navigator (with permission).
Legal Notice and Copyright 2017 Disclaimer - Published by Trading Educators, Inc.
Chart Scan is a complimentary educational newsletter.
© by Trading Educators, Inc. Re-transmission or reproduction of any part of this material is strictly prohibited without prior written consent.

