
Edition 665 - March 10, 2017


Chart Scan with Commentary - Trade Management
by Master Trader Joe Ross
Author, Trader, Trading Mentor, and Founder of Trading Educators, Inc.
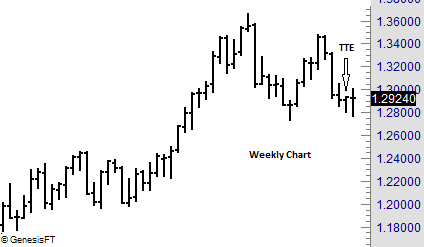
Prices have formed doji on the weekly chart. That doji bar, although it was an outside bar, also filled a Traders Trick Entry from the previous week. The question was “Would that entry also be fulfilled on the daily chart during the following week. By dropping down to the daily chart, would we see a chance for entry with a Traders Trick™ on the daily chart. Implementation of The Law of Charts™ teaches that entry signals from a larger time frame can often be entered and managed on a lesser time frame. So let's look at the daily chart and then see how we might have entered a trade based on a weekly signal on the daily time frame.
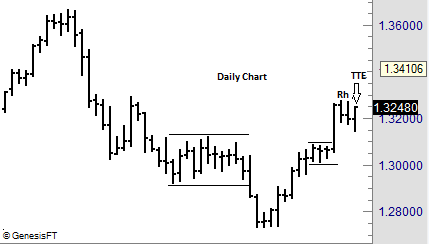
The Law of Charts states that a Ross hook is the first failure of prices to move higher following a breakout from congestion. The Law also states that a good way to enter such a trade is from a Traders Trick entry. In this case entry would be at 1.3253.
Now let’s go to a lesser time frame for actual entry and management with a daily chart.
© by Joe Ross. Re-transmission or reproduction of any part of this material is strictly prohibited without the prior written consent of Trading Educators, Inc.
Trading Article - Keeping Your Focus Right
by Master Trader Joe Ross
Author, Trader, Trading Mentor, and Founder of Trading Educators, Inc.
Some time ago I spent 4 days in a Forex trading office, teaching and working with the traders there. It was interesting to see how these traders speak with one another, and to listen to what they say. I couldn’t help making some observations which I will now share with you.
If you are a part- or full-time trader, you may have enjoyed the attention this wild and wooly occupation brings at social gatherings and events. Many are interested in trading, and find you interesting as a successful trader. At first, the attention may be enjoyable; but a need to maintain this reputation may impact your trading attitude and mindset, and therefore, your bottom line.
The best strategy you can use to avoid letting your reputation influence your performance—especially when enduring a drawdown period—is to keep your conversation low-key about your trading career. Why? The more you present yourself socially as a "successful trader," the more psychological effort you will spend defending this reputation. Several research studies have documented that one of the biggest obstacles to sound decision-making is the need to save face in social situations. People are so reluctant to face the adverse social consequences of having made a poor decision that they stay on a losing course of action, rather than admit they were wrong. For example, some traders are reluctant to sell off losers in order to avoid the possible social criticism that acknowledging a failure may bring.
Suppose you have told your friends about a large position, and within minutes, hours, or days, it tanked, hard and fast. Most folks can’t wait for the next opportunity to ask you (even though they probably know the answer) how your “hot trade” is doing. If you got rid of it, at least you have the solace of managing the trade properly—even though you must tolerate a volley of smug “you-thought-it-would-go up and such, but-it crashed-instead” comments. On the occasions when you ignored your protective stop, however, and held onto the bad trade, the “Boy, you-really-ARE-dumb” looks (and perhaps comments) can exacerbate the psychological devastation you've by now, surely, inflicted on yourself. And we all know the negative impact a negative attitude can have on our trading.
As another example, how many times has the market gapped up, then chopped through the rest of the day, handing you more losses than wins? Inevitably, those are the days when well-meaning friends call on the phone. “You must have made a fortune today!” they gush. “Not really,” you mumble with a sinking heart, remembering the frustrating trading environment. After you hang up the phone, the subsequent feelings can lead you to believe you must have been a dope that day; surely every trader in the world except you grabbed huge gains. In social environments, once you announce and identify yourself as a trader, you will feel a need to defend your reputation. Trading is hard enough, why introduce additional social and psychological pressures that will adversely influence your trading results? Keep the specifics of your trading career to yourself. There is no sound reason to discuss the specifics of your career socially. It’s often done just to build up your ego, and enjoy the attention of others. You'll pay a price for this short-term gratification in the long run. Avoid specific observations or trading choices. That way, you'll avoid embarrassing questions and comments that will interfere with your trading.
© by Joe Ross. Re-transmission or reproduction of any part of this material is strictly prohibited without the prior written consent of Trading Educators, Inc.
Instant Income Guaranteed - TOL Trade
Developer: Joe Ross
Administration and New Developments: Philippe Gautier
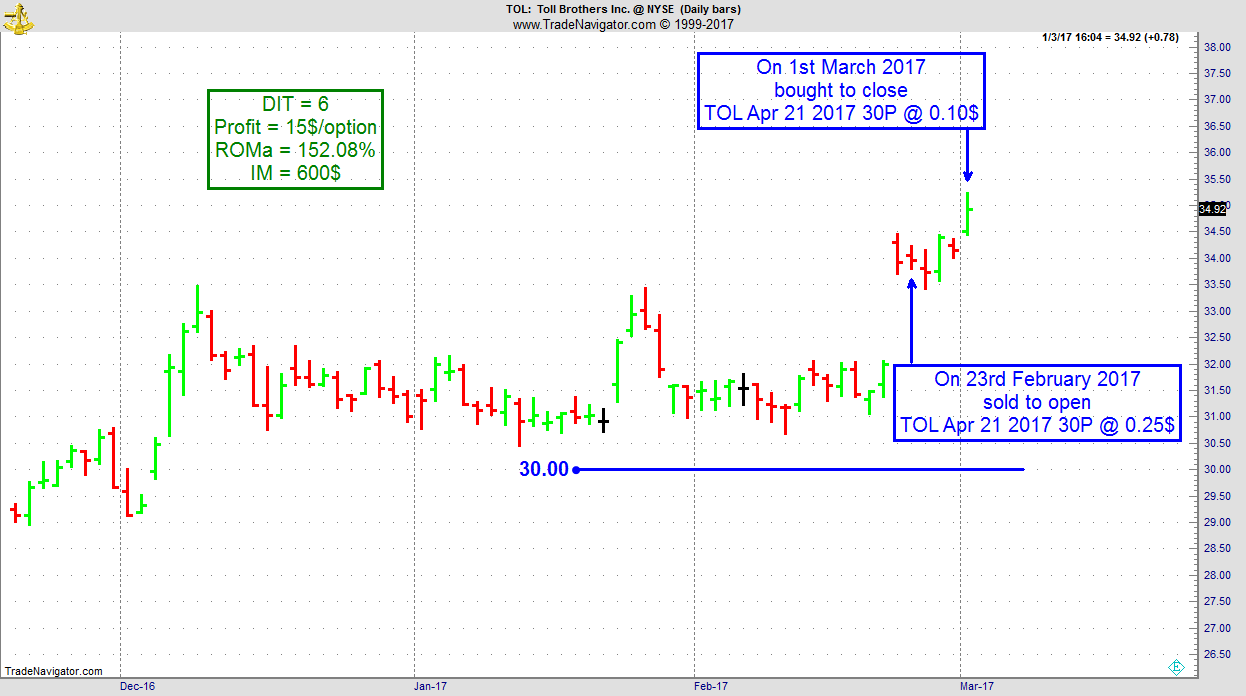
On 22nd February 2017 we gave our IIG subscribers the following trade on TOL, after an earnings gap. We decided to sell price insurance as follows:
- On 23rd February 2017, we sold to open TOL Apr 21 2017 30P @ $0.25, i.e. $25 per option sold, with 58 days to expiration, and our short strike below a major support zone, about 12% below price action.
- On 1st March 2017, we bought to close TOL Apr 21 2017 30P @ $0.10, after 6 days in the trade, for quick premium compounding
Profit: $15 per option
Margin: $600
Return on Margin annualized: 152.08%
This trade was pretty safe in spite of the very low implied volatility environment we are now in.
We have also added new types of trades for our IIG daily guidance, "no loss" propositions with unlimited upside potential, still using other people's money to trade.
Philippe
Receive daily trade recommendations - we do the research for you!
Instant Income Guaranteed
♦ SIGN UP TODAY! THIS IS WORTH THE INVESTMENT ♦

Latest Blog - Can Trading Be Trained?
by Professional Trader Andy Jordan
Educator for Spreads, Options, Swing/Day Trading, and
Editor of Traders Notebook Complete and Traders Notebook Outrights
This week, Andy includes a short podcast he found interesting and uses it to point out some revelant facts that many people don't take into consideration. Read more.
In addition, Andy continues his series on How to Approach trading with Part 5:
Follow the Markets
After you've determined your strategy and the market or markets you will trade, you can start following the price action. It is important to follow each market consistently and see the trading opportunities as they develop. Jumping around from one market to another often leads to missed or late execution of your method. I think it's important to let the market tell you what to do. I'm sure many of you have heard the saying, "The trend is your friend." There is truth in that, but not all good trading must follow the trend. Since these days markets trend so little that perhaps we should come up with a new saying: "The swing is your thing." How about this one: "The setup is my get up."
I don't generally concern myself a lot with how much a market is going move overall. But I am concerned with how much the market will move minimally. I want to guarantee myself a minimum move a high percentage of the time. I'm satisfied with being on the right side of the trade. However, I'm constantly asked; "Where do you think prices are going?" or "When should I get out of the move?" My answers are usually; prices will move in the direction of the trade—they will go where they want to go." And "Get out of a trade when it quits going your way, or you’re satisfied with the profits you’ve made." A potential objective number of points, ticks, or pips are most useful when you are trying to decide which of several different markets to trade or when deciding how much of your capital to allocate to a particular trade.
Stay on the Right Side
It is important to stay on the right side of the market, buying when it is going up, selling when it is going down, and staying out when it is not going anywhere. But again, this is a generality. There are plenty of traders who make their money when a market is not going anywhere. Option sellers who straddle and strangle love markets that are going nowhere at all. In any event, staying out is often easier said than done.
Sometimes you'll have to be pretty nimble to stay on the right side of the market.
It's important to not be committed to a direction when the market tells you otherwise and be willing to allow that the market is never wrong.
© by Andy Jordan. Re-transmission or reproduction of any part of this material is strictly prohibited without the prior written consent of Trading Educators, Inc.
 Volume in the Forex Markets - Useful or Not?
by Professional Trader Marco Mayer
Educator for Forex and Futures, Systematic Trader, and
Creator of Ambush Trading Method, Ambush Signals, and AlgoStrats.com
As traders, we’re always looking for useful data that might give us an extra edge. That’s even truer for technical/price focused traders where all we have is the open, high, low and close of a market (or tick data, but that usually ends up in some similar transformation as OHLC data). Sure there are thousands of indicators but these are all just transformations of that price data.
Now in many markets volume can be a useful addition to that. Knowing if there was heavy trading within a certain time period or not can be valuable information. It can be used as a filter for trade signals, looking for strong volume on a breakout for example. But there’s also a couple of volume based indicators that incorporate volume in a useful way.
In the futures markets, when you look at the volume you actually see how many contracts have been traded at the exchange during that time period. And you see all of it, of all market participants in that market as there’s just one exchange.
But Forex trading is decentralized, OTC trading. There is no single place to look at to see the actual volume of a currency pair. That’s why it’s often said that the volume provided by your broker is pretty useless. All you would see is the trading volume that happened at your broker, either between clients and liquidity providers in an ECN or if you’re trading at a market maker between your broker and it’s clients. But retail traders are not moving the markets, their volume is totally meaningless in a such a big marketplace.
And of course, the institutional traders that are responsible for the volume that matters don’t trade at a retail broker. They’re on Reuters, EBS or just trading directly with other banks/institutions. So if you just see the volume that happened at your retail broker, it’s useless information right? That’s what I thought too and so I never paid much attention to volume in FX.
Until recently when CLS FX volume data became available for the retail customer over at Quandl. CLS runs the largest FX settlement service in the world and therefore they have the information we’re looking for. Institutional Forex trading volume, the volume that actually matters and moves the markets. Now CLS does a great job here and as always, it’s super easy to use the data via Quandl. So if you can afford it, I think that data is the best forex volume data you can get and that is well worth its price.
So once that real volume data was available, I, of course, got very excited and curious. Maybe it was time to have another look at volume data in the Forex markets. How would the CLS volume data compare to different brokers data? What is it actually that you see at your broker? And how does it compare to the Futures contracts?
Two brokers that offer volume data and I already had an API to connect to are Oanda and Dukascopy. So I downloaded their data, merged both to the same daily time periods and compared them. The first surprise for me was that it was almost identical (over 90% correlated). So I decided to read more about that data and found out that what they’re providing is actually "tick volume" data. This means that whenever there’s a new quote from the source they’re using (Oanda probably uses Reuters and other similar data feeds, Dukascopy offering ECN trading probably use the quotes of each of their liquidity providers) that would make the volume go higher. That of course strongly increases the odds of their volume data actually being useful. It would mean that what we’re seeing is not what’s going on between them and their clients but on their quote data sources. And that indeed might be informative.
But is it? As traders we never want to rely on an assumption, we want actual numbers that proves our idea right or wrong. So let's find out! The first step was to get one of the free samples of CLS data available at Quandl. I picked the daily GBP/JPY spot data and compared it to Oanda's tick volume data.
First of all the actual absolute numbers are of course totally different. And if that's what you need, CLS is the only way to go. But as traders what we usually are interested in is "Is today's volume above/below average?" or "Is today's volume some standard deviation above/below average?" and so forth. And for this we're fine as long as the data is correct on a normalized basis.
Here’s a graph of GBP/JPY volume from CLS and Oanda plotted on two Y axis (CLS left, Oanda right):
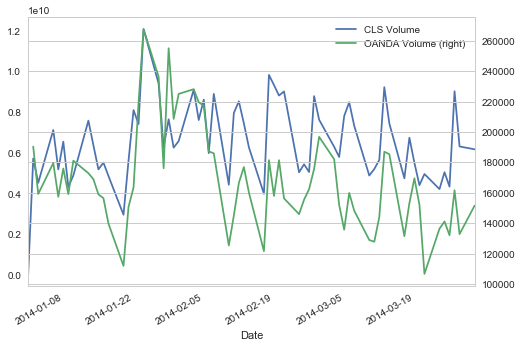
So again, yes the absolute numbers are totally different but on a relative basis, looking for volume rising/falling and most of the spikes they look quite similar.
Looking at the same data showing the percent change between each day that becomes even more clear:
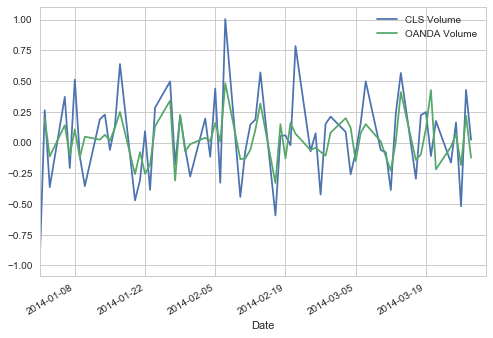
Now there are differences, but as you can see they’re highly correlated. Which leads me to the conclusion that FX brokers data might indeed be of some value.
My next idea was to compare one of the spot Forex markets to a futures market. I picked AUD/USD spot FX, again using Oanda data and the Australian Dollar Future (6A) traded at the CME.
Again, on a relative basis looking at the percent change of day to day volume we get another confirmation:
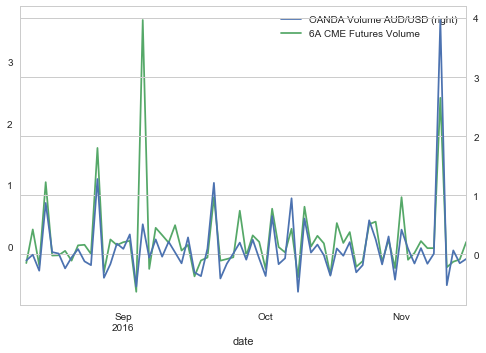
Conclusion: Surprise! As so often in trading the result of that little investigation is very different from what I expected. The FX volume data provided by your broker/ECN might indeed be valuable information!
Happy Trading!
Marco
Click here to learn more about Professional Trader Marco Mayer - AlgoStrats.com!
![]()
© by Marco Mayer. Re-transmission or reproduction of any part of this material is strictly prohibited without the prior written consent of Trading Educators, Inc.
Check out our Blog!
To view previous published Chart Scan newsletters, please log in or click on "Join Us,"
shown above, to subscribe to our free "Members Only" section.
A WEALTH OF INFORMATION & EDUCATION:
Joe Ross-Trading Educators' popular free Chart Scan Newsletter has been published since 2004.
Note: Unless otherwise noted, all charts used in Chart Scan commentary were created
by using Genesis Financial Technologies' Trade Navigator (with permission).
Legal Notice and Copyright 2017 Disclaimer - Published by Trading Educators, Inc.
Chart Scan is a complimentary educational newsletter.
© by Trading Educators, Inc. Re-transmission or reproduction of any part of this material is strictly prohibited without prior written consent.

