
Edition 671 - April 21, 2017


Click on the above picture or here to view our Home Page!

Trading Idea: Short ESM7 (June E-Mini S&P 500)
by Professional Trader Andy Jordan
Educator for Spreads, Options, Swing/Day Trading, and
Editor of Traders Notebook Complete and Traders Notebook Outrights
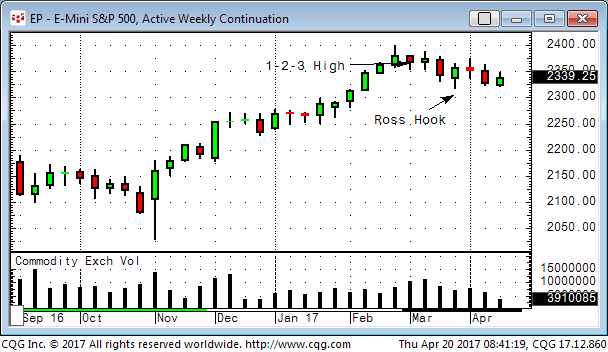
When we look at the ES on the weekly chart we notice the completed 1-2-3 high formation in March and we see the possible Ross Hook to the down-side.
When we look at the daily chart we see, that we also have a Ross Hook to the down-side as well and therefore a short entry might make sense.
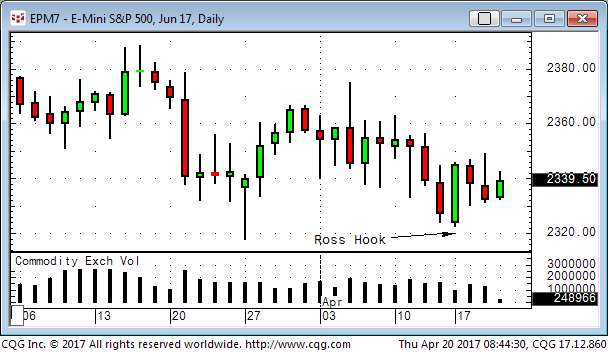
How to manage the entry and the trade depend on what time frame you use for your trading, but an idea could be to use 30- or 60-minute charts to time the entry on a shorter time frame and to reduce the risk. Of course you can use 15-minute or 120-minute charts as well, it depend all on your preferences. A first target could be the March 27 low and if we break lower 2300 could also be possible.
Learn from an expert - receive his daily trade recommendations!
Traders Notebook Complete
© by Andy Jordan. Re-transmission or reproduction of any part of this material is strictly prohibited without the prior written consent of Trading Educators, Inc.
FREE Webinar by Andy Jordan
Futures Spread Trading - A Dynamic but Overlooked Aspect Of Trading
April 24, 2017
1:00 PM, EDT
Trading calendar spreads and/or inter-commodity spreads is one of the less volatile, more conservative, more reliable ways of trading. Join Andy Jordan, professional trader and trading coach, as he explains and demonstrates the advantages of spread trading and how to use spreads in today’s markets. Andy has been trading futures spreads for more then 15 years and is the “spread guru” at Trading Educators.
Go to our Home Page and scroll down to our "Register Today" button
Lead By Example!
Our Traders Know How to Relax When Not Trading
Andy Jordan recently went to the beach!

No Laptop, No Markets….Just Beeeeer!
Check out more of my vacation pics!

Chart Scan with Commentary - Planning: A Key to Successful Trading
by Master Trader Joe Ross
Author, Trader, Trading Mentor, and Founder of Trading Educators, Inc.
From time to time I get some very interesting confessions. Here is a very recent one, along with a solution.
“I had been looking at a profitable trade setup all day. I studied indicator after indicator looking for confirmation, even though I know many are correlated and redundant. But I just kept on searching. I thought, ‘Maybe I missed something.’ My account is now so small that I just wanted to be sure that this was the right trade. My thought was that I must take into consideration anything and everything that could cause this trade to fail. I can’t afford to lose any more money. What should I do?”
Like most traders in this kind of situation, there is a need to have the ability to make a decision, but it is difficult to do if the trader is undercapitalized and in the position of making trading decisions out of fear and uncertainty.
Many traders suffer from too much analysis. They are looking at so many things, they can no longer see straight. If a trader keeps on over-analyzing trades, “analysis paralysis” may set in and develop into a deep-seated psychological problem.
Carefully analyzing the possible consequences of trading decisions is healthy, but it becomes unhealthy when it is overdone. When it comes to trading, it’s important to have a clearly defined trading plan. Be as certain as is possible that any given trade is not going to wipe out the trading account. That is one of the reasons we suggest the use of a time stop when trading in addition to a money stop. When using both types of stops they clearly define the signs and signals that indicate a trading plan is not working, suggesting that the trade should be closed out in order to protect trading capital. It is important to realize that a trader might not only be wrong about the direction of prices but that it is also possible to be wrong about the timing of an entry into a market. Either one can end up in a losing trade.
Trading, by its very nature, is uncertain. There is little that can be described as security for traders. Every trade is a new event, and every entry is an entirely new business. A trader does not have the luxury of living from past accomplishments. Each day the business starts over again. You cannot build up a list of faithful repeat customers in this business. The only things that are carried forward are experience and hopefully, lessons learned.
Trading is not for anyone who has an unquenchable thirst for certainty. Uncertainty in trading is co-equal with insecurity. If money represents security to a trader, that trader has a real problem. Most advisors will agree that trading should be done only with money that the trader can afford to lose. Sadly, not many follow that advice. Losing money not only costs the trader financial security, but emotional security as well.
I often tell people that I have mentally divorced myself from the money involved in trading. I often don’t know until the end of the month whether I have won or lost money. I trained myself to think of trading as an endeavor in which I strive to make points. Only later are those points translated to dollars. In that sense, for me trading is making point. As long as I’m making more points than I’m losing, I feel good about my trading. Of course, I keep in mind that when I’m trading in more than one market those points are not always of equal value. I also never lose sight of the fact that trading is a serious business.
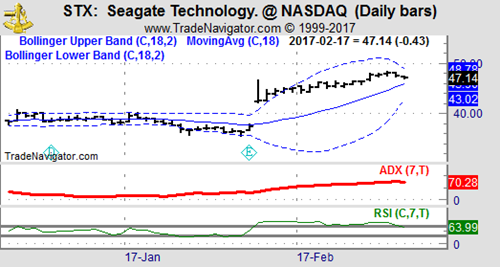
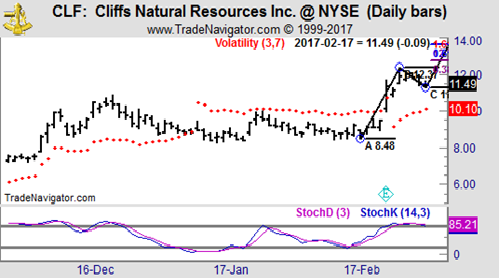
Insecurity among traders who over-analyze manifests in a search for the holy grail of trading, desperately seeking the right indicator or the perfect trade setup, as on the chart below. The problem is that even when something that looks good is seen, there is no feeling of certainty that the trade is sufficiently perfect to act upon. Why? Because the real lack is confidence in the ability to trade what may be clearly seen, as well as a lack of self-confidence, and because of fear of the pain of another loss.
I was taught to do my analytical work at a time when markets were not day traded and were not electronic. I had to adapt to the realities of markets as they are traded today.
First, I go through all my charts to get an overview of the markets. During that time, I look for trending markets. Trend lines are sometimes placed on the charts as best I can do them. This action can help me to identify the trend. These days it is easily done with software.
Next, I go through all my charts looking for “against the grain” moves—the intermediate trend that goes against the longer term trend. This alerts me to prices that might soon resume trending.
Then I go through all my charts looking for Ross hooks. I mark each hook with a bright red “h.” This, too, is possible to do with computer software. Then, in light of the size of my margin account, I try to select those markets that appear to have the greatest potential, and I place order entry stops where I have determined I can make a suitable entry. These are resting orders in the market. I try to never miss a pre-hook entry.
How do I know which markets have the greatest potential? The answer is simple. I select those markets that have the strongest trend lines along with the most consistent daily price range—a price-range sufficient for me to take my piece out of the market.
Now there is a trick to this. I don’t want too steep a rise or fall because in a rising market too steep often signals that the end of a move is near. Prices that break out too fast and go straight up rarely give an opportunity for entry before they start to chop around in congestion. If prices have been going up steadily, and suddenly that angle steepens—goes parabolic, prices are giving a warning that the move may soon be over. In down markets I am willing to allow a steeper angle, because often a market will move down a lot faster than it moved up.
What I want most is nicely trending markets that are making a retracement. Then I can attempt an entry as the market retraces.
Sometimes I have to wait a relatively long time before prices begin trending, depending on the time frame I am trading. The only thing that changes is that the shorter the time frame the shorter the wait for prices to start trending. There will usually be at least a couple of markets in a trending condition, but there are times when there are none.
Yet I do my homework every day. The only way to know when an important breakout, the beginning of a trend, might occur is to perform my daily analytical work.
Finally, I will set my work aside and take a break. After a break, when my head has cleared a bit, I will look at my charts again. I will then do my best to come up with a trading plan. I will try to think through what I am going to do. I will ask myself lots of “what ifs.” I try to anticipate what might happen in the market. Often that kind of thinking will cause me to eliminate some of my potential trades.
© by Joe Ross. Re-transmission or reproduction of any part of this material is strictly prohibited without the prior written consent of Trading Educators, Inc.

Trading Error: Trading Your P&L
by Professional Trader Marco Mayer
Educator for Forex and Futures, Systematic Trader, and
Creator of Ambush Trading Method, Ambush Signals, and AlgoStrats.com
In this video, Marco talks about another very common trading mistake, and that's trading your P&L instead of the actual market. If you're struggling to become a winning trader, this might be an eye-opener, especially if you're a breakeven trader right now.
© by Marco Mayer. Re-transmission or reproduction of any part of this material is strictly prohibited without the prior written consent of Trading Educators, Inc.
Check out our Blog!
To view previous published Chart Scan newsletters, please log in or click on "Join Us,"
shown above, to subscribe to our free "Members Only" section.
A WEALTH OF INFORMATION & EDUCATION:
Joe Ross-Trading Educators' popular free Chart Scan Newsletter has been published since 2004.
Note: Unless otherwise noted, all charts used in Chart Scan commentary were created
by using Genesis Financial Technologies' Trade Navigator (with permission).
Legal Notice and Copyright 2017 Disclaimer - Published by Trading Educators, Inc.
Chart Scan is a complimentary educational newsletter.
© by Trading Educators, Inc. Re-transmission or reproduction of any part of this material is strictly prohibited without prior written consent.

