
Edition 679 - June 16, 2017


Chart Scan with Commentary - Lesson from the Past
by Master Trader Joe Ross
Author, Trader, Trading Mentor, and Founder of Trading Educators, Inc.
Developer of Instant Income Guaranteed
It is extremely important to pay attention to what you see. In the past I’ve written about anticipatory trading, and in this issue of Chart Scan I want to show you more about what I mean. The Law of Charts indicates that there will be many orders grouped above or below a weekly high. Since it is the job of the market to fill orders, you can anticipate that either the high or the low will be violated with considerable momentum in order to break through what, on a lesser time frame, will appear to be so-called "support" or "resistance."
Take a close look at the Weekly Live Cattle chart below. The chart is a continuous chart. I rarely bother to adjust my continuous charts, so when the contract month changes you will often see a gap like the one just prior to the last four bars on the chart.
For what I want to show you here, those gaps will not be important. They were important in 2007 and they are important even today.
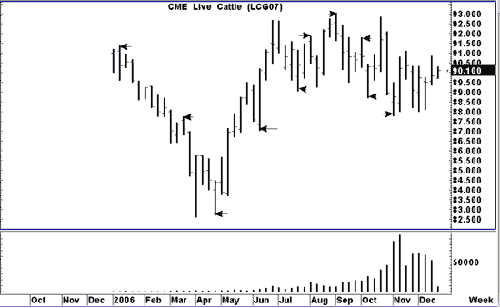
I’ve drawn an arrow next to each bar that is of interest. What do you see that is "special" about the price bars I’ve pointed out?
I may have missed a few, but be aware that most of the time when one of these special bars occurred, prices moved strongly the following week in a direction opposite of the way they had been previously going. What is most interesting about these bars is what happens on the following bar, the one representing the next week’s price action.
The bars I have pointed out can occur whenever a new local high or low has been made. By local, I mean recent, not necessarily an all-time high or low, or even a contract high or low. Now, have I revealed to you the holy grail of turning points in the market?
No! I have merely pointed out "reversal bars." These are bars that make a new high, and close lower than they opened when a market has been moving up, or make a new low, and close higher than they opened when a market has been moving down. Such bars create an immediate or even longer term pivot point in the market.
Interestingly, when these occur on a weekly chart in Live Cattle, the following week sees a continuation of the price action in the direction of the reversal. Better yet is to see one of these reversals take place in conjunction with a seasonal entry signal.
Now go back and check that chart again. If you can’t see a way to make money on reversal bar anticipation, you should close out your account and use your margin money to purchase a seeing eye dog. When the reversal fails to follow through the next week, there is seldom anything to worry about. You simply are not able to get into the market, or you sustain a small loss if you are not able to watch.
Here’s another way to use the simple fact of a reversal bar, and a way that I regularly do use them.
Whenever I am holding a position in a trade, I tighten my profit protecting stops as soon as a reversal bar occurs or is in the making. I either protect a portion of my profits, or I move my stop to within one tick of the extreme of the reversal bar.
If you want to do something profitable right now, pick up your charts and see what would have happened to you in any market, in any time frame, simply using the concept of the reversal bar to get into a trade and to get out of a trade. However, there is a serious caution in the lesser time frames. In a trading range, you will find that the price bars will reverse every other bar or every two bars. In most cases you will not be able to obtain a trade using the technique as an entry signal, because prices will not continue in the direction of the reversal.
The best results will be found when prices begin to trend. How will you know when prices are beginning to trend? You will cease getting alternating reversal bars.
You might also want to look at previous issues of the Monthly Report to see if any of the reversal bars took place in conjunction with a seasonal entry signal. I looked a little way back and found that the Live Cattle contract reversed during the week of 3-27-96. The report called for a seasonal short trade entry on that date. The report also called for a seasonal short trade on 4-11-96 in the June Live Cattle contract, and sure enough, that week there was a reversal.
But I don't want to have all the fun, so I'll leave a few for you to do as research. Don't tell me you just sit in front of your screen all day and watch the markets. Heavens! You really ought to do some research, shouldn’t you???
© by Joe Ross. Re-transmission or reproduction of any part of this material is strictly prohibited without the prior written consent of Trading Educators, Inc.
Trading Article - A Great Lesson
by Master Trader Joe Ross
Author, Trader, Trading Mentor, and Founder of Trading Educators, Inc.
Developer of Instant Income Guaranteed
From a longtime friend and student:
"I thought that I’d pass on something that you might want to share with your trading community. I spent way too long thinking that range bars and/or tick bars were my way to the holy grail and I would like to tell you what I realized and why I think I was wrong."
"First some background: I got started down that path, because wasn’t seeing formations on the x minute charts with what I thought was adequate frequency. This all got started a few years ago and I haven’t gone back to look at those charts. Maybe it was just a slow period or maybe I misinterpreted what I needed to see. Regardless, in my attempt to find a solution, I looked at range and tick charts. You’ll probably remember that I came to Austin and showed the range charts to you and you agreed that they showed trades clearly. Tick charts showed different things, but they make beautiful TLOC formations."
"The fatal flaw is time coupled with charting inaccuracies. The time aspect is that the TLOC formations that one sees on those charts are fantastic, but they are impossible to manage in live trading. The challenge is that the beautiful formation that you see on a historical chart can take 30 minutes or 30 seconds to form. Therefore, you either fall asleep before the formation completes itself or you don’t have time to get the order placed. In addition, the tick change shape completely sometimes when Trade Navigator corrects or recalculates the data. It doesn’t happen often, but enough to cause a problem: a formation would look one way during live trading and then after the nightly update, it would look similar, but different enough to change how I would have traded it."
"Another aspect is that when trading those charts, you must be "on" 100% of the time that you are trading, because you never know how long it will be before a tradeable formation happens. With time charts, you know that you have a few minutes while the bar completes, so you can unplug from time to time."
"I don’t know why I didn’t figure this out sooner."
"I went back to minutes and there’s plenty of action, so I’m back in business. The tick charts seem like they might be useful to see inside a reversal bar, but not on their own. You might have already put this somewhere in a blog post, but I wanted to pass on my experience."
Limit Offer!
Further your education with "The Law of Charts In-Depth" Recorded Webinar and use coupon code during checkout, Take50 to receive 50% off your purchase (offer is good until 6/19/2017).
Through this recorded webinar The Law of Charts, we will show how YOU how to win consistently in any market and in any time frame. What it takes to create charts that exactly fit your trading style and level of comfort. The content of this intensive, in-depth recorded webinar takes the "The Law of Charts" to the next step. You'll feel like your attending a private seminar with Joe Ross himself. Don't miss out, use coupon code during checkout, Take50 to receive 50% off!
© by Joe Ross. Re-transmission or reproduction of any part of this material is strictly prohibited without the prior written consent of Trading Educators, Inc.

Instant Income Guaranteed - TSO Trade
Philippe Gautier: Administration and New Developments
Developer: Joe Ross
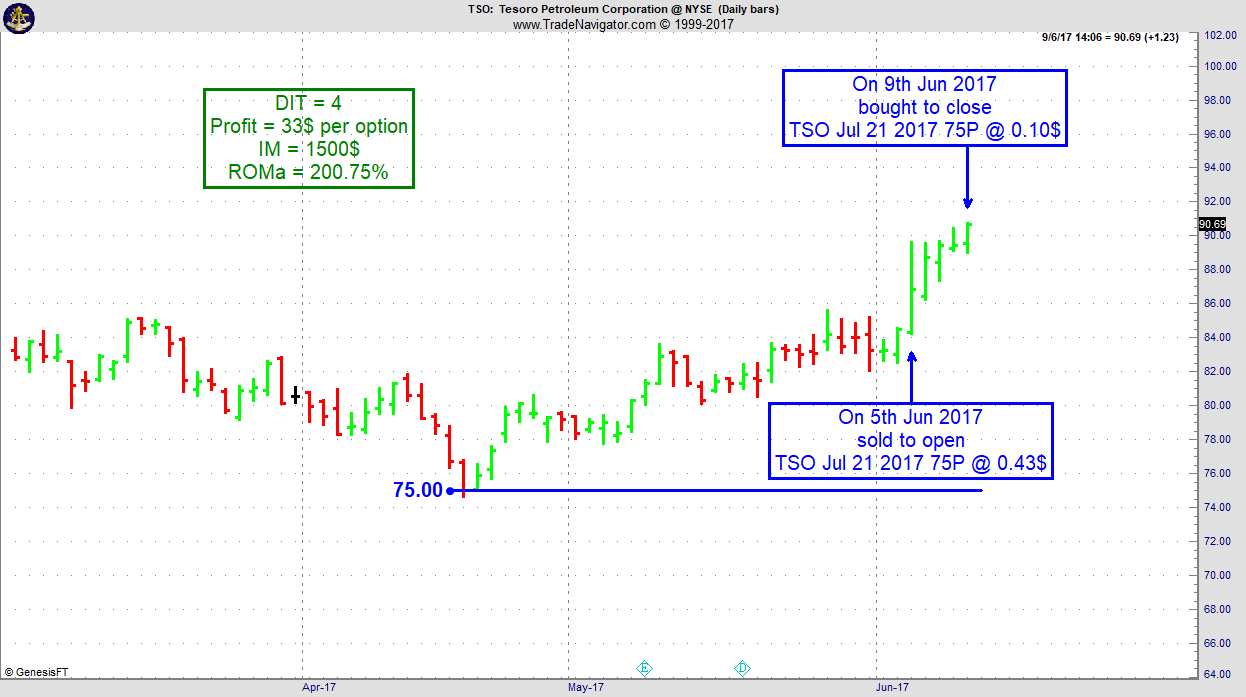
On 4th June 2017 we gave our IIG subscribers the following trade on Tesoro Petroleum Corporation (TSO). We decided to sell price insurance as follows:
- On 5th June 2017, we sold to open TSO Jul 21, 2017 75P @ $0.43, with 46 days until expiration and our short strike 11% below price action
- On 9th June 2017, we bought to close TSO Jul 21, 2017 75P @ $0.10, after only 4 days in the trade, for quick premium compounding.
Profit: $33 per option
Margin: $1,500
Return on Margin Annualized: 200.75%
We have also added new types of trades for our IIG daily guidance since 2016, "no loss" propositions with unlimited upside potential, still using other people's money to trade.
Philippe
Receive daily trade recommendations - we do the research for you!
Instant Income Guaranteed
♦ SIGN UP TODAY! THIS IS WORTH THE INVESTMENT ♦
© by Joe Ross and Philippe Gautier. Re-transmission or reproduction of any part of this material is strictly prohibited without the prior written consent of Trading Educators, Inc.

Blog Post - The Crush Spread
by Professional Trader Andy Jordan
Educator for Spreads, Options, Swing/Day Trading, and
Editor of Traders Notebook Complete and Traders Notebook Outrights
Find out what it means when trading a crush spread. Read more.
© by Andy Jordan. Re-transmission or reproduction of any part of this material is strictly prohibited without the prior written consent of Trading Educators, Inc.

by Professional Trader Marco Mayer
Educator for Forex and Futures, Systematic Trader, and
Creator of Ambush Trading Method, Ambush Signals, and AlgoStrats.com
In this Q&A series, Marco answers a follow-up question related to Pinbars, gives recommendations on Forex brokers and talks about why it's so hard to trade successfully on a 5-minute chart. Enjoy!
© by Marco Mayer. Re-transmission or reproduction of any part of this material is strictly prohibited without the prior written consent of Trading Educators, Inc.
Weekend Special for Father's Day!
Coupon Code: specialoffer
30% off when you purchase one or more:
Trading is a Business
Day Trading S&P 500
Stealth Trader
Life Index for Traders
Offer ends 6/19/2017
Check out our Blog!
To view previous published Chart Scan newsletters, please log in or click on "Join Us,"
shown above, to subscribe to our free "Members Only" section.
A WEALTH OF INFORMATION & EDUCATION:
Joe Ross-Trading Educators' popular free Chart Scan Newsletter has been published since 2004.
Note: Unless otherwise noted, all charts used in Chart Scan commentary were created
by using Genesis Financial Technologies' Trade Navigator (with permission).
Legal Notice and Copyright 2017 Disclaimer - Published by Trading Educators, Inc.
Chart Scan is a complimentary educational newsletter.
© by Trading Educators, Inc. Re-transmission or reproduction of any part of this material is strictly prohibited without prior written consent.

