
Edition 681 - June 30, 2017


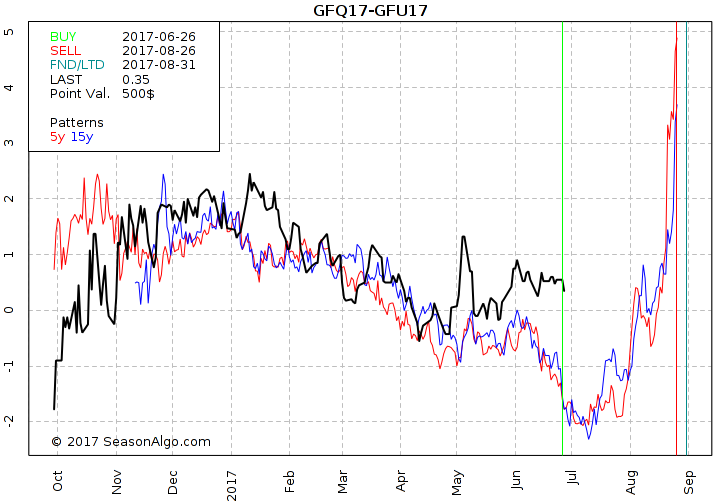
Chart Scan Trading Idea - Long GFQ17-GFU17 Feeder Cattle Spread
by Professional Trader Andy Jordan
Educator for Spreads, Options, Swing/Day Trading, and
Editor of Traders Notebook Complete and Traders Notebook Outrights
Today I am looking at a market that I don’t like to trade using outrights, but trade regularly with spreads. We are looking at the spread long August and short September Feeder Cattle with a seasonal time window between 06/26 and 08/26. Seasonality looks strong during that time and also the seasonal statistic looks promising. Because the time difference between both legs is very short (only 1 month) the spread is usually not very volatile and therefore the risk per spread contract at the lower range.
Do you want to see how we manage this trade and how to get detailed trading instructions every day? Please visit the following link: Yes, I want additional information!
© by Andy Jordan. Re-transmission or reproduction of any part of this material is strictly prohibited without the prior written consent of Trading Educators, Inc.
Andy Jordan's Blog Post - Some things that keep traders from "making it".
by Professional Trader Andy Jordan
Educator for Spreads, Options, Swing/Day Trading, and
Editor of Traders Notebook Complete and Traders Notebook Outrights
Find out the three psychological traits that prevent traders from becoming consistently successful. Read more.

Chart Scan with Commentary - Strategy
by Master Trader Joe Ross
Author, Trader, Trading Mentor, and Founder of Trading Educators, Inc.
Developer of Instant Income Guaranteed
I was going through my portfolio of past Chart Scans when I came across a chart with a question from one of our students. The chart and my answer to his question are below.
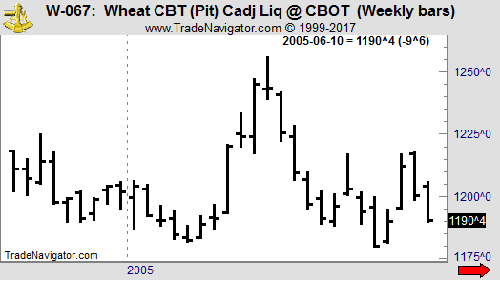
Hey Joe! Wheat seems set to go lower. It has formed a 1-2 with a potential #3 high formation at the end of a swing. If prices end up with a lower high and a lower low next week, the 1-2-3 formation will be complete. Friday’s Close ended the week near the low of the week after having spiked higher earlier in the week. In an odd sort of way, we have a “spike reversal.”
I agree. You could call that a sort of spike reversal, but it seems to me you have already miss the best chance to go short. I took the liberty of marking the chart you sent with the appropriate entry point.
In my opinion, entering 1 tick below of the “spike reversal” would have given you a more certain entry. Entering that way would have you already short based on a Traders Trick Entry.
© by Joe Ross. Re-transmission or reproduction of any part of this material is strictly prohibited without the prior written consent of Trading Educators, Inc.
Trading Article - Rationalizing
by Master Trader Joe Ross
Author, Trader, Trading Mentor, and Founder of Trading Educators, Inc.
Developer of Instant Income Guaranteed
One of the most important things to learn in this life is how we ourselves behave, not only when we are acting on our own, but when we are part of the crowd. And what few of us understand is how many of our important daily actions are not thought out in advance. We are all attempting to survive in what is basically a hostile environment. Many of our actions are in response to some sort of stimulus, whether someone else’s words, or actions, or something physical like our computer going down while in the midst of a trade. It may be painful to admit, but in much of human behavior we act first and then rationalize what we did later. While we all try to be logical, in most instances the rationalization comes after the fact, if it comes at all, and in general it is not at all close to explaining why we acted in the way we did. It is tough to be honest with ourselves, but honesty with self holds one of the secrets to success. This is nowhere more true than in trading.
© by Joe Ross. Re-transmission or reproduction of any part of this material is strictly prohibited without the prior written consent of Trading Educators, Inc.

Instant Income Guaranteed - WY Trade
Philippe Gautier: Administration and New Developments
Developer: Joe Ross
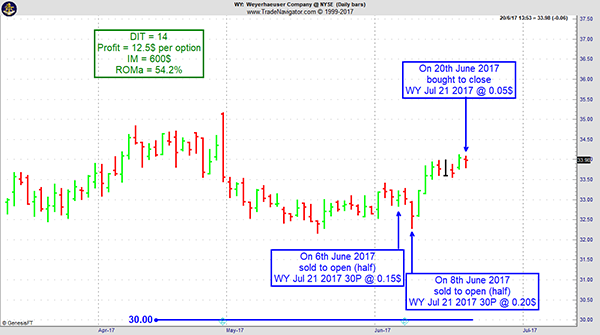
On 6th June 2017 we gave our IIG subscribers the following trade on Weyerhauser Company (WY), the stock being close to weekly and daily support zones. We decided to sell price insurance as follows:
- On 6th June 2017, we sold to open WY Jul 21 2017 30P @ $0.15, with 45 days until expiration and our short strike 10% below price action for half of our position.
- On a GTC order, on 8th jun 2017, we sold to open WY JuL 21, 2017 30p @ $0.20.
- On 20th June 2017, we bought to close WY Jul 21, 2017 30P @ $0.05, after only 14 days in the trade, for quick premium compounding.
Profit: $12.5 per option
Margin: $600
Return on Margin Annualized: 54.32%
We have also added new types of trades for our IIG daily guidance since 2016, "no loss" propositions with unlimited upside potential, still using other people's money to trade.
Philippe
Receive daily trade recommendations - we do the research for you!
Instant Income Guaranteed
♦ SIGN UP TODAY! THIS IS WORTH THE INVESTMENT ♦
© by Joe Ross and Philippe Gautier. Re-transmission or reproduction of any part of this material is strictly prohibited without the prior written consent of Trading Educators, Inc.
 Ambush Traders dominate the E-Mini S&P 500 again in June!
by Professional Trader Marco Mayer
Educator for Forex and Futures, Systematic Trader, and
Creator of Ambush Trading Method, Ambush Signals, and AlgoStrats.com
Ambush just won’t stop making new equity highs in many markets, including the E-Mini S&P 500 this year.
And so it just happened again yesterday when Ambush Traders totally dominated the E-Mini S&P 500. You have to see THIS trade for yourself:
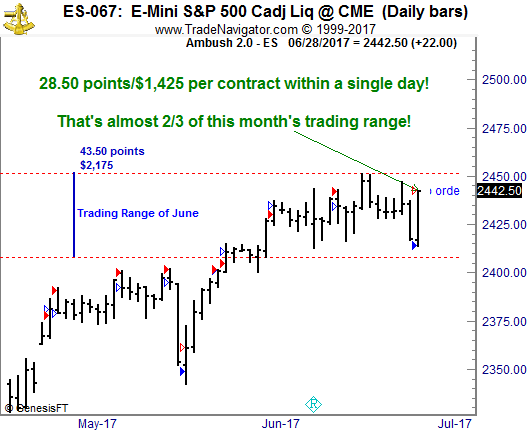
Let’s put this into perspective. June’s trading range (Difference between the highest high and the lowest low of the whole month so far) in the ES was about 43 1/2 points.
The Ambush trade you can see on the chart is 28 1/2 points. Yesterday, within just one day Ambush traders made almost 2/3 of the whole months trading range! That’s $1,425 with a single day trade!
That’s insane and honestly makes most day/swing/position traders who sit in front of their charts all day long getting in and out of the market look like fools.
Just think of most day traders sitting there all day long trying to scalp a point or two out of the E-Mini. Want to know what the result of their efforts is at the end of the trading day? Red eyes and hardly any trading profits due to the trading costs, a happy broker thankful for the commissions and if the high-frequency trading robots could laugh, they would!
Now compare that to the Ambush traders who just placed their orders at the market open and went to the beach! Relaxed eyes, hardly any commissions and about $1400 profits at the end of the day…
Want to become an Ambush Trader too?
Then simply sign up to Ambush Signals. It does all the work for you, allows you to customize what markets you want to see and has a position sizing tool implemented to automatically adjust the positions to your risk preferences.
Each day around 6:30 PM NY Time (yes, it's ready much earlier now than before) the Signals are available for you on the Dashboard. You can then place your orders and literally walk away until the markets close! Can you imagine a more comfortable way to day trade?
Happy Trading!
Marco
© by Marco Mayer. Re-transmission or reproduction of any part of this material is strictly prohibited without the prior written consent of Trading Educators, Inc.
Check out our Blog!
To view previous published Chart Scan newsletters, please log in or click on "Join Us,"
shown above, to subscribe to our free "Members Only" section.
A WEALTH OF INFORMATION & EDUCATION:
Joe Ross-Trading Educators' popular free Chart Scan Newsletter has been published since 2004.
Note: Unless otherwise noted, all charts used in Chart Scan commentary were created
by using Genesis Financial Technologies' Trade Navigator (with permission).
Legal Notice and Copyright 2017 Disclaimer - Published by Trading Educators, Inc.
Chart Scan is a complimentary educational newsletter.
© by Trading Educators, Inc. Re-transmission or reproduction of any part of this material is strictly prohibited without prior written consent.

