
Edition 684 - July 21, 2017


Chart Scan with Commentary - Mutual Funds
by Master Trader Joe Ross
Author, Trader, Trading Mentor, and Founder of Trading Educators, Inc.
Developer of Instant Income Guaranteed
We received a question asking whether or not the Law of Charts works with Mutual funds. The answer is yes it does but the concept is more easily seen on a weekly chart because daily charts show only the Closing price for mutual funds.
The chart shown is Oppenheimer Gold and Special Minerals Class Y mutual fund, which rises when the with the price of gold and other minerals, and falls and falls when the price of gold and other minerals fall. Please note: Some mutual funds are inverse funds where shares in the fund rise when prices fall, and fall when prices rise. The chart shows the entry on a breakout from a Trading Range on exactly the 29th weekly bar. The breakout is that long bar you see as prices break through the Trading Range. The Law of Charts states that breakouts from consolidations are most likely to occur on bars 21-29.
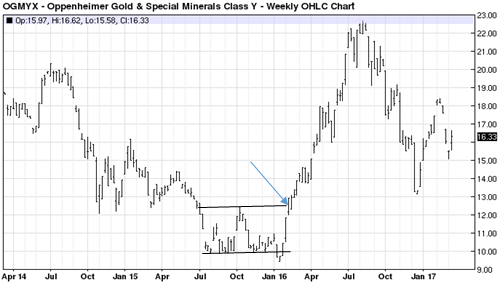
The arrow shows a potential entry one tick above the high of the range. Notice that share prices have recently formed a 1-2-3 low.
© by Joe Ross. Re-transmission or reproduction of any part of this material is strictly prohibited without the prior written consent of Trading Educators, Inc.
Trading Article - The Nature of the Trading Business
by Master Trader Joe Ross
Author, Trader, Trading Mentor, and Founder of Trading Educators, Inc.
Developer of Instant Income Guaranteed
Consider the following: As a trader you are in a business. Your strongest opponent has plenty of capital. He follows a program and he does it without emotion. He is totally aware of the fact that no one knows where the next tick will fall. Whereas he usually has good insights regarding the major forces that drive the market, he does not fool himself into thinking he can explain the vagrancies of price movement intraday or even from day to day. He knows that no one truly can. The successful trader has learned his lessons by actually trading. This is a business driven by fear, greed, and selfishness, and very few worthwhile pointers are given out by the industry, other traders, or the myriad of so-called trading gurus who plague the pages of trading magazines and pages of their websites. The most valuable information is closely guarded and not often put in books or on web pages. Learning about trading is a ‘forever’ experience. As the markets change and as we adjust to them, we learn. The learning is ongoing. It stops only when you no longer trade. During the time we trade we can always improve. Trading is a great business for those who master it, and those who master it are traders who have mastered themselves.
© by Joe Ross. Re-transmission or reproduction of any part of this material is strictly prohibited without the prior written consent of Trading Educators, Inc.

Instant Income Guaranteed - FITB Trade
Philippe Gautier: Administration and New Developments
Developer: Joe Ross
On 20th June 2017 we gave our IIG subscribers the following trade on Fifth Third Bancorp (FITB). We sold price insurance as follows:
- On 21st June 2017, we sold to open FITB Jul 21 2017 23P @ $0.15, with 30 days until expiration and our short strike 10% below price action.
- On 10th July 2017, we bought to close FITB Jul 21 2017 23P @ $0.05, after 19 days in the trade.
Profit: $10 per option
Margin: $460
Return on Margin Annualized: 41.76%
With implied volatility extremely low, we still managed to sell price insurance 10% below price action and below a major support level.
We have also added new types of trades for our IIG daily guidance since 2016, "no loss" propositions with unlimited upside potential, still using other people's money to trade.
Philippe

Receive daily trade recommendations - we do the research for you!
Instant Income Guaranteed
♦ SIGN UP TODAY! THIS IS WORTH THE INVESTMENT ♦
© by Joe Ross and Philippe Gautier. Re-transmission or reproduction of any part of this material is strictly prohibited without the prior written consent of Trading Educators, Inc.

Trading Idea - Soybean Oil (CBOT on Globex)
by Professional Trader Andy Jordan
Educator for Spreads, Options, Swing/Day Trading, and
Editor of Traders Notebook Complete and Traders Notebook Outrights
This week, we're looking at short ZLZ17 – ZLH18: short December 2017 and long March 2018 Soybean Oil (CBOT on Globex).

Today we consider a Soybean Oil calendar spread: short December 2017 and long March 2018 Soybean Oil (chart above). The spread has been trading sideways for a long time making slightly higher lows with highs around -0.2. For an entry it either needs to break to the down-side or move back up to the upper side of the range.
Also the seasonal statistic looks promissing with 14 winners during the last 15 years and a max. daily drawdown of only $192 in 2011.
Do you want to see how we manage this trade and how to get detailed trading instructions every day?
Traders Notebook Complete
Please visit the following link:
Yes, I would like additional information!
© by Andy Jordan. Re-transmission or reproduction of any part of this material is strictly prohibited without the prior written consent of Trading Educators, Inc.

Trading Article - Trading Related Questions
by Professional Trader Marco Mayer
Educator for Forex and Futures, Systematic Trader, and
Creator of Ambush Trading Method, Ambush Signals, and AlgoStrats.com
I would like to share a video that provides answers to trading related questions. Feel free to This email address is being protected from spambots. You need JavaScript enabled to view it. with any questions or whatever is on your mind about trading.
Happy Trading,
Marco
© by Marco Mayer. Re-transmission or reproduction of any part of this material is strictly prohibited without the prior written consent of Trading Educators, Inc.
Check out our Blog!
To view previous published Chart Scan newsletters, please log in or click on "Join Us,"
shown above, to subscribe to our free "Members Only" section.
A WEALTH OF INFORMATION & EDUCATION:
Joe Ross-Trading Educators' popular free Chart Scan Newsletter has been published since 2004.
Note: Unless otherwise noted, all charts used in Chart Scan commentary were created
by using Genesis Financial Technologies' Trade Navigator (with permission).
Legal Notice and Copyright 2017 Disclaimer - Published by Trading Educators, Inc.
Chart Scan is a complimentary educational newsletter.
© by Trading Educators, Inc. Re-transmission or reproduction of any part of this material is strictly prohibited without prior written consent.

