
Edition 686 - August 4, 2017


Chart Scan with Commentary - Cluster Breakouts
by Master Trader Joe Ross
Author, Trader, Trading Mentor, and Founder of Trading Educators, Inc.
Developer of Instant Income Guaranteed
In my book "Day Trading," I presented an idea for trading cluster breakouts in EUR/USD. This morning I was wondering if there were good cluster breakouts in other markets. I really needed to do some trading. When I go for a while without trading, the desire to do so becomes a persistent itch.
Lately, due to other commitments and activities, my trading time has been sparse and limited to experimentation with a stock trading idea which I continue to work on. This morning I took a look at Treasury Bonds to see if cluster breakouts would work well there. The chart shows what I discovered.
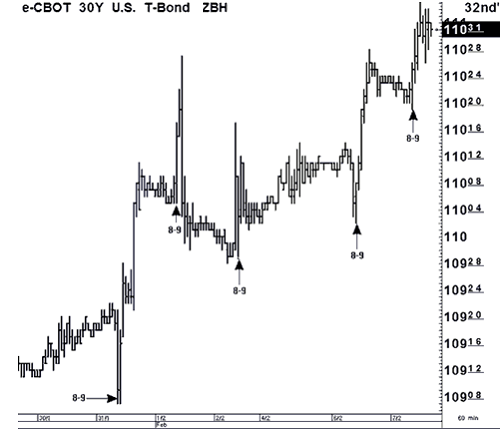
By cluster I refer to groups of rather small bars, more or less moving sideways. The idea is to wrap an envelope around the cluster and then trade a breakout of the envelope. I have marked the bars where the breakout occurred, and please note that these 60-minute bars all begin at the start of an hour, e.g., 8 AM to 9 AM.
It seems that in most cases, the move begins with the 8 AM bar or is completed by the 8 AM bar. Viewing from right to left, we see:
1. A violation of the cluster centered around 110^24 begins with the 8 AM bar and completes with the 9 AM bar.
2. The cluster centered around 110^11 is violated first by the 8 AM bar and later by the 11 AM bar.
3. The cluster centered around 110^02 is violated by the 8 AM bar.
4. The cluster centered around 110^07 is violated by the 8 AM bar.
© by Joe Ross. Re-transmission or reproduction of any part of this material is strictly prohibited without the prior written consent of Trading Educators, Inc.
Trading Article - Should you trade only one market?
by Master Trader Joe Ross
Author, Trader, Trading Mentor, and Founder of Trading Educators, Inc.
Developer of Instant Income Guaranteed
Restricting your trading exclusively to one market may not be your best choice. Here are some reasons why:
You must not trade under pressure. Trading involves being eclectic and choosing only the best, most clear-cut trades in liquid, not overly volatile markets.
It is sheer folly to trade feeling that you have to make a certain amount of money each day, or that you have to make up for a previous day. Each day is its own day, and must be viewed as such.
Trading is not a job. If you want a job, go out and find one. Trading is to be done leisurely, with plenty of time in-between during which you do not trade at all. You cannot possibly be at your best all of the time while sitting and watching a screen. The pros typically trade a short period of the day, usually around the open, and then again at the close. That's why they last as long as they do. For those who stay in the market because they act as market makers, they trade their own money only when they can take advantage of you for a few ticks at various times during the day. Otherwise, they stand aside, waiting to fill orders coming in from the outside, which is what they feel they have to do.
There can be benefit in position trading various markets using the weekly chart and entering via the daily chart. If you are going to be a trader, you are going to have to learn to be an all-around trader, always going where there is money to be made. If you are going to stick with only one market, then you are going to have to patiently sit out those times and periods when it is doing nothing.
This is not the first time in my life that I've been unable to easily day trade in a particular market. I have seen markets that were virtually not tradable for more than a year. At some point they once again become tradable. During those periods in which a market became not tradable, if I wanted to day trade I had to look elsewhere. There have been other periods during which I could not trade at all. I will repeat a story here that I've told at many seminars. There was a time in the early 1970s (yes, those were the olden days before there was day trading), when I was able to make only one trade in an entire year. It came in November, and it yielded the only money I made that year. I was able to trade the following year, and then again the markets became very difficult to trade, and many traders simply disappeared from the markets and went home broke. Such is the life of a trader. That is why I had to learn to trade what I could, where I could, and when I could. Trading in itself can be seasonal. There are dry spells from time to time. What saved my neck in those days of lean opportunity? Trading spreads on futures contracts.
© by Joe Ross. Re-transmission or reproduction of any part of this material is strictly prohibited without the prior written consent of Trading Educators, Inc.

Instant Income Guaranteed - XME Trade
Philippe Gautier: Administration and New Developments
Developer: Joe Ross
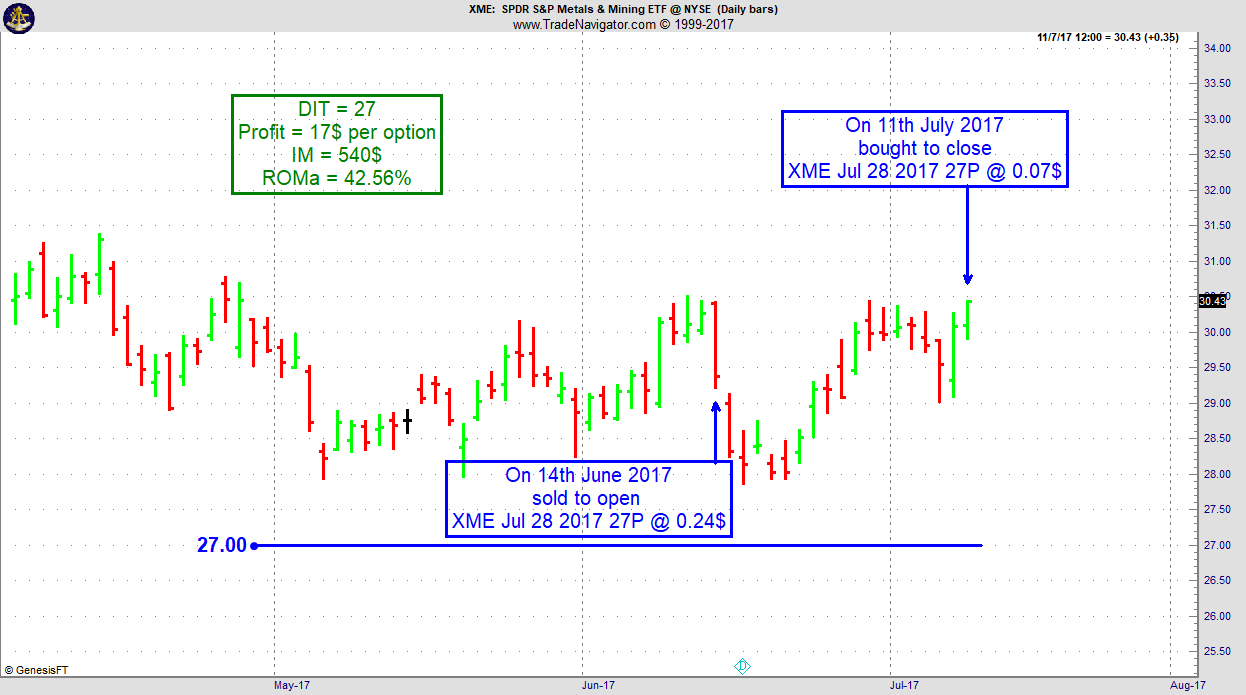
On 13th June 2017 we gave our IIG subscribers the following trade on SPDR S&P Metals & Mining ETF (XME). We sold price insurance as follows:
- On 14th June 2017, we sold to open XME Jul 28 2017 27P @ $0.24, with 44 days until expiration and our short strike 11% below price action.
- On 11th July 2017, we bought to close XME Jul 28 2017 27P @ $0.07, after 27 days in the trade.
Profit: $17 per option
Margin: $540
Return on Margin Annualized: 42.56%
Not all underlying stocks or ETFs go straight up after our entry. But as long as prices remain well above a well chosen short strike, the trade remains pretty safe and boring, like most of our trades.
We have also added new types of trades for our IIG daily guidance since 2016, "no loss" propositions with unlimited upside potential, still using other people's money to trade.
Philippe
Receive daily trade recommendations - we do the research for you!
Instant Income Guaranteed
♦ SIGN UP TODAY! THIS IS WORTH THE INVESTMENT ♦
© by Joe Ross and Philippe Gautier. Re-transmission or reproduction of any part of this material is strictly prohibited without the prior written consent of Trading Educators, Inc.

Trading Idea - Long October Sugar #11
by Professional Trader Andy Jordan
Educator for Spreads, Options, Swing/Day Trading, and
Editor of Traders Notebook Complete and Traders Notebook Outrights
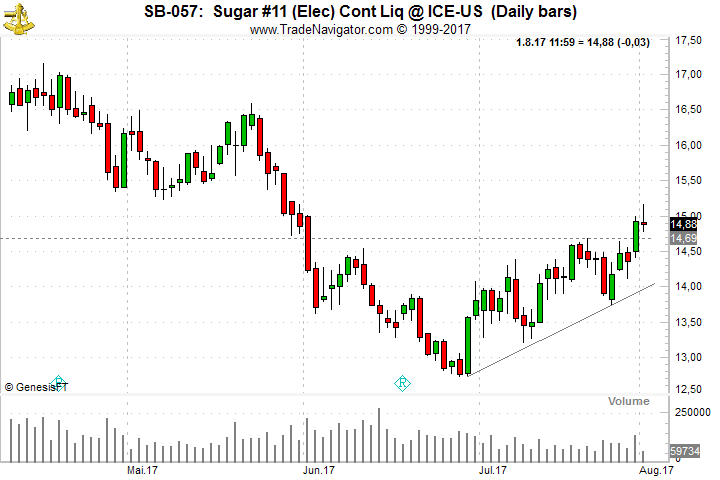
After a long down-move in Sugar from October 2016 until end of June, Sugar might be ready to push higher during the next few weeks or even months. On the daily chart below we can see, that we have entered an up-trend and after the break above 14.69 on Monday we might even move much higher at least up to 16.50.
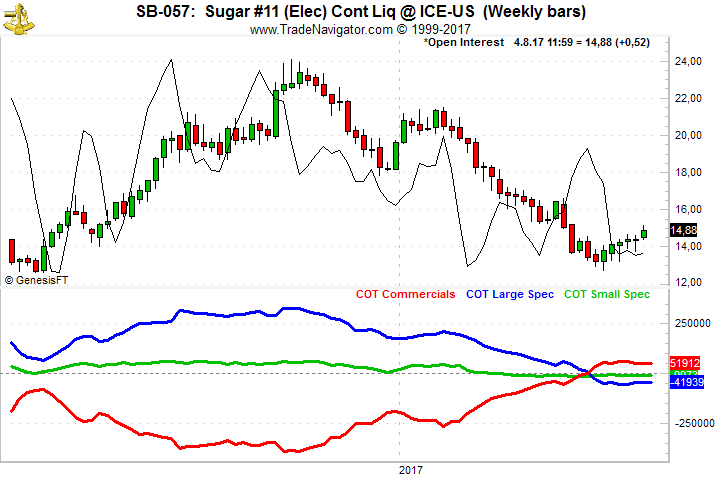
The main factor why we might see higher prices in Sugar comes from the net long positions of the Commercials which is the highest reading back to 1983.
Traders might want to put on a position on the re-test of the 14.70 level or simply put on a position at the current level.
Do you want to see how we manage this trade and how to get detailed trading instructions every day?
Traders Notebook Complete
Please visit the following link:
Yes, I would like additional information!
© by Andy Jordan. Re-transmission or reproduction of any part of this material is strictly prohibited without the prior written consent of Trading Educators, Inc.

by Professional Trader Marco Mayer
Educator for Forex and Futures, Systematic Trader, and
Creator of Ambush Trading Method, Ambush Signals, and AlgoStrats.com
In this video, I talked about stop-losses in general, ways to decide on your stops that don't make much sense and other pitfalls like using breakeven-stops. Finally let me give you some insights on my own systematic approach regarding exits and how I like to decide where to put a stop-loss.
Feel free to This email address is being protected from spambots. You need JavaScript enabled to view it. with any questions or whatever is on your mind about trading.
Happy Trading,
Marco
© by Marco Mayer. Re-transmission or reproduction of any part of this material is strictly prohibited without the prior written consent of Trading Educators, Inc.
Check out our Blog!
To view previous published Chart Scan newsletters, please log in or click on "Join Us,"
shown above, to subscribe to our free "Members Only" section.
A WEALTH OF INFORMATION & EDUCATION:
Joe Ross-Trading Educators' popular free Chart Scan Newsletter has been published since 2004.
Note: Unless otherwise noted, all charts used in Chart Scan commentary were created
by using Genesis Financial Technologies' Trade Navigator (with permission).
Legal Notice and Copyright 2017 Disclaimer - Published by Trading Educators, Inc.
Chart Scan is a complimentary educational newsletter.
© by Trading Educators, Inc. Re-transmission or reproduction of any part of this material is strictly prohibited without prior written consent.

