Edition 687 - August 12, 2017


Chart Scan with Commentary - TLOC (The Law of Charts)
by Master Trader Joe Ross
Author, Trader, Trading Mentor, and Founder of Trading Educators, Inc.
Developer of Instant Income Guaranteed
For many years I have maintained that there is a law that governs the formation of charts. I call it The Law of Charts.
I don't know why charts behave the way they do, but I do know that if the underlying data consists of highs and lows, you will see 1-2-3s, areas of consolidation, and Ross hooks™.
My first understanding of the law came when I saw the formations with which so many are now familiar. To my thinking, the patterns we see on a price chart are caused by the action and reaction of humans to their perception of value. However, it took me some time to realize that what differed among charts was the impetus that caused them to form The Law of Charts patterns.
I first became suspicious of this when I could see that the line charts created by price spreads formed the same patterns as those formed on a bar chart. Spreads consisted of connecting the values at which the spreads closed from one day to the next. There was no high or low each day as with a bar or candlestick chart.
Then I came across a set of data for gas meter readings in Southern California. They, too, formed the patterns of The Law of Charts. It was then I realized that I was indeed looking at a law. Only the impetus was different. The law was a constant. The impetus in this latter set of data was usage. The usage of natural gas varied, thus giving it highs and lows.
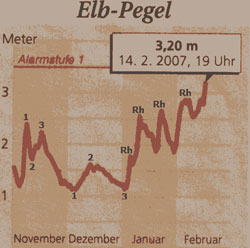
A few years ago a trader in Germany sent me the chart you see below. It is a chart depicting water levels in the Elbe River. As you can see, The Law of Charts really does exist, and it really is a law - not a theory or a system as people often refer to it when they ask me about it. You do not trade The Law of Charts, you find a way to implement the fact it exists. The Traders Trick is one of many implementations that I have figured out.

© by Joe Ross. Re-transmission or reproduction of any part of this material is strictly prohibited without the prior written consent of Trading Educators, Inc.

Trading Article - Sensing Market Condition
by Master Trader Joe Ross
Author, Trader, Trading Mentor, and Founder of Trading Educators, Inc.
Developer of Instant Income Guaranteed
A market may be nervous when it goes into consolidation. It may be nervous when you see lots of dojis and flip-flopping – opening high one day and closing low, and then opening low and closing high the next day. A market may be nervous when it is backing and filling – opening on gaps and then filling in those gaps, or trading way up or way down, only to finish back where it started, or at an extreme opposite to the way it traded most of the day.
A market is illiquid when the tick volume is low for any given period, and this continues over a space of many periods. To know what normal tick volume is, you must study what it was during periods when you are able to trade normally with decent fills. It is illiquid when both open interest and daily volume are low. It is illiquid when the tick size is erratic, and you see many large ticks mixed in with smaller ticks.
A market is too volatile when it becomes a fast market. It is too volatile when slippage on fills is excessive regardless of whether this occurs when the tick size is excessive, the market is illiquid, or the market is frequently under fast market conditions. A market is too volatile when it shoots way up to an extreme high relative to where prices have been on a report or news item, and then right back down again to a relatively extreme low. The opposite is also true when the market shoots down first and suddenly reverses and moves up, with both moves to relative extremes.
All of the above have been true from time to time in all markets, almost all the time in some markets. It is best to trade with caution at those times or perhaps to not trade at all.
© by Joe Ross. Re-transmission or reproduction of any part of this material is strictly prohibited without the prior written consent of Trading Educators, Inc.

Instant Income Guaranteed - EXP Trade
Philippe Gautier: Administration and New Developments
Developer: Joe Ross
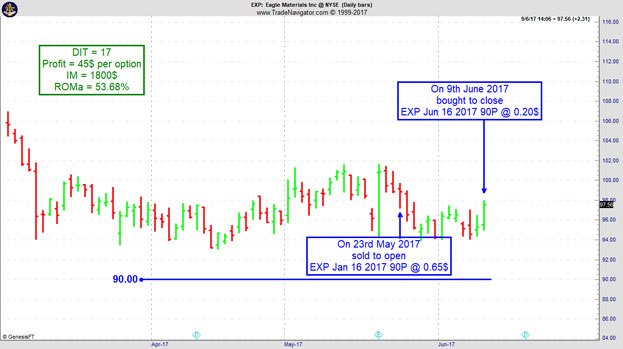
On 18th May 2017 we gave our IIG subscribers the following trade on Eagle Materials Inc (EXP). We sold price insurance as follows on a GTC order as we could not get filled initially at our minimum price:
- On 23rd May 2017, we sold to open EXP Jun 16, 2017 90P @ $0.65, with 23 days until expiration.
- On 9th Jun 2017, we bought to close EXP Jun 16 2017, 90P @ $0.20, after 17 days in the trade for quick premium compounding.
Profit: $45 per option
Margin: $1,800
Return on Margin Annualized: 53.68%
With implied volatility being so low, we often have to wait for a few days or more to get filled at our minimum price. We prefer to miss a trade rather than selling poor premium levels.
We have also added new types of trades for our IIG daily guidance since 2016, "no loss" propositions with unlimited upside potential, still using other people's money to trade.
Philippe

Receive daily trade recommendations - we do the research for you!
Instant Income Guaranteed
♦ SIGN UP TODAY! THIS IS WORTH THE INVESTMENT ♦
© by Joe Ross and Philippe Gautier. Re-transmission or reproduction of any part of this material is strictly prohibited without the prior written consent of Trading Educators, Inc.
Trading Article - Including Failure in Trading
by Professional Trader Andy Jordan
Educator for Spreads, Options, Swing/Day Trading, and
Editor of Traders Notebook Complete and Traders Notebook Outrights
Because of a random luck factor, it is possible for failure to raise its head at any moment. Consequently, we can’t sidestep or ignore it; we have to find a place for it in our overall system.
This is more profound than it seems. Any trader must be flexible enough to adapt not only to changing events, but also to the vagaries of chance, and the harmony continued in spite of it.
Trading, as it unfolds from the traders perspective, is experienced as an alternating of "in harmony" and "out of harmony" – things going right, things going wrong. These must be bracketed together and contained underneath the larger harmony.
Adapting to random surprise wrenches thrown into your plans, while still remaining in harmony, is the challenge of trading.
Including failure in our trading strategy also has another quality. It brings about humility. Factoring it into our trading means realizing that while we may win 50 percent of the time, we will also lose the other 50 percent – working with this fact rather then fighting it.
Defeats in trading are not really defeats, anyway — they are more like trial balloons we keep sending up, knowing in advance that a certain number of them are going to get shot down. Therefore, trading is really a process of two steps forward and one step back. The one step back part will always seem like a defeat, will always feel like a defeat, but is not a defeat – simply part of the process.
© by Andy Jordan. Re-transmission or reproduction of any part of this material is strictly prohibited without the prior written consent of Trading Educators, Inc.

Trading Video - Ambush Signals
by Professional Trader Marco Mayer
Educator for Forex and Futures, Systematic Trader, and
Creator of Ambush Trading Method, Ambush Signals, and AlgoStrats.com
In this video, I explain a service called Ambush Signals. What is the system, the idea behind it and how Ambush Signals makes trading Ambush so much easier!
Feel free to This email address is being protected from spambots. You need JavaScript enabled to view it. with any questions or whatever is on your mind about trading.
Happy Trading,
Marco
© by Marco Mayer. Re-transmission or reproduction of any part of this material is strictly prohibited without the prior written consent of Trading Educators, Inc.
Check out our Blog!
To view previous published Chart Scan newsletters, please log in or click on "Join Us,"
shown above, to subscribe to our free "Members Only" section.
A WEALTH OF INFORMATION & EDUCATION:
Joe Ross-Trading Educators' popular free Chart Scan Newsletter has been published since 2004.
Note: Unless otherwise noted, all charts used in Chart Scan commentary were created
by using Genesis Financial Technologies' Trade Navigator (with permission).
Legal Notice and Copyright 2017 Disclaimer - Published by Trading Educators, Inc.
Chart Scan is a complimentary educational newsletter.
© by Trading Educators, Inc. Re-transmission or reproduction of any part of this material is strictly prohibited without prior written consent.


