Edition 692 - September 15, 2017


AMBUSH TRADING METHOD - ALL TIME EQUITY HIGHS!
by Professional Trader Marco Mayer
Educator for Forex and Futures, Systematic Trader, and
Creator of Ambush Trading Method, Ambush Signals, and AlgoStrats.com
Ambush made new all time equity highs having its best month EVER!
You may remember earlier this year in my previous report when I announced that Ambush had made new all time equity highs. Well, guess what? It didn’t stop there and it literally exploded much higher while having its best trading month ever!
Looking at the whole futures systematic trading industry, 2017 has been an exceptionally difficult year. Of all the systems that I’m following, Ambush is literally the only one that kept performing as usual this year.
Ambush has been around for almost 10 years now but as markets tend to change, I do review Ambush once a year to see if any changes are necessary to adapt to changing market conditions. The last time any significant changes have been required was in July 2015. As you can see on the following chart Ambush kept on performing as expected in live trading.
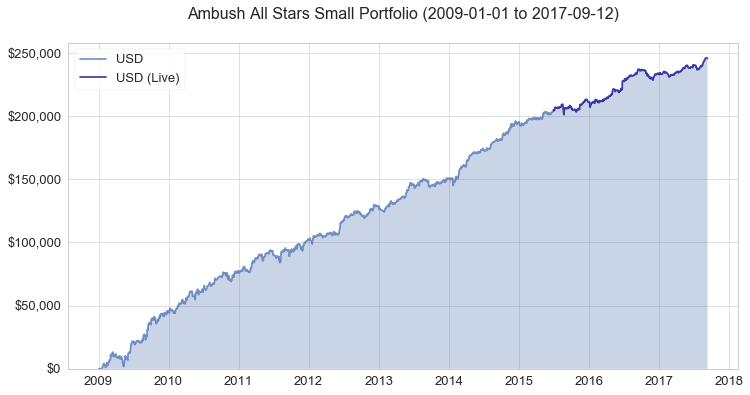
Funny enough it just beat its pre-live backtest and as of August has been its best trading month EVER! This really says something about a trading method if it beats its historical backtest performance in live-trading doesn’t it?
Let’s look at the Ambush All Stars Portfolio for Small Accounts (you can find out more about the sample portfolios on the Performance Page) in August.
Looking at all the August trades in detail, we can see that the profits have been nicely distributed across the different markets.
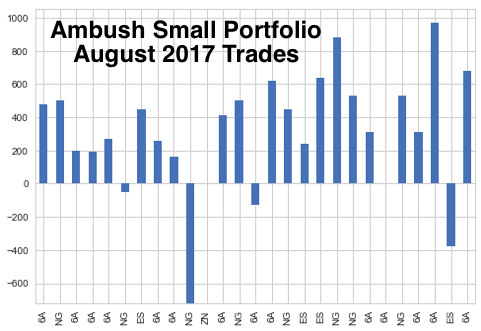
In total the portfolio gained more than $8,000 in August, with 85% winning trades while having made over 1.4 times more profits on winning trades than on losing trades. Yes, really and yes this is crazy!
Now obviously "crazy" happens and it’s fun to talk about it but of course you want to see more than just a chart showing you what happened last month right? How did the Australian Dollar perform over the years? What are the different portfolios made of? How’s your favorite market doing with Ambush?
To find out about all of the above, simply go to the Performance Page where you’ll find all the stats you need.
Join us and become an Ambush Trader!
The easiest way to follow Ambush is, of course, Ambush Signals. It does all the work for you, allows you to customize what markets you want to see and has a position sizing tool implemented to automatically adjust the positions to your risk preferences.
Each day around 6:30 pm NY Time the Signals are available for you on the Dashboard. You can then place your orders and literally walk away until the next market close!
If you following any System it can be tough in the beginning. It simply needs time to build the confidence needed to make it through drawdowns. What if you’re unlucky and don’t catch Ambush’s best trading month ever when you start trading?
I want you to succeed trading Ambush, so here’s something for you that will strongly increase your odds of success and allow you to easily gain the confidence you’ll need to become a profitable Ambush trader.
I offer you 6 months of Ambush Signals for just $499. That’s a saving of $215, giving you almost two months of Ambush Signals for free. As we usually only offer monthly or 3-months subscriptions, this is a one-time offer!
These 6 months will allow you to get to know Ambush Signals without too much stress or pressure and to follow it for a long enough time period that it simply won’t that much if you’re lucky and start on Ambush’s best trading month ever or not.
Don’t miss out on this and get your 6 months of Ambush Signals for $499 today, click here!
Ambush eBook
Now if you’d prefer to rather generate the signals on your own and want to know the exact trading rules of Ambush, we also have a special offer for the Ambush eBook:
Coupon Code:
- Ambush eBook: use "ambush300" to get the Ambush eBook $300 off, for $999 instead of $1299.
Now if you’re thinking that getting a trading method that’s been doing so well for such a nice price is too good to be true, then you’re right. As you might remember we’ve already significantly raised the price of eBook last year. I can’t tell you much more at this point but this might be your last chance to get into Ambush Signals or to buy the Ambush eBook at such a low price.
All Coupon codes are valid only until Wednesday, September 20th. Hurry up and don’t miss out on this rare opportunity!
Happy Trading!
Marco
© by Marco Mayer. Re-transmission or reproduction of any part of this material is strictly prohibited without the prior written consent of Trading Educators, Inc.
Trading Article - Drawdowns
by Professional Trader Andy Jordan
Educator for Spreads, Options, Swing/Day Trading, and
Editor of Traders Notebook Complete and Traders Notebook Outrights
Today I want to show you something that most educators will not talk about: Drawdowns
Most of the time as a trader, you will find yourself in periods of draw downs. This means, most of the time after reaching a new equity high you will be under water. That is something most newbies underestimate and one of the main reasons traders fail because they get the idea they will be up most of the time. Inexperienced traders don’t come up with this idea by themselves, of course. It is mainly the trading education industries that tells everyone how easy and how much fun trading is.
The calculation shown below comes from Robert Frey, a math guy, and as you can see, traders might be a significant time in draw down periods.
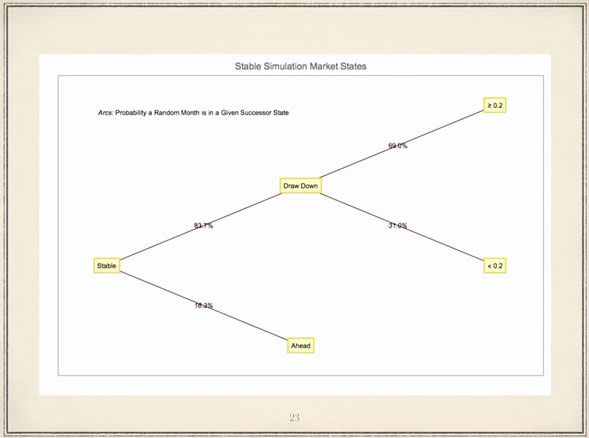
“Robert FREY - 180 years of Market Drawdowns” has a video on YouTube that is worth checking out.
Happy trading,
Andy
© by Andy Jordan. Re-transmission or reproduction of any part of this material is strictly prohibited without the prior written consent of Trading Educators, Inc.

Chart Scan with Commentary - Weekly Chart Trading
by Master Trader Joe Ross
Author, Trader, Trading Mentor, and Founder of Trading Educators, Inc.
Developer of Instant Income Guaranteed
Are you missing out?
Sometimes we are so busy looking at the forest that we miss seeing the trees. If you are a day trader it could be you are no longer seeing the trees that are on the weekly chart. This past week I've been looking at weekly charts. What prompted me was that a friend of mine, who has been trading strictly from the weekly charts, wrote to tell me his account is up five-fold. Is yours?
T-Note futures have always been difficult for me to trade as a day trader. So I decided to look at "trees" in the T-Note futures first. I was astonished at what I saw. There were 1-2-3s, Ross Hooks and Traders Tricks.
Yeah! But who wants to trade the weekly chart? What I should have been asking is why haven't I been trading the weekly charts? Trading the weekly charts doesn't mean that you have to sit and watch the market all week long hoping for a trade. With today's automatic trading platforms, there's not a lot of watching to do. Besides, if you are willing to take some money off the table quickly, trades from the weekly chart can be ideal. The moves on a weekly chart, even when small, are typically much greater than you'll get from the same move on a daily or intra-day chart.
Take a look!
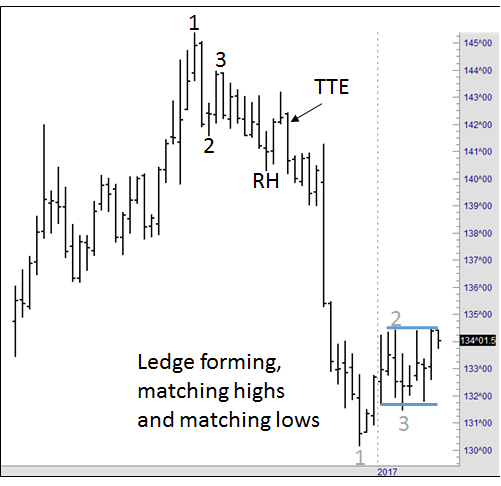
The arrow points to a Traders Trick Entry. I would have made a nice bundle on that one. But where was I? Burning up my eyeballs looking for an intraday trade in four other markets.
Several weeks later, prices bottomed out and formed a 1-2-3 low, which has turned into a possible ledge trade. Please notice that when notes move a full point, it is worth $1,000. That means if I had entered at 142^00 and exited at 132^00, I would have made $10,000. As Fagin said the movie “Oliver,” I think I’d better think it out again.
Are you getting my message?
© by Joe Ross. Re-transmission or reproduction of any part of this material is strictly prohibited without the prior written consent of Trading Educators, Inc.

Trading Article - Hey Joe! Any suggestions for the kind of information a new trader should collect and maintain?
by Master Trader Joe Ross
Author, Trader, Trading Mentor, and Founder of Trading Educators, Inc.
Developer of Instant Income Guaranteed
New traders must keep a diary of trades with the following information:
- Why trades were initiated
- How stops were managed
- Where and why they were moved
- Why the trade was exited
Personal observations. This trade check analysis will spot any breakdowns in discipline or methodology, and focus the trader on why actions are being taken. What is the purpose of this diary? To help you find your true self. To be a successful trader, you need to find out who you really are.
Traders should also keep a chart of their equity. This can be set up in a spread sheet and graphed. Every win should be added and every loss subtracted. After 20 trades, begin to maintain a moving average of the equity. If your trading equity falls below the moving average, stop trading. Paper trade until the equity curve rises above the moving average, at which point you may trade again using real money.
This little exercise will assist you in keeping your losses small and optimizing your wins. You will trade away your bad periods on paper, or a simulator, while your winning periods will be traded with real money.
We have developed a wonderful tool to help you. It’s called “The Life Index for Traders” and it comes with the “Equity Evaluator.”
© by Joe Ross. Re-transmission or reproduction of any part of this material is strictly prohibited without the prior written consent of Trading Educators, Inc.

Instant Income Guaranteed - TRN Trade
Philippe Gautier: Administration and New Developments
Developer: Joe Ross
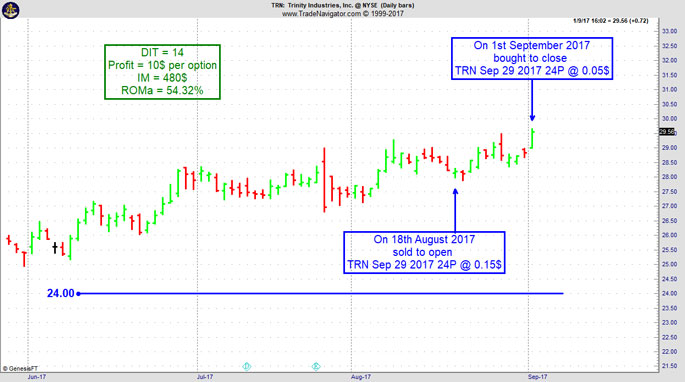
On 14th Aug 2017 we gave our IIG subscribers the following trade on Trinity Industries (TRN). We sold price insurance as follows on a GTC order as we could not get filled initially at our minimum price:
- On 18th August 2017, we sold to open TRN Sep 29, 2017 24P @ $0.15, with 41 days until expiration.
- On 1st September 2017, we bought to close TRN Sep 29 2017 24P @ $0.05, after 14 days in the trade for quick premium compounding.
Profit: $10 per option
Margin: $480
Return on Margin Annualized: 54.32%
By patiently waiting for a retracement to get our minimum fill price, we could exit the trade fairly quickly.
We have also added new types of trades for our IIG daily guidance since 2016, "no loss" propositions with unlimited upside potential, still using other people's money to trade.
Philippe
Receive daily trade recommendations - we do the research for you!
Instant Income Guaranteed
♦ SIGN UP TODAY! THIS IS WORTH THE INVESTMENT ♦
© by Joe Ross and Philippe Gautier. Re-transmission or reproduction of any part of this material is strictly prohibited without the prior written consent of Trading Educators, Inc.
Check out our Blog!
To view previous published Chart Scan newsletters, please log in or click on "Join Us,"
shown above, to subscribe to our free "Members Only" section.
A WEALTH OF INFORMATION & EDUCATION:
Joe Ross-Trading Educators' popular free Chart Scan Newsletter has been published since 2004.
Note: Unless otherwise noted, all charts used in Chart Scan commentary were created
by using Genesis Financial Technologies' Trade Navigator (with permission).
Legal Notice and Copyright 2017 Disclaimer - Published by Trading Educators, Inc.
Chart Scan is a complimentary educational newsletter.
© by Trading Educators, Inc. Re-transmission or reproduction of any part of this material is strictly prohibited without prior written consent.


