Edition 694 - September 29, 2017


Chart Scan with Commentary - Profit Taking Pivots
by Master Trader Joe Ross
Author, Trader, Trading Mentor, and Founder of Trading Educators, Inc.
Developer of Instant Income Guaranteed
One of my friends sent me the following chart along with his comments as you’ll see below.
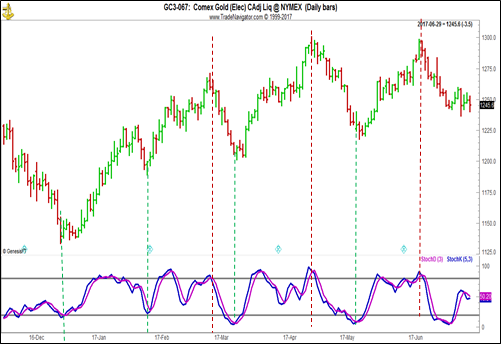
Not all my students trade plain vanilla charts, which is usually the way I trade them. Some students use indicators in unconventional ways to improve their trading. The chart below is an example of using Stochastics to confirm changes in momentum in conjunction with ends of swings and trends.

Here's what my friend wrote:
"Hey, Joe...I'm passing along this chart because I thought you'd want to take a look.
You've been talking longer-term recently; I just happened to be looking at the daily GOLD chart this evening. You might be interested to observe how well the Stochastic (5,3,3) has caught the profit-taking retracements, prior to changing direction in this market.
For example, if one made a habit of taking the first breakout following a %K/%D cross (or perhaps even wait for a reversal bar), plenty of dollars could have been made in gold futures. Will prices move higher or lower? We'll have to wait and to see!"
The concept shown in this issue of Chart Scan, along with greater details and even more techniques are covered in our More Special-Setups Webinar.
© by Joe Ross. Re-transmission or reproduction of any part of this material is strictly prohibited without the prior written consent of Trading Educators, Inc.

Trading Article - Can Tick, Ticki, and Trin Be Used with Stochastics?
by Master Trader Joe Ross
Author, Trader, Trading Mentor, and Founder of Trading Educators, Inc.
Developer of Instant Income Guaranteed
I get some unusual questions from time to time, and this is one of them.
Certainly, the TICK can be used with Stochastics, as I explain below. The TICK expresses the net total of NYSE stocks that have down-ticked or up-ticked on the last trade. When E-Mini S&Ps are making new intra-day highs, the TICK should be +250 minimum. If the TICK is negative, do not take a long position. When new intraday lows are being made, a -250 minimum value should be recorded. If the TICK reaches over +500, try to buy a Stochastic D line correction at 50 or lower, and expect new intraday highs. After 2 PM CST, the main trading in the T-Bonds is over, and E-Mini S&P prices are prone to rally if they were being pressured by the T-Bonds.
The TIKI does the same thing for the Dow 30 as the TICK does for the NYSE Stock Index. It measures the tick for the 30 DJ Industrial stocks. However, I am not able to tell you exactly how to use it because I haven't really ever looked at it. I'm sure that at a value which shows TIKI to favor a long position, and with the Stochastic at oversold, you would have corroboration for going long. Vice-versa for going short with the Stochastic at overbought.
The TRIN calculates two ratios of up and down volume on gaining and losing stocks. Below 65 the TRIN is bullish; it is bearish above 110. If you seek confirmation of TRIN for a bullish position, you would want a Stochastic reading of 25 or less. If you wanted confirmation of TRIN for a bearish position, you would want to see Stochastic at 75 or more.
Numbers can be very important. Did you know that the probability of financial ruin of a system 50% accurate with a 1 to 1 pay off risking 10% of capital on each trade is .99%; with a 2 to 1 payoff, the probability of financial ruin falls to .008%?
© by Joe Ross. Re-transmission or reproduction of any part of this material is strictly prohibited without the prior written consent of Trading Educators, Inc.

Instant Income Guaranteed - IPHI Trade
Philippe Gautier: Administration and New Developments
Developer: Joe Ross
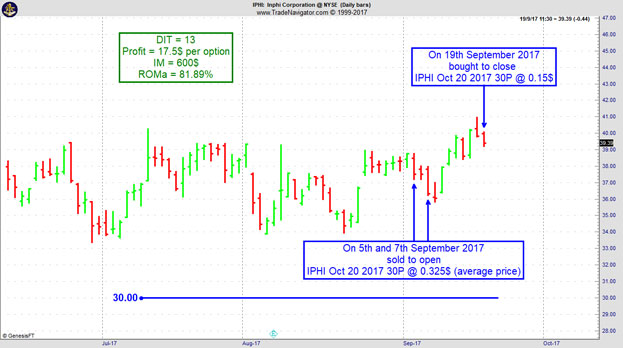
On 4th September 2017 we gave our IIG subscribers the following trade on Inphi Corporation (IPHI). We sold price insurance as follows:
- On 5th and 7th September 2017, we sold to open IPHI Oct 20 2017 30P @ 0.325$ (average price), with 44 days until expiration and our short strike about 20% below price action.
- On 19th September 2017, we bought to close IPHI Oct 20 2017 30P @ 0.15$, after 13 days in the trade for quick premium compounding.
Profit: $17.50 per option
Margin: $600
Return on Margin Annualized: 81.89%
We have also added new types of trades for our IIG daily guidance since 2016, "no loss" propositions with unlimited upside potential, still using other people's money to trade.
Philippe

Receive daily trade recommendations - we do the research for you!
♦ SIGN UP TODAY! THIS IS WORTH THE INVESTMENT ♦
© by Joe Ross and Philippe Gautier. Re-transmission or reproduction of any part of this material is strictly prohibited without the prior written consent of Trading Educators, Inc.
Traders Notebook Outrights
by Professional Trader Andy Jordan
Educator for Spreads, Options, Swing/Day Trading, and
Editor of Traders Notebook Complete and Traders Notebook Outrights
Learn Futures Swing Trading Strategies with Traders Notebook Outrights
Whether you trade commodities, currencies, financial instruments or indexes, there is a right approach to every market and time frame. You have never experienced support as you will find it with Traders Notebook. We back up and stand behind everything we do. Traders Notebook Outright shows you Futures Trading Strategies that you can also incorporate into your existing personal Day Trading Strategies.
YOU can tap into Joe Ross' and Andy Jordans' decades of hands-on trading experience. There is no need to struggle for years buying one book after another, or one "magical" mechanical trading system after another. You will receive a solid trading education from us! There is no need to knock yourself out learning about a lot of indicators. No need for Elliott Waves, Fibonacci points of confluence, and no need for Gann Theory.
Traders Notebook Outright Guide explains the Outright trading service from Trading Educators. It shows you around on the Outright Campus and how to use the information provided by the service.
TRADERS NOTEBOOK OUTRIGHTS
LOW
Monthly Subscription
$49.00/month
© by Andy Jordan. Re-transmission or reproduction of any part of this material is strictly prohibited without the prior written consent of Trading Educators, Inc.

TRADING VIDEO - MOST DEADLY MISTAKE MADE BY TRADERS
by Professional Trader Marco Mayer
Educator for Forex and Futures, Systematic Trader, and
Creator of Ambush Trading Method, Ambush Signals, and AlgoStrats.com
Let me share with you one of the most common, and most deadly mistakes traders can make, and that's averaging into a losing position. I will also give you some insights as to why this is so tempting, and shows you why you should avoid it at all costs.
INVEST IN YOU!
Marco Mayer - Private Mentoring Services
© by Marco Mayer. Re-transmission or reproduction of any part of this material is strictly prohibited without the prior written consent of Trading Educators, Inc.
Check out our Blog!
To view previous published Chart Scan newsletters, please log in or click on "Join Us,"
shown above, to subscribe to our free "Members Only" section.
A WEALTH OF INFORMATION & EDUCATION:
Joe Ross-Trading Educators' popular free Chart Scan Newsletter has been published since 2004.
Note: Unless otherwise noted, all charts used in Chart Scan commentary were created
by using Genesis Financial Technologies' Trade Navigator (with permission).
Legal Notice and Copyright 2017 Disclaimer - Published by Trading Educators, Inc.
Chart Scan is a complimentary educational newsletter.


