Edition 695 - October 6, 2017


Chart Scan with Commentary - Consolidation Part 1
by Master Trader Joe Ross
Author, Trader, Trading Mentor, and Founder of Trading Educators, Inc.
Developer of Instant Income Guaranteed
This week we are beginning a multi-part series on trading in consolidation. I want to show you how to trade inside a consolidation. But first we need to see a few basics to build up to "how to do it."
Let's begin with a basic truth: every market is in consolidation between the highest high it ever made and the lowest low. However, within that consolidation are trends, swings, and smaller consolidations from 4-bar ledges to trading ranges extending for more than 20 bars.
To trade within a consolidation, we must know as early as possible that a market is indeed consolidating. As we go through this series, I'll show you how to tell.
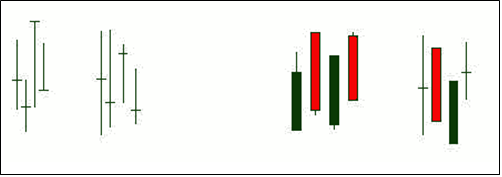
When we see an /\/\ or \/\/ on the screen, we know we are in a consolidating area. I know from your communications that many of you have a hard time recognizing consolidation. One way to spot consolidation is through the use of candlesticks.

Candlesticks offer a visual aid for spotting consolidation. Let's see how. If you see a group of dojis in a row, or a group of alternating green and red candles in a row, you are looking at consolidation. Any combination of alternating dojis and candlesticks constitute consolidation. Consolidation always has a minimum of four bars. When I say any combination of dojis and candlesticks, I mean that you might get two or more black candles in a row, followed by one or more red candles. The opposite is also true you might get two or more red candles in a row followed by one or more black candles. The congestion often starts with a doji followed by alternating red and black candles.
Consolidation may be telling you there may be confusion about price. Consolidation may be telling you that there is no oversupply or excessive demand. Supply and demand are in equilibrium, and so the market goes sideways. Consolidation can also mean less order flow into the markets. Prices are at a level where buyers are willing to buy and sellers are willing to sell, but there is nothing known that would cause impulsive, emotional buying and selling. and momentum and thrust are mostly missing.
To be continued…
© by Joe Ross. Re-transmission or reproduction of any part of this material is strictly prohibited without the prior written consent of Trading Educators, Inc.

Trading Article - Trading: Art or Science?
by Master Trader Joe Ross
Author, Trader, Trading Mentor, and Founder of Trading Educators, Inc.
Developer of Instant Income Guaranteed
I believe trading is far more an art than a science. For one thing, if trading were a science, then we should all be able to enter the same trade at the same time, and exit at the same time, getting identical results. We all know that just isn’t so. Yet if trading were scientific, we should be able to get identical results by doing the same thing. I believe such expectation describes the “scientific method.”
In addition, if trading were scientific, we should be able to come up with a “get rich” formula that would work all the time. We could then all retire and never have to work again. We all know this isn’t so either.
When we, as traders, make a trading decision, most of the time we do not fully know why we are making that decision.
You look at a market, you think about taking a trade in that market, and at some point you pull the trigger. You have thought of dozens of things in the time interval leading up to your entry. If I were to ask you, "Exactly why are you buying what you are, or why are you selling what you are?" you would probably not be able to give an accurate answer. You may be able to give a few reasons, but it will most likely not be the full answer. A lot of your decision to enter is subconscious. You do not really know why you entered, especially if you are day trading. To that extent it is more an art than a science, because you cannot fully demonstrate why you are doing what you are doing.
But you could say, "I fully know what I'm doing. I am taking the trade because I am following the signals of my method or system." Wonderful, you have just proved my point. When you are blindly trading signals from a method or system, you truly don't know why you are taking the trade. You are essentially acting like a robot, pre-programmed to follow signals whether or not they make sense.
I am not disparaging trading that way. If a method or system produces winning results, then what you are doing is following a statistically proven plan. All methods and all systems are based on statistics. The odds on any single trade are never more than 50% win or lose. However, the probability for a succession of trades is quite another story. If you are trading a method that wins seven out of ten times that you enter, and the method has produced a loser three or four times in a row, then the probability for a successful trade increases each time you enter the market. Sooner or later, over a series of trades, you are going to have the result of seven winners against 3 losers. That is statistically valid; however, it is not exactly rocket science. You will have proven that trading is an art — the art of following a statistically valid plan.
© by Joe Ross. Re-transmission or reproduction of any part of this material is strictly prohibited without the prior written consent of Trading Educators, Inc.

Instant Income Guaranteed - LNC Trade
Philippe Gautier: Administration and New Developments
Developer: Joe Ross
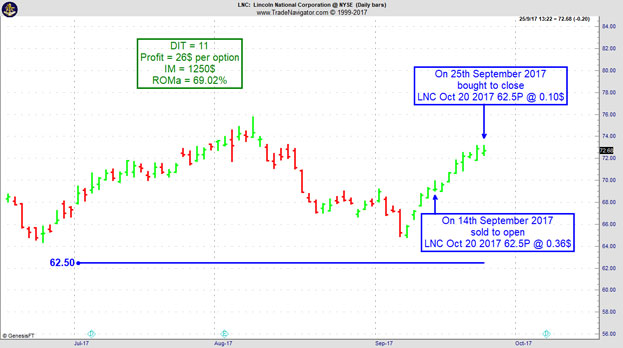
On 13th September 2017 we gave our Instant Income Guaranteed (IIG) subscribers the following trade on Lincoln National Corporation (LNC). We sold price insurance as follows:
- On 14th and 15th September 2017, we sold to open LNC Oct 20 2017 62.5P @ 0.36$ (average price), with 35/36 days until expiration and our short strike about 10% below price action.
- On 25th September 2017, we bought to close LNC Oct 20 2017 62.5P @ 0.10$, after 11 days in the trade for quick premium compounding.
Profit: $26 per option
Margin: $1,250
Return on Margin Annualized: 69.02%
We have also added new types of trades for our IIG daily guidance since 2016, "no loss" propositions with unlimited upside potential, still using other people's money to trade.
Philippe

Receive daily trade recommendations - we do the research for you!
♦ SIGN UP TODAY! THIS IS WORTH THE INVESTMENT ♦
© by Joe Ross and Philippe Gautier. Re-transmission or reproduction of any part of this material is strictly prohibited without the prior written consent of Trading Educators, Inc.
Blog Post - Patience as a Central Pillar of Your Strategy
by Professional Trader Andy Jordan
Educator for Spreads, Options, Swing/Day Trading, and
Editor of Traders Notebook Complete and Traders Notebook Outrights
Find out what the primary part of your trading strategy should include...read more.
© by Andy Jordan. Re-transmission or reproduction of any part of this material is strictly prohibited without the prior written consent of Trading Educators, Inc.

Trading Article - Who's next in line?
by Professional Trader Marco Mayer
Educator for Forex and Futures, Systematic Trader, and
Creator of Ambush Trading Method, Ambush Signals, and AlgoStrats.com
"Buy low, sell high" is one of the most popular memes in the investment and trading world. And obviously, it does make sense, who wouldn't like to buy low and sell high all the time? I found this to be quite a helpful advice to invest in stocks for example. Wait for a crash, buy it and sell again when prices are back to old highs.
Of course, the problem often is to figure out what's actually a low price and what's a high price. You can also buy high and sell higher to make a profit, which is how trend following works.
So what's the real deal here? I think the actual question to ask is "who's going to buy after me?" or "who's next in line?". Will there be enough traders willing to buy after you did at a higher price? Or if you're short the other way around, will there be sellers standing in line to sell after you did or not?
Think about it. To make a profit that's exactly what needs to happen. If you buy at $100, the only way to make a profit is if there are buyers willing to buy at higher prices. If they don't bid it up after you and you find someone to sell to at a higher price, you won't make a profit. Simple fact most traders are not really aware of.
Obviously, there's always someone who's gonna be the last in line. Someone is going to buy the high of the day/week/month/year/all-time. In poker, there's the popular saying that if you don't know who the patsy is in the round after 30 minutes, it's probably you. That same idea applies to trading. If you don't know why other traders are probably willing to buy at a higher price after you during the day, you might be the last one in the order book to bid at such a high price for today.
Because of that, it's always helpful to ask yourself "Who's gonna buy/sell after me and why?". If you can't answer that question it might be best to skip the trade!
Happy Trading!
Marco
© by Marco Mayer. Re-transmission or reproduction of any part of this material is strictly prohibited without the prior written consent of Trading Educators, Inc.
Check out our Blog!
To view previous published Chart Scan newsletters, please log in or click on "Join Us,"
shown above, to subscribe to our free "Members Only" section.
A WEALTH OF INFORMATION & EDUCATION:
Joe Ross-Trading Educators' popular free Chart Scan Newsletter has been published since 2004.
Note: Unless otherwise noted, all charts used in Chart Scan commentary were created
by using Genesis Financial Technologies' Trade Navigator (with permission).
Legal Notice and Copyright 2017 Disclaimer - Published by Trading Educators, Inc.
Chart Scan is a complimentary educational newsletter.


