Edition 696 - October 13, 2017

Check out next week's newsletter for Andy Jordan's Traders Notebook special offer!
by Professional Trader Andy Jordan
Educator for Spreads, Options, Swing/Day Trading, and
Editor of Traders Notebook Complete and Traders Notebook Outrights
This week, we're looking at ZMH18 – ZMN18: long March 2018 and short July 2018 Soybean Meal (CBOT on Globex).

Today we consider a Soybean Meal calender spread: long March 2018 and short July 2018 Soybean Meal (elec. symbols: ZMH18 – ZMN18; ZMES2H8 on CQG).
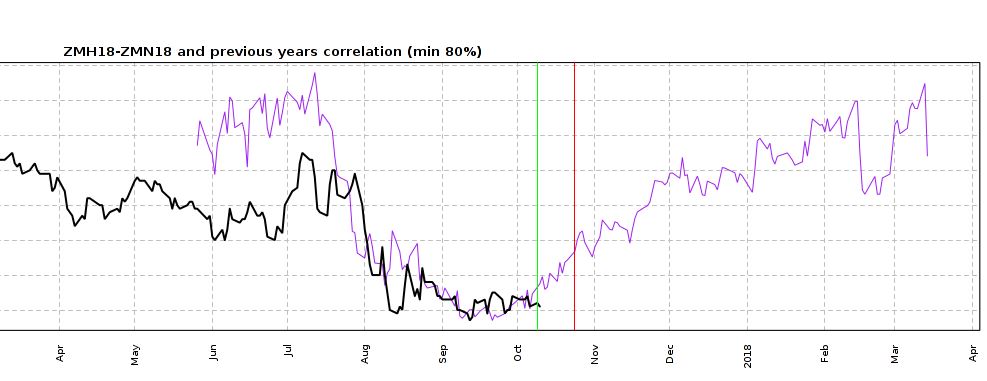
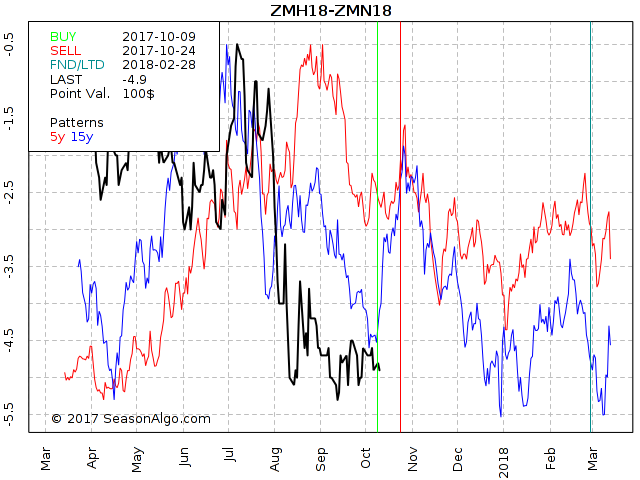
As you may have noticed, we are looking at a different chart today. The chart above is a so called “Correlation Chart” showing the correlation between the current Soybean Meal spread (March 18 – July 18) and the years 82, 99, 07, and 09. The spread has been following nicely its 4 Year correlation for the last few months. Will the spread follow the correlation during the next few weeks as well? Of course, we don’t know but together with the seasonal tendency to the up-side in October (chart below, there is a good statistical chance the spread will move higher.

Do you want to see how we manage this trade and how to get detailed trading instructions every day?
Traders Notebook Complete
Please visit the following link:
Yes, I would like additional information!
Check out next week's newsletter for Andy Jordan's Traders Notebook special offer!
© by Andy Jordan. Re-transmission or reproduction of any part of this material is strictly prohibited without the prior written consent of Trading Educators, Inc.

Chart Scan with Commentary - Consolidation Part 2
by Master Trader Joe Ross
Author, Trader, Trading Mentor, and Founder of Trading Educators, Inc.
Developer of Instant Income Guaranteed
This week we continue the discussion of sideways markets we started a week ago:
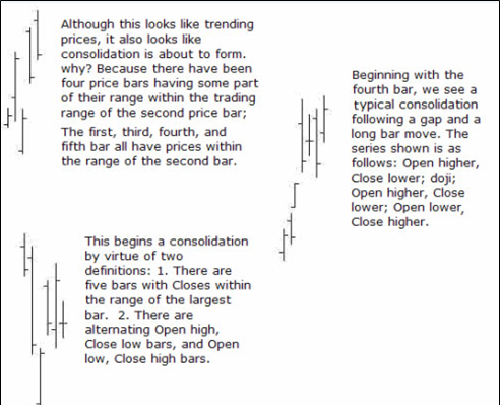
A good example of sideways price action is usually seen at the end of a trend or swing. Following a 1-2-3 low formation, the probabilities favor some form of consolidation. There is a word for this type of consolidation — “accumulation.” However, consolidations following a 1-2-3 high formation are called “distribution.” Consider what you have seen on charts. How many Vee bottoms and tops have you seen compared with how many consolidating tops and bottoms form up?
What are the first clues that prices may be getting ready to consolidate? Can consolidation be spotted while it is still in the birth canal? Let’s take a look:

The question becomes how to trade effectively inside a sideways market. It's important for you to know, because at any time markets can and do go into prolonged consolidations — sometimes remaining in them so long that it becomes difficult to make a living without a good understanding of how to trade such markets.
In the next issue of Chart Scan we will take a look at how it might be done.
To be continued...
© by Joe Ross. Re-transmission or reproduction of any part of this material is strictly prohibited without the prior written consent of Trading Educators, Inc.

Trading Article - What Drives Inflation?
by Master Trader Joe Ross
Author, Trader, Trading Mentor, and Founder of Trading Educators, Inc.
Developer of Instant Income Guaranteed
If there is one factor that drives the inflation-deflation cycle, it is the effect and trend of interest rates. The bond/note market is the foundation of the stock market, and makes its existence possible. Interest rates compete with all other forms of investment for capital. When rates are rising, the stock market is less attractive because government bond and note yields are guaranteed, while stock market dividends and profits are not. Falling interest rates, which may stimulate inflation, precipitated the largest stock market increase in history. Real interest rate yield equals the inflation rate subtracted from interest rate yields. A 5% bond yield and 7% inflation rate erodes the purchasing power of money annually by two times.
Notes and bonds are not really controllable by the FED. The market pretty much decides what those will be. There is a great fallacy perpetrated by the FED which makes people think the FED controls interest rates. The truth is they don’t. All the FED ever does is to react to what is happening in the market. When the yield curve gets too far out of alignment, the Fed raises or lowers interest rates.
However, there's more. The FED does control the money supply. The FED prints money with no accountability. They create money out of thin air. With the removal of the M3 statistic, the lack of control is even more prominently displayed. The FED is almost entirely responsible for long-term inflation. If you or I were to print money with no accountability, we would be put in prison for counterfeiting. Yet the FED continues to print counterfeit money to the extent that people on fixed incomes suffer tremendously from the falling dollar. In effect, by printing tons of money the FED has devalued the dollar to the point of excess. In the last 10 years the purchasing power of the dollar has declined considerably.
© by Joe Ross. Re-transmission or reproduction of any part of this material is strictly prohibited without the prior written consent of Trading Educators, Inc.

Instant Income Guaranteed - EV Trade
Philippe Gautier: Administration and New Developments
Developer: Joe Ross
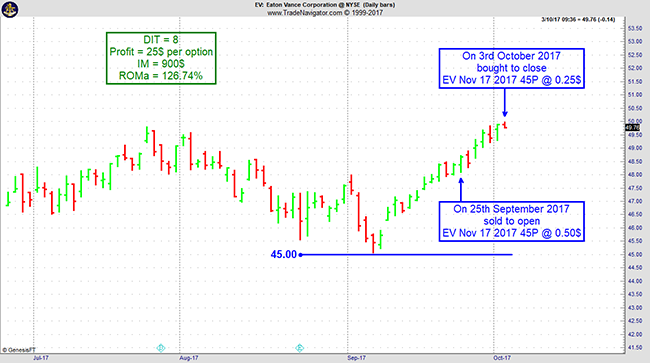
On 24th September 2017 we gave our Instant Income Guaranteed subscribers the following trade on Eaton Vance Corporation (EV). We sold price insurance as follows:
- On 25th September 2017, we sold to open EV Nov 17 2017 45P @ 0.50$, with 52 days until expiration and our short strike about 7% below price action.
- On 3rd October 2017, we bought to close EV Nov 17 2017 45P @ 0.25$, after 8 days in the trade for quick premium compounding.
Profit: $25 per option
Margin: $900
Return on Margin Annualized: 126.74%
We have also added new types of trades for our Instant Income Guaranteed daily guidance since 2016, "no loss" propositions with unlimited upside potential, still using other people's money to trade.
Philippe

Receive daily trade recommendations - we do the research for you!
♦ SIGN UP TODAY! THIS IS WORTH THE INVESTMENT ♦
© by Joe Ross and Philippe Gautier. Re-transmission or reproduction of any part of this material is strictly prohibited without the prior written consent of Trading Educators, Inc.

Trading Video - Trading Error: Averaging into a Losing Position
by Professional Trader Marco Mayer
Educator for Forex and Futures, Systematic Trader, and
Creator of Ambush Trading Method, Ambush Signals, and AlgoStrats.com
Find out the most common, deadly mistakes traders can make, and that's averaging into a losing position. Learn insights as to why this is so tempting, and why you should avoid it at all costs.
© by Marco Mayer. Re-transmission or reproduction of any part of this material is strictly prohibited without the prior written consent of Trading Educators, Inc.
Check out our Blog!
To view previous published Chart Scan newsletters, please log in or click on "Join Us,"
shown above, to subscribe to our free "Members Only" section.
A WEALTH OF INFORMATION & EDUCATION:
Joe Ross-Trading Educators' popular free Chart Scan Newsletter has been published since 2004.
Note: Unless otherwise noted, all charts used in Chart Scan commentary were created
by using Genesis Financial Technologies' Trade Navigator (with permission).
Legal Notice and Copyright 2017 Disclaimer - Published by Trading Educators, Inc.
Chart Scan is a complimentary educational newsletter.


