Edition 698 - October 27, 2017


Trading Article - Don’t be stubborn in trading!
by Professional Trader Marco Mayer
Educator for Forex and Futures, Systematic Trader, and
Creator of Ambush Trading Method, Ambush Signals, and AlgoStrats.com
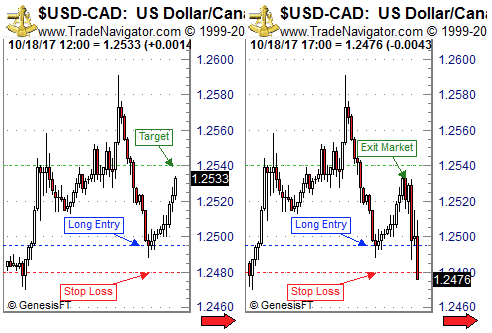
I recently found myself in a day trade in USD/CAD that I’d like to talk about. The exact reason for my entry actually doesn't matter for this article but the idea was to buy the pair at a support level where I expected it to at least temporarily bounce off nicely. The best case outcome for this trade was that it would hit my profit target that I had set shortly after the entry. It would give me a nice profit of more than two times my risk and I set it at a price where I was expecting the potential rally to run into sellers again.
For sure I’ve been lucky with this one as shortly after the entry the market rallied nicely straight up for hours without any significant corrections. So the next morning (entry happened during the night) I was pleasantly surprised that USD/CAD was already approaching my profit target, see below on the first chart the market looked like at that point in time.

USD/CAD was just about 7 pips short of reaching my profit target while my stop-loss was still at the initial stop loss level. I think I’ve read a similar story in one of the market wizards books, but in a summary, the situation was like this. The market was trading very close to my profit target that I had set because I expected sellers around that price level. At the same time, the trade could still turn into a full loss as I hadn’t moved my stop loss.
So, in other words, the potential for further profits was just about 7 pips while my risk was about 53 pips! That’s when you simply cannot be stubborn in a discretionary trade, you got to act!
As this had been such a nice, stress-free rally to that point and I’ve been already so close to the profit target I decided to simply take my money and run. I just got out at the market.
If the profit target had been slightly further away I might have chosen another option. Go down to a lower timeframe and use a tight trailing stop to either get stopped out with a nice profit or have the market run into the profit target.
On the right chart, you can see what happened after that. The rally fizzled and USD/CAD plummeted. So don’t be stubborn in trading!
Happy trading,
Marco
Feel free to email Marco with any questions, This email address is being protected from spambots. You need JavaScript enabled to view it..
© by Marco Mayer. Re-transmission or reproduction of any part of this material is strictly prohibited without the prior written consent of Trading Educators, Inc.

Chart Scan with Commentary - Consolidation Part 4
by Master Trader Joe Ross
Author, Trader, Trading Mentor, and Founder of Trading Educators, Inc.
Developer of Instant Income Guaranteed
In this issue of Chart Scan and in the next, I will be showing you a couple of confirming ways to trade sideways markets. I think you’ll find them interesting.
First, we must have a rule. We can trade in a consolidation only if the height of the consolidation is equal to or greater in dollars than the exchange minimum margin for entering the trade, or the exchange maintenance margin for holding overnight, at the time we realize the market has entered into the consolidation. The choice is yours.
As with all rules, there are exceptions. If a market has great volatility, we can use 1/2 the exchange minimum margin, or 1/2 the maintenance margin. Again, the choice is yours.
My example for this study is the seen on the daily T-Bond chart below. It could have been any market. A market is the market, and a chart is a chart. I'll be switching between two programs because I need to utilize two different studies. Unfortunately, I do not have them both in the same software.
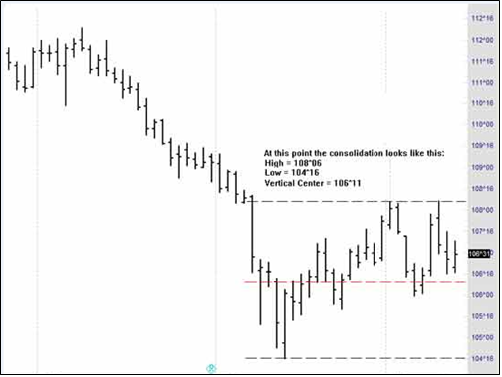
The margin for the T-Bond was $1,620 and the maintenance margin was $1,200. The high of the consolidation was 108^06 and the low was 104^16, for a height of 3^22, which is equal to $3,687.50 — more than enough to meet our rule. In fact, the height was more than enough to meet our rule for great volatility: 1/2 the exchange minimum margin.
Let's get a bird’s eye view of how the bonds dropped into a consolidation area.

Next week we will do some measuring and draw some definitive lines on this chart. For now, let’s see where we can begin counting the consolidation so far.
We must ask: “which bar or Close of which bar most represents the vertical center of the consolidation?”
108 6/32 – 104 16/32 = 3 22/32
Divided by 2 = 1 27/32
1 27/32 + 104 16/32 = 106 11/32
The halfway mark of the consolidation is 106^11.
To be continued...
© by Joe Ross. Re-transmission or reproduction of any part of this material is strictly prohibited without the prior written consent of Trading Educators, Inc.

Trading Article - Selecting Stocks
by Master Trader Joe Ross
Author, Trader, Trading Mentor, and Founder of Trading Educators, Inc.
Developer of Instant Income Guaranteed
Stock book values, Price-Earnings Ratios, and stock dividends are not the fundamentals that determine a stock's price trend. Strong increased earnings, preferably over the last five years, are the most bullish fundamental statistic related to the price trend of a stock.
The best P-E ratio for strong rising stocks is over 20. These stocks remain in strong bull markets about 18 months. At the end of a typical bull market move, the P-E ratio will have doubled to over 40.
Stock traders should buy stocks that have increased earnings of 50% greater over the previous quarter minimum and show a solid earnings trend on an annual basis for five years. Be prepared to buy these stocks the moment they break out to the upside on a technical basis, or buy them when they post 52-week new highs. Wal-Mart and Tyson increased over 4000% in the decade of the 1980's. Both of these Northwest Arkansas companies met the above evaluation criteria. Another way to find good stocks is through the CANSLIM method. William O'Neil gives his excellent CANSLIM method away with a free Investor's Daily trial subscription. You might want to try it.
When I was living on a mountain top in South Africa I had only end of day data. The expense of using the Internet was so prohibitive as to make anything else not worthwhile. That is when I developed my own method for selecting stocks. It was really quite simple, and it worked. I have shown it to many of my students and they have seen it work. The method is to look for Traders Trick Entries ahead of Ross Hooks in rising markets.
Here is the "magic" way I did my stock selection: I hope you are ready for this! I typed in stock symbols aa, ab, ac, ad, ae, af, etc. consecutively, until I found a stock that was making a TTE ahead of a Ross Hook. For the next stock, I began with ba, bb, bc, bd, be, bf, etc. I rarely completed a letter series before I found something that met my qualifications. Furthermore, I don't recall having to use a 3-letter symbol to get the trades I wanted. The only qualification was volume, and I insisted on 400,000 shares/day. Sometimes it was drudge work doing it, but it met my other qualification — to be able to trade from any place in the world, including a mountain top, as long as I had a telephone, a modem, and a price chart.
© by Joe Ross. Re-transmission or reproduction of any part of this material is strictly prohibited without the prior written consent of Trading Educators, Inc.

Instant Income Guaranteed - CCL Trade
Philippe Gautier: Administration and New Developments
Developer: Joe Ross
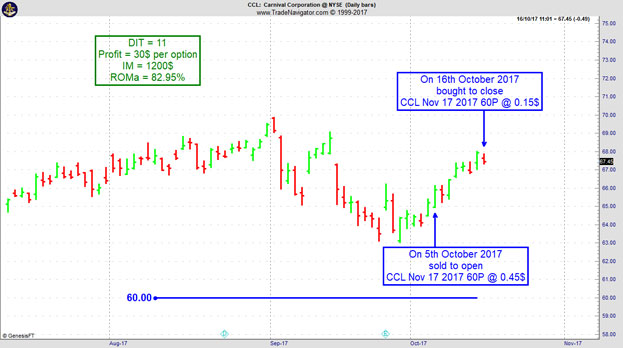
On 4th October 2017 we gave our Instant Income Guaranteed subscribers the following trade on Carnival Corporation. (CCL). We sold price insurance as follows:
- On 5th October 2017, we sold to open CCL Nov 17 2017 60P @ 0.45$, with 42 days until expiration and our short strike about 8% below price action.
- On 16th October 2017, we bought to close CCL Nov 17 2017 60P @ 0.15$, after 11 days in the trade for quick premium compounding.
Profit: $30 per option
Margin: $1,200
Return on Margin Annualized: 82.95%
We have also added new types of trades for our Instant Income Guaranteed daily guidance since 2016, "no loss" propositions with unlimited upside potential, still using other people's money to trade.
Philippe

Receive daily trade recommendations - we do the research for you!
♦ SIGN UP TODAY! THIS IS WORTH THE INVESTMENT ♦
© by Joe Ross and Philippe Gautier. Re-transmission or reproduction of any part of this material is strictly prohibited without the prior written consent of Trading Educators, Inc.
Trading Article - Be Careful to Avoid Overconfidence
by Professional Trader Andy Jordan
Educator for Spreads, Options, Swing/Day Trading, and
Editor of Traders Notebook Complete and Traders Notebook Outrights
After a good-sized win or series of wins, you may get a feeling of invincibility with regards to your trading prowess. This could last for a period of time; an invincibility that quickly dismisses from mind the prior long cold spells suffered through, what a struggle it was at the time, how much toil, trouble, and, yes, even luck, that it took.
A state of great ease and relaxation can envelop us. If you won $5,000, for instance, you might feel like, “Heck, now I can lose $1,000 or $2,000, and still be up $3,000.” This feeling of fatness could be self-fulfilling. Of course you are too smart to fall into this trap; you would see it coming.
Unless you take this warning seriously, you might very well lose that money back — at least a serious chunk of it. How am I able to say that with such certainty? Because overconfidence makes one careless. If you do not pay attention to the details and self-control that helped you win in the first place, the likelihood of continuing to be successful rapidly diminishes.
One thing is true in trading: when things are going so well that it is hard to believe what is happening, don't change the disciplines and behavior that are working for you!
© by Andy Jordan. Re-transmission or reproduction of any part of this material is strictly prohibited without the prior written consent of Trading Educators, Inc.
Check out our Blog!
To view previous published Chart Scan newsletters, please log in or click on "Join Us,"
shown above, to subscribe to our free "Members Only" section.
A WEALTH OF INFORMATION & EDUCATION:
Joe Ross-Trading Educators' popular free Chart Scan Newsletter has been published since 2004.
Note: Unless otherwise noted, all charts used in Chart Scan commentary were created
by using Genesis Financial Technologies' Trade Navigator (with permission).
Legal Notice and Copyright 2017 Disclaimer - Published by Trading Educators, Inc.
Chart Scan is a complimentary educational newsletter.


