Edition 699 - November 3, 2017


Chart Scan with Commentary - Consolidation Part 5
by Master Trader Joe Ross
Author, Trader, Trading Mentor, and Founder of Trading Educators, Inc.
Developer of Instant Income Guaranteed
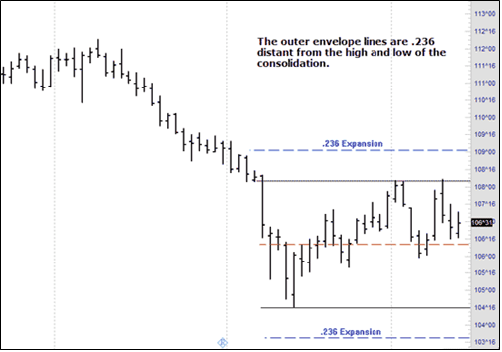
Continuing with the bond illustration to this point, the next step is to compute a couple of very interesting ratios. These ratios are ones I came across long before I ever heard of Gann or Fibonacci. If they turn out to be the same as the ratios of either of them, so be it. I know that I discovered them on my own, and have used them for many decades. They work amazingly well when trading inside consolidation. The ratios are used to create an envelope. The first ratio will be used to compute both upper and lower envelope values.
Last week we discovered that the height of the consolidation was 3^22. We must now take a ratio from the value of the height. The ratio is .236. To compute the ratio we will convert the height from 32nds to decimal.
3^22 = 3*32+22 = 118
.236*118 = 27.848
The high of the consolidation was 108^06.
Converting 108^06 to decimal:
108*32+6 = 3462
Next we add the ratio of .236 to the high of the consolidation to obtain a value for the upper envelope line:
3462+27.848 = 3489.848
Converting that back to 32nds:
3489.848/32 = 109.05774
.05774*32 = 2 (rounded)
The upper envelope line is placed at 109^2
We now have to obtain a value for the lower envelope.
The low of the consolidation was 104^16.
104*32+16 = 3344
Next we subtract the ratio of .236 from the low of the consolidation to obtain a value for the lower envelope line:
3344-27.848 = 3316.152
Converting back to 32nds:
3316.152/32 = 103.62975
.62975*32 = 20 (rounded)
The lower envelope line is placed at 103^20
Next week we will compute another ratio and add it to and subtract from both the high and the low of the consolidation.
At this point our chart looked like this:

To be continued...
© by Joe Ross. Re-transmission or reproduction of any part of this material is strictly prohibited without the prior written consent of Trading Educators, Inc.

Trading Article - Fitting it all together Part 1 (Economics 101 in a nutshell)
by Master Trader Joe Ross
Author, Trader, Trading Mentor, and Founder of Trading Educators, Inc.
Developer of Instant Income Guaranteed
Here is an encapsulated generalized view of markets and trading:
Try to develop an inter-market view of how futures markets correlate with one another. Cows are fed grain to fatten them up, so when grain prices rise, expect higher meat prices — ergo, be ready to trade meats from the long side.
If meat prices go up, then so should other food prices like cocoa and sugar for candy bars.
Orange juice, coffee, and pork belly bacon are served for breakfast with eggs, and wheat toast is buttered with (ugh) corn oil margarine. If corn prices rise, the demand for wheat will rise, and both wheat toast and corn oil margarine will rise in price. Lesson: favor grains to the long side.
Half-witted politicians think they are being ecologically responsive by pushing for ethanol, but all this does is push the price of corn higher, then the price of meat higher, and finally the price of a lot of other things higher. Why do I call the politicians half-wits? Because anyone with even the smallest amount of knowledge knows that all you can get from corn as an energy source is exactly what you put into it. One unit of energy in and one unit of energy out.
If the trend in gold and interest rates has been declining, deflation is prevalent. Be ready to trade bonds and notes from the long side.
The opposite trends apply to inflation. When the prices of gold and interest rates are rising, expect most commodities to follow that trend, except independent currencies and the stock market, which decline with rising rates.
Manufacturers increase profits two basic ways without the need for increased efficiency: by lowering labor and raw materials costs, or by raising prices.
When inflation is prevalent, higher raw material costs are passed on to higher finished product costs to maintain a fixed profit margin. The Producer Price Index, PPI, usually increases before the Consumer Price Index, CPI, does. Factory utilization over 85% is thought to forecast rising inflation as well.
© by Joe Ross. Re-transmission or reproduction of any part of this material is strictly prohibited without the prior written consent of Trading Educators, Inc.

Instant Income Guaranteed - LITE Trade
Philippe Gautier: Administration and New Developments
Developer: Joe Ross
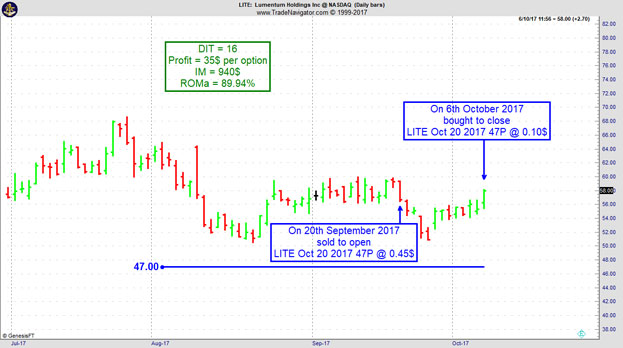
On 19th September 2017 we gave our Instant Income Guaranteed subscribers the following trade on Lumentum Holdings Inc (LITE). We sold price insurance as follows:
- On 20th September 2017, we sold to open LITE Oct 20 2017 47P @ 0.45$, with 30 days until expiration and our short strike about 21% below price action.
- On 6th October 2017, we bought to close LITE Oct 20 2017 47P @ 0.10$, after 16 days in the trade for quick premium compounding.
Profit: $35 per option
Margin: $940
Return on Margin Annualized: 89.94%
We have also added new types of trades for our IIG daily guidance since 2016, "no loss" propositions with unlimited upside potential, still using other people's money to trade.
Philippe

Receive daily trade recommendations - we do the research for you!
♦ SIGN UP TODAY! THIS IS WORTH THE INVESTMENT ♦
© by Joe Ross and Philippe Gautier. Re-transmission or reproduction of any part of this material is strictly prohibited without the prior written consent of Trading Educators, Inc.
Trading Article - Protective Stops
by Professional Trader Andy Jordan
Educator for Spreads, Options, Swing/Day Trading, and
Editor of Traders Notebook Complete and Traders Notebook Outrights
Protective stops have to be related to the strategy and the markets being traded. It is not a good idea to use a $200 stop that might be appropriate on a corn contract in sugar or the soybean market. This is because each market has a different value and different volatility. Protective stops should be linked to the volatility and value of the underlying market.
It is also a major mistake to use a protective stop purely based on your account size and how much you are willing to lose. If you have a $10,000 account and you don't want to risk more than $500 on any given trade, but the stop in this particular market and trade is at $750, you DON'T take the trade. Risk management and money management are major parts of trading, and have to be implemented into your trading strategy.
© by Andy Jordan. Re-transmission or reproduction of any part of this material is strictly prohibited without the prior written consent of Trading Educators, Inc.

Trading Video - Why having a view on a market isn't enough
by Professional Trader Marco Mayer
Educator for Forex and Futures, Systematic Trader, and
Creator of Ambush Trading Method, Ambush Signals, and AlgoStrats.com
In this video, Marco talks about why having a view on the direction of a market isn't enough. The reason is that just having a directional view doesn't make a trade...find out why!
Happy trading,
Marco
Feel free to email Marco with any questions, This email address is being protected from spambots. You need JavaScript enabled to view it..
© by Marco Mayer. Re-transmission or reproduction of any part of this material is strictly prohibited without the prior written consent of Trading Educators, Inc.
Check out our Blog!
To view previous published Chart Scan newsletters, please log in or click on "Join Us,"
shown above, to subscribe to our free "Members Only" section.
A WEALTH OF INFORMATION & EDUCATION:
Joe Ross-Trading Educators' popular free Chart Scan Newsletter has been published since 2004.
Note: Unless otherwise noted, all charts used in Chart Scan commentary were created
by using Genesis Financial Technologies' Trade Navigator (with permission).
Legal Notice and Copyright 2017 Disclaimer - Published by Trading Educators, Inc.
Chart Scan is a complimentary educational newsletter.


