Edition 700 - November 10, 2017


Chart Scan with Commentary - Consolidation Part 6
by Master Trader Joe Ross
Author, Trader, Trading Mentor, and Founder of Trading Educators, Inc.
Developer of Instant Income Guaranteed
Last week I wrote that there were two ratios we would use to compute envelope lines. The second ratio is .146.
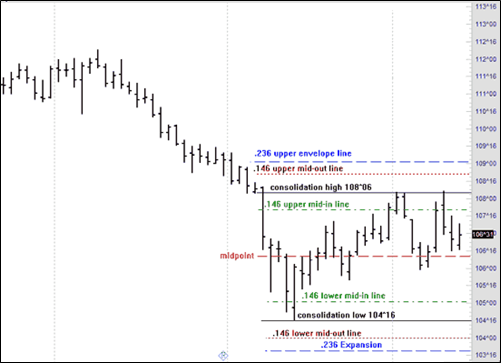
We previously discovered the height of the consolidation as being 3^22. We will now go through a similar procedure to we did last week, using the .146 ratio.
3^22 = 3*32+22 = 118
.146*118 = 17.228 = decimal height of the consolidation.
The high of the consolidation was 108^06.
Converting 108^06 to decimal:
108*32+6 = 3462
Next we add the ratio of .146 of the height to the high of the consolidation, but this time we take a second step as well. We will subtract the ratio of .146 of the height from the consolidation. This will give us two lines: one between the high of the consolidation and the upper envelope line called the “upper mid-out line,” and one between the upper envelope line and the lower envelope line, called the “upper mid-in line.”
3462+17.228 = 3479.228
Converting back to 32nds:
3479.228/32 = 108.725875
.725875*32 = 7 (rounded)
108^23 = upper mid-out line.
3462-17.228 = 3444.772
Converting back to 32nds:
3444.772/32 = 107.649125
.649125*32 = 21 (rounded)
107^21= upper mid-in line.
The lower mid-in line and the lower mid-out lines are computed as follows:
The low of the consolidation: 104^16.
Converting 104^16 to decimal:
104X32+16 = 3344
3344+17.228 = 3361.228
3361.228/32 = 105.038375
.038375*32 = 1 (rounded)
105^1 = lower mid-in line.
3344-17.228 = 3327.772
3327.772/32 = 103.992875 (rounded)
.9982875*32 = 32/32 = 1

To be continued...
© by Joe Ross. Re-transmission or reproduction of any part of this material is strictly prohibited without the prior written consent of Trading Educators, Inc.

Trading Article - Fitting it all together Part 2 (Economics 101 in a nutshell)
by Master Trader Joe Ross
Author, Trader, Trading Mentor, and Founder of Trading Educators, Inc.
Developer of Instant Income Guaranteed
We heard from a lot of you that you would like me to continue describing how markets are related. I will intersperse these kinds of tidbits with others. However, since so many asked, today's tidbit is along the lines of how markets relate to fundamentals.
After a breakout, look for a return. Successful returns can beget generous returns.
When a market does finally overcome resistance, penetrate a psychological barrier, or break out of a formation or consolidation, it tends to do so boldly at first. But after its initial thrust, it often needs reassurance. To reconfirm its freedom, it may even return to the very area from which it just broke its constraints.
When traders on the wrong side exit and new participants eagerly enter in the direction of the breakout, the return to retest succeeds in reenergizing, reinforcing, and resuming the new trend.
Futures traders must always expect the unexpected when least expected. Would you, for example, expect prices to be pressured by a surge in supply before a decline in consumption?
Let's look at some relationships in the soybean market.
Brazil harvests soybeans from February through May, during which crushing facilities run at capacity. Flush with new supplies for sale (most soybean oil is consumed domestically), the world's second largest exporter of soybean meal competes aggressively in the world market.
But soybean meal is a high-protein feed supplement for livestock. World consumption is greatest by far during the Northern Hemisphere's cold winter weather, when high caloric intake is required for animals to maintain and gain weight. Conversely, world consumption is lowest during July and August, when grass is available and the weather is hot.
So you might expect soybean meal prices to be especially weak during June, just after Brazil's harvest and just before the heat of the northern summer. But that is not so! Soybean meal has instead been the leader in the grains and soy complex.
Why is that the case? A seasonal transition appears to occur during June. As the surge in South American supplies begins to recede, the market turns back towards old-crop US supplies — perhaps stimulating some change in commercial ownership. U.S. soybean processors, who may have hedged soybean meal during Brazil's harvest in order to protect product prices and profit margins, may now begin covering short positions. Conversely, with low July/August consumption already discounted, the market begins to anticipate a rise in Northern Hemisphere demand — perhaps generating commercial buying.
Although product value within the soy complex has generally begun to favor soybean meal over soybean oil from as early as March, this sudden surge in soybean meal has been especially reflected in spreads between the two right around the middle of June. You might want to mark that on your trading calendar; it has been a high percentage spread trade for many years.
This strength in old-crop soybean meal is also reflected in spreads against new-crop soybean meal. As world demand returns to U.S. supplies, a new crop of soybeans is emerging to offer potentially plentiful new supplies late in the year. So, usually, the old-crop outperforms new-crop, often throughout the rest of the marketing year.
© by Joe Ross. Re-transmission or reproduction of any part of this material is strictly prohibited without the prior written consent of Trading Educators, Inc.

Instant Income Guaranteed - KR Trade
Philippe Gautier: Administration and New Developments
Developer: Joe Ross
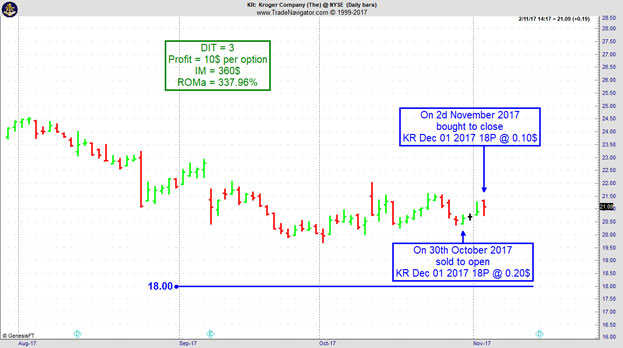
On 29th October 2017 we gave our Instant Income Guaranteed subscribers the following trade on Kroger Company (KR). We sold price insurance as follows:
- On 30th October 2017, we sold to open KR Dec 01 2017 18P @ 0.20$, with 31 days until expiration and our short strike about 12% below price action.
- On 2nd November 2017, we bought to close KR Dec 01 2017 18P @ 0.10$, after only 3 days in the trade for quick premium compounding.
Profit: 10$ per option
Margin: 360$
Return on Margin annualized: 337.96%
We have also added new types of trades for our IIG daily guidance since 2016, "no loss" propositions with unlimited upside potential, still using other people's money to trade.
Philippe

Receive daily trade recommendations - we do the research for you!
♦ SIGN UP TODAY! THIS IS WORTH THE INVESTMENT ♦
© by Joe Ross and Philippe Gautier. Re-transmission or reproduction of any part of this material is strictly prohibited without the prior written consent of Trading Educators, Inc.
Trading Idea - Crude Light Calandar Spread
by Professional Trader Andy Jordan
Educator for Spreads, Options, Swing/Day Trading, and
Editor of Traders Notebook Complete and Traders Notebook Outrights
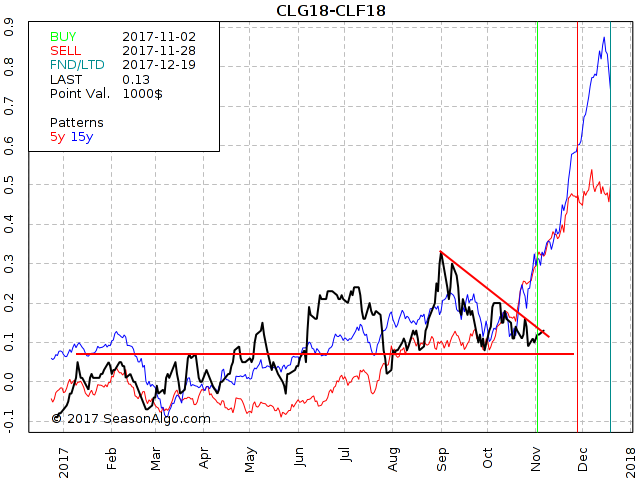
This week, we're looking at CLG18 – CLF18: long February 2018 and January 2018 Crude Oil (NYMEX on Globex).

Today we consider a Crude Light calendar spread: long February 2018 and January 2018 Crude Oil (symbols on CQG for the January – February spread is CLES1F8). The spread has found support around 0.070 several times during the last few months. At the same level, the spread has run into resistance during the first few months of 2017. As long as the spread stays above break even, there is a good chance the spread will follow it seasonal tendency to the up-side for the next few weeks.
Do you want to see how we manage this trade and how to get detailed trading instructions every day?
Traders Notebook Complete
Please visit the following link:
Yes, I would like additional information!
© by Andy Jordan. Re-transmission or reproduction of any part of this material is strictly prohibited without the prior written consent of Trading Educators, Inc.

Trading Video - Questions and Answers
by Professional Trader Marco Mayer
Educator for Forex and Futures, Systematic Trader, and
Creator of Ambush Trading Method, Ambush Signals, and AlgoStrats.com
This is the first part of a series in which Marco answered oft asked trading questions. This episode includes bid/ask spread and discipline in trading
>
© by Marco Mayer. Re-transmission or reproduction of any part of this material is strictly prohibited without the prior written consent of Trading Educators, Inc.
Check out our Blog!
To view previous published Chart Scan newsletters, please log in or click on "Join Us,"
shown above, to subscribe to our free "Members Only" section.
A WEALTH OF INFORMATION & EDUCATION:
Joe Ross-Trading Educators' popular free Chart Scan Newsletter has been published since 2004.
Note: Unless otherwise noted, all charts used in Chart Scan commentary were created
by using Genesis Financial Technologies' Trade Navigator (with permission).
Legal Notice and Copyright 2017 Disclaimer - Published by Trading Educators, Inc.
Chart Scan is a complimentary educational newsletter.


