
Edition 701 - November 17, 2017

30% Off All Products and Services!
Coupon Code
stuffed30
Use during checkout expires midnight U.S. Central time on November 26, 2017

Chart Scan with Commentary - Consolidation Part 7
by Master Trader Joe Ross
Author, Trader, Trading Mentor, and Founder of Trading Educators, Inc.
Developer of Instant Income Guaranteed
Last week we completed the construction of a trading envelope in the 30-year Treasury Bond. The next step is to go back to find out the earliest time we could have constructed the envelope.
I submit that it must be once prices are seen to be in congestion (11-20 bars).
Looking at the chart we see that congestion could actually be defined as 10 bars, all having either Opens or Closes within the trading range of a single measuring bar, comprising a total of 11 bars. That, then, is the earliest point in time at which an envelope could have been constructed.

© by Joe Ross. Re-transmission or reproduction of any part of this material is strictly prohibited without the prior written consent of Trading Educators, Inc.
30% Off All Products and Services!
Coupon Code
stuffed30
Use during checkout expires midnight U.S. Central time on November 26, 2017
Trading Article - Fitting it all together Part 3
by Master Trader Joe Ross
Author, Trader, Trading Mentor, and Founder of Trading Educators, Inc.
Developer of Instant Income Guaranteed
When a trend begins, always question its durability.
Traders who are in the market for the greater wins are wise to incorporate, when possible, seasonal factors, fundamental factors, technical analysis, and chart analysis. Among those who do, some start with seasonal research and then draw on fundamental knowledge or technical and chart reading expertise to help measure risk and confirm or deny potential reward. Others start instead from a fundamental or technical perspective, and then analyze the seasonal path of least resistance. It’s also important to realize that seasonality is not always on time; seasonal factors can come early or late. The same thing is true of cycle turning points, they, too, can come early or late.
In this issue of Chart Scan, let’s think for a moment about the effects of interest rates. If the Federal Reserve is concerned that a heated economy is stimulating inflationary pressure, the FED will launch a series of rate increases designed to slow growth. The strategy may have its intended effect. But once the strategy begins, you can expect a series of rate increases. However, it would be insane to increase rates when the economy is deflationary. Increasing rates will only make things worse.
When a cooling economy eases pressure on interest rates, financial instruments typically rally. Therefore, a fundamental outlook may encourage tentative long positions in interest rate futures. A trader who first refers to seasonal research before making final trading decisions finds that interest rates tend to peak in April/May, and generally decline into the fourth quarter. What we have observed over the years is that futures all along the yield curve tend to begin trending higher in May/June, which impacts the September Treasury Bonds and moves them higher.
Because big money is most concerned with long-term survival and advantage, trends in interest rates are usually confirmed by two spread characteristics: instruments at the long end of the yield curve outperform the short end, and deferred contracts outperform nearby contracts. A tentatively bullish fundamental trader who considers spreads to be a low-risk alternative to an outright position might find opportunity in certain seasonal spreads. One that you might want to think about for the future is Long June of the following year and Short September of the current year in Eurodollars. There may still time to consider this spread, depending upon when you receive this issue of Chart Scan. You might also consider Long June two years ahead, and short September of next year.
© by Joe Ross. Re-transmission or reproduction of any part of this material is strictly prohibited without the prior written consent of Trading Educators, Inc.
30% Off All Products and Services!
Coupon Code
stuffed30
Use during checkout expires midnight U.S. Central time on November 26, 2017

Instant Income Guaranteed - SLCA Trade
Philippe Gautier: Administration and New Developments
Developer: Joe Ross
On 7th November 2017 we gave our Instant Income Guaranteed subscribers the following trade on U.S. Silica Holdings Inc. (SLCA). We sold price insurance as follows:
- On 8th November 2017, we sold to open SLCA Dec 15 2017 27P @ 0.25$, with 37 days until expiration and our short strike about 22% below price action.
- On 9th November 2017, we bought to close SLCA Dec 15 2017 27P @ 0.10$, after only 1 day in the trade for quick premium compounding.
Profit: 15$ per option
Margin: 540$
Return on Margin annualized: 1,013.89%
Return on Principal annualized: 202.78%
Philippe

Receive daily trade recommendations - we do the research for you!
♦ SIGN UP TODAY! THIS IS WORTH THE INVESTMENT ♦
© by Joe Ross and Philippe Gautier. Re-transmission or reproduction of any part of this material is strictly prohibited without the prior written consent of Trading Educators, Inc.
30% Off All Products and Services!
Coupon Code
stuffed30
Use during checkout expires midnight U.S. Central time on November 26, 2017

Trading Blog Post - Being in a Positive State of Mind
by Professional Trader Andy Jordan
Educator for Spreads, Options, Swing/Day Trading, and
Editor of Traders Notebook Complete and Traders Notebook Outrights
Find out which mood is the best choice when trading. Read more.
© by Andy Jordan. Re-transmission or reproduction of any part of this material is strictly prohibited without the prior written consent of Trading Educators, Inc.
30% Off All Products and Services!
Coupon Code
stuffed30
Use during checkout expires midnight U.S. Central time on November 26, 2017

Trading Article - Trade Managemnt: Locking in Windfall Profits
by Professional Trader Marco Mayer
Educator for Forex and Futures, Systematic Trader, and
Creator of Ambush Trading Method, Ambush Signals, and AlgoStrats.com
I have another real-world example of manual trade management for you this week.
It’s a day trade in GBP/USD I found myself in a couple of days ago. The GBP has been a really nice market to trade lately providing plenty of swings and volatility.
The plan was to get in at a price level where I expected buyers to come into the market around 1.3070, using a relatively tight stop of 20 pips. I had no clear profit target for the trade but wasn’t expecting more than a decent bounce. I also was aware that the market might run into trouble around 1.3120 so I knew I had to watch closer should it approach that level.
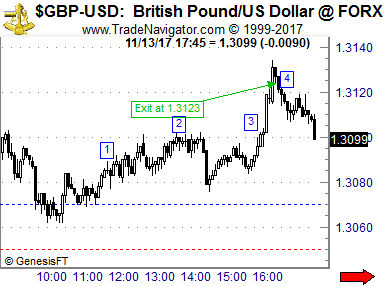
Here’s what happened. I got my fill at 1.3070 and shortly after the pound showed me that I wasn’t completely wrong with my idea. Once prices had moved to 1) (see chart) I moved the stop below the lowest low since I got in to 1.3060 to reduce the risk by 50%.
At 2) I was up quite nicely already and moved my stop just slightly below the entry price at to 1.3068. After that prices consolidated between 1.3080 and 90 for a while. Until at 3) prices started to move and exploded about 40 pips within minutes to the upside. This I hadn’t expected, probably some news hit the market.
Now 40 pips isn’t a totally crazy move but I had expected this to take hours so this has been a windfall profit at that point. What to do now? I’ve been up about 60 pips with an initial risk of 20 pips. That’s more than I had been looking for so I could have simply closed out the trade and take the profit. But as the pound was exploding in a parabolic way without any corrections why not just trail the stop really tight and see how far it goes?
That’s exactly what I did at 4) and so I got stopped out at about 1.3120 with a nice profit of 50 pips.
So one way to deal with windfall profits is to not get greedy and start locking them in more and more tight. The more parabolic the move gets, the more aggressive you might want to move your stop. Especially in the currency markets these moves don’t tend to carry on for too long.
Happy Trading!
Marco
Feel free to email Marco Mayer with any questions, This email address is being protected from spambots. You need JavaScript enabled to view it..
© by Marco Mayer. Re-transmission or reproduction of any part of this material is strictly prohibited without the prior written consent of Trading Educators, Inc.
30% Off All Products and Services!
Coupon Code
stuffed30
Use during checkout expires midnight U.S. Central time on November 26, 2017
Check out our Blog!
To view previous published Chart Scan newsletters, please log in or click on "Join Us,"
shown above, to subscribe to our free "Members Only" section.
A WEALTH OF INFORMATION & EDUCATION:
Joe Ross-Trading Educators' popular free Chart Scan Newsletter has been published since 2004.
Note: Unless otherwise noted, all charts used in Chart Scan commentary were created
by using Genesis Financial Technologies' Trade Navigator (with permission).
Legal Notice and Copyright 2017 Disclaimer - Published by Trading Educators, Inc.
Chart Scan is a complimentary educational newsletter.

