Edition 704 - December 8, 2017


Chart Scan with Commentary - Spread Trade
by Master Trader Joe Ross
Author, Trader, Trading Mentor, and Founder of Trading Educators, Inc.
Developer of Instant Income Guaranteed
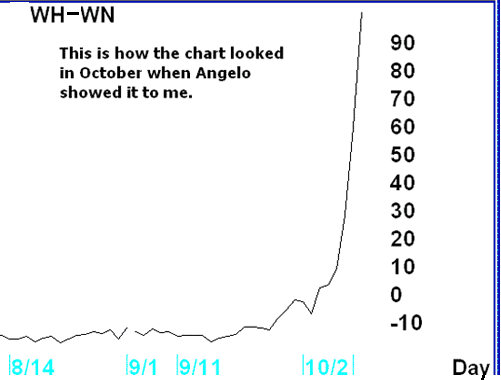
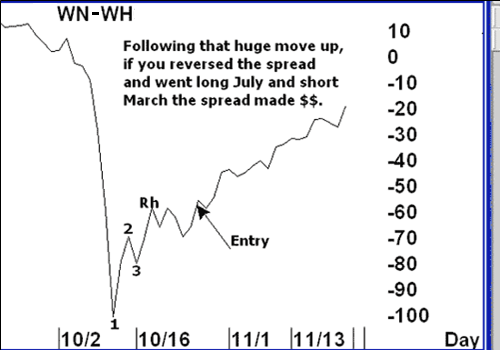
I think many traders should take the time to learn a lot about spread trading. Sometimes I wonder why more people are not trading spreads. There are incredible advantages available for trading them: no stop running, low margins, most efficient use of your capital, more and steeper trends, seasonality, mathematical correlation — the list goes on and on.
I love the spread shown to me by my friend Angelo when we were together in October. Take a look!


Spread trading is quietly kept secret. Why? Because spread trading completely eliminates stop running. Do you think the insiders want you to know that? What would they do if they didn't have your stops to run?. Follow this link to find out more!
© by Joe Ross. Re-transmission or reproduction of any part of this material is strictly prohibited without the prior written consent of Trading Educators, Inc.

Trading Article - Trends
by Master Trader Joe Ross
Author, Trader, Trading Mentor, and Founder of Trading Educators, Inc.
Developer of Instant Income Guaranteed
IS IT TRUE THAT MARKETS TREND ONLY 15% OF THE TIME?
The statement that charts trend only 15% of the time is true only in the most general sense. There is almost always something trending somewhere, in some time frame. Trending means the market is moving from a definable top to a definable bottom, or from a bottom to a top. If traders cannot define the trend on one chart, they should look at another time period chart for the same stock or commodity, where the trend is more evident. You might even consider using tick charts, where each bar represents a certain number of ticks (or pips forex). There are many instances where a tick chart can be set to a number of ticks (pips) that will present a trending market in a market that presents as sideways using time charts. However, be aware that with tick charts you never know when you are going to get a new bar, and that the bars can suddenly change shape.
Believing markets trend only 15% of the time, popularly espoused by market technicians, is in one sense foolish. Long accumulation phases on daily charts, experienced by markets like sugar and silver, may not readily expose their trends until weekly and monthly charts are examined. Once the accumulation phase is identified, traders must wait for valid breakouts to occur before entry. The Latin roots to the word accumulate means to "add to the pile." A cumulus cloud is a pile of water vapor. There are three common congestion phases, and accumulation at the market bottom is one of them. The up move and down move have congestion phases as the market digests previous gains and losses, then usually continues the trend prior to the congestion. Congestion occurrence in the distribution phase, at a market top, is opposite the low range accumulation congestion phase. Congestion phases usually have low volatility and well defined five- to ten-day high and low price ranges, the opposite of the volatile distribution phase at market tops.
© by Joe Ross. Re-transmission or reproduction of any part of this material is strictly prohibited without the prior written consent of Trading Educators, Inc.

Instant Income Guaranteed - TIF Trade
Philippe Gautier: Administration and New Developments
Developer: Joe Ross
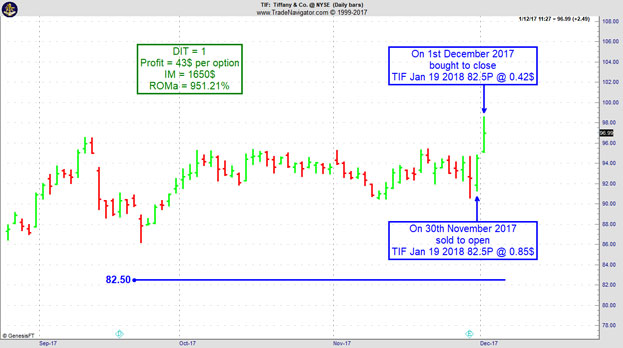
On 29th November 2017 we gave our Instant Income Guaranteed subscribers the following trade on Tiffany & Co (TIF). We sold price insurance as follows:
- On 30th November 2017, we sold to open TIF Jan 19 2018 82.5P @ 0.85$, with 49 days until expiration and our short strike about 11% below price action.
- On 1st December 2017, we bought to close TIF Jan 19 2018 82.5P @ 0.42$, after 1 day in the trade for quick premium compounding.
Profit: 43$ per option
Margin: 1650$
Return on Margin annualized: 951.21%
Philippe

Receive daily trade recommendations - we do the research for you!
♦ SIGN UP TODAY! THIS IS WORTH THE INVESTMENT ♦
© by Joe Ross and Philippe Gautier. Re-transmission or reproduction of any part of this material is strictly prohibited without the prior written consent of Trading Educators, Inc.
Trading Article: Is Seasonality the same in all Markets?
by Professional Trader Andy Jordan
Educator for Spreads, Options, Swing/Day Trading, and
Editor of Traders Notebook Complete and Traders Notebook Outrights
You can find seasonality in all markets but I personally think there is a big difference in “reliability” or “strength” of seasonality in the markets. I personally think seasonality is strongest in the commodity markets. In all markets where you have a physical product and a production cycle during the year. Because the production cycle is always the same you get typical seasonal behaviors in these markets. Other markets, like the indices, also show a seasonal pattern but I think it is not as strong as in the commodity markets. Anyway, seasonality is only one criterion besides others and I would never recommend any entry just based on statistics. You have to look at the current chart of the current spread to see what is going on. That’s what we have to trade!
© by Andy Jordan. Re-transmission or reproduction of any part of this material is strictly prohibited without the prior written consent of Trading Educators, Inc.

Trading Article - Who's next in line?
by Professional Trader Marco Mayer
Educator for Forex and Futures, Systematic Trader, and
Creator of Ambush Trading Method, Ambush Signals, and AlgoStrats.com
"Buy low, sell high" is one of the most popular memes in the investment and trading world. And obviously, it does make sense, who wouldn't like to buy low and sell high all the time? I found this to be quite a helpful advice to invest in stocks for example. Wait for a crash, buy it and sell again when prices are back to old highs.
Of course, the problem often is to figure out what's actually a low price and what's a high price. You can also buy high and sell higher to make a profit, which is how trend following works.
So what's the real deal here? I think the actual question to ask is "who's going to buy after me?" or "who's next in line?". Will there be enough traders willing to buy after you did at a higher price? Or if you're short the other way around, will there be sellers standing in line to sell after you did or not?
Think about it. To make a profit that's exactly what needs to happen. If you buy at $100, the only way to make a profit is if there are buyers willing to buy at higher prices. If they don't bid it up after you and you find someone to sell to at a higher price, you won't make a profit. Simple fact most traders are not really aware of.
Obviously, there's always someone who's gonna be the last in line. Someone is going to buy the high of the day/week/month/year/all-time. In poker, there's the popular saying that if you don't know who the patsy is in the round after 30 minutes, it's probably you. That same idea applies to trading. If you don't know why other traders are probably willing to buy at a higher price after you during the day, you might be the last one in the order book to bid at such a high price for today.
Because of that, it's always helpful to ask yourself "Who's gonna buy/sell after me and why?". If you can't answer that question it might be best to skip the trade!
Happy Trading!
Marco
Feel free to email Marco Mayer with any questions, This email address is being protected from spambots. You need JavaScript enabled to view it..
© by Marco Mayer. Re-transmission or reproduction of any part of this material is strictly prohibited without the prior written consent of Trading Educators, Inc.
Check out our Blog!
To view previous published Chart Scan newsletters, please log in or click on "Join Us,"
shown above, to subscribe to our free "Members Only" section.
A WEALTH OF INFORMATION & EDUCATION:
Joe Ross-Trading Educators' popular free Chart Scan Newsletter has been published since 2004.
Note: Unless otherwise noted, all charts used in Chart Scan commentary were created
by using Genesis Financial Technologies' Trade Navigator (with permission).
Legal Notice and Copyright 2017 Disclaimer - Published by Trading Educators, Inc.
Chart Scan is a complimentary educational newsletter.


