Edition 705 - December 15, 2017


Chart Scan with Commentary - Is Crude Oil Putting in a Top?
by Master Trader Joe Ross
Author, Trader, Trading Mentor, and Founder of Trading Educators, Inc.
Developer of Instant Income Guaranteed
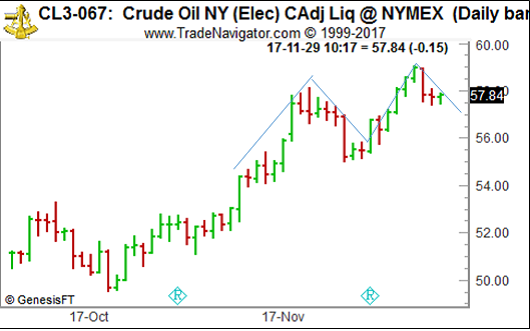
This is a question I am being asked quite often these days. The answer is that I honestly don't know. But from a purely technical analysis point of view, it is. On the daily chart, crude seems to be forming an m-shaped top. Some old-timers would even label it as a left shoulder and a head that could end up with a heads and shoulders top. The neckline seems to be right around 57.00. Of course, all of this is in the eye of the beholder.

What do we see on a daily chart basis via The Law of Charts? Prices are definitely still trending, making higher highs and higher lows. I've marked the /\/\ such as it is, so you can see it as well. So, from the point of view of chart analysis, we appear to have the probability of a top in crude oil, but in actuality prices are still trending.
Will the top form as a sideways price action known as distribution? Again, who knows? I don't even pretend to know. There are too many other factors involved. Crude oil is now a political football, as well as an economic enigma.
As far as the weekly chart is concerned, crude is still in an uptrend, having not broken any uptrend lines.
Can crude oil go much higher? Absolutely! Especially with the uneducated move the U.S. Congress is likely to make if they decide to regulate trading in crude oil.
I do not believe that this is a time to make any kind of definitive decision to short crude oil, but if you can't stand the suspense, maybe you could buy an at-the-money option straddle. Then if/when crude makes up its mind, you simply drop the losing side.
© by Joe Ross. Re-transmission or reproduction of any part of this material is strictly prohibited without the prior written consent of Trading Educators, Inc.

Trading Article - Living With Reality
by Master Trader Joe Ross
Author, Trader, Trading Mentor, and Founder of Trading Educators, Inc.
Developer of Instant Income Guaranteed
If you're like most traders, you expect to win. You put your time and energy into finding high probability setups, and after all the studying, searching, and theorizing, when you think you have come upon a good idea, you want it to work. Unfortunately, the markets don't always cooperate. You have to go where the markets take you. In the end the markets are always right. How do you react when things don't go your way? Do you feel upset? Are you angry? Do you want to get even?
When things don't go your way, it's very human and understandable to feel frustrated and angry. People experience anger when they feel that they have been unfairly wronged. It's easy to get angry while trading the markets. You expect to win. You were counting on winning. And when the markets don't cooperate, you feel a little hurt. Your ego is dinged and you are angry with someone: fate, yourself, imaginary institutional traders who are out to get you. The possibilities are endless. If you want to find someone to be angry with, you can find it, but it isn't very productive.
Anger can be a dangerous emotion when trading the markets. When you feel angry, you are ready to put up a fight. You have a powerful inclination to focus all of your energy and resources on fighting, seeking revenge, and looking for any sign of provocation. It's hard to think clearly when you are angry. Sound decision-making requires you to remain calm, focused, and flexible. There's no reason to be angry at the markets. Here's how you can be less angry at the markets.
First, don't personify the markets. Anger is an interpersonal emotion. We are usually angry with someone because we believe that he or she has purposely tried to harm us. The markets may consist of people making trades, but it doesn't make sense to make up imaginary relationships with the markets. There is nothing that is personal going on. You are merely making it personal, and taking setbacks personally, as if someone were out to wrong you. The people participating in the markets may engage in actions that thwart your goals, but their actions are not directed toward you personally. It is best to look at the markets as an abstract impersonal entity. Pretend you are playing a videogame. The more impersonal you can make trading, the better you will feel, and the more profits you'll realize.
Second, don't expect anything to go your way. Practice radical acceptance. Whatever happens, happens, and there is little you could have done to change things. (All you can do is limit your risk.) Anger is felt when our expectations have been shattered. One expects to profit from a trade, and when the profits are not realized, he or she may become angry, seek revenge, and want to get even. However, it isn't useful to have high expectations in the markets. Don't depend on the markets to fulfill your goals or meet your expectations. Assume that anything can happen. Indeed, in dealing with the markets, it's almost a given that you will lose money, so it is not useful to expect to make money on every trade. Just accept what you can get. Using this thinking strategy will make you feel calm.
The more you can stay calm while trading the markets, the more profitably you will be. Don't get frustrated, angry or upset. Take all setbacks in stride and enjoy the process of trading. You'll find you'll be calmer, focused, and more profitable.
© by Joe Ross. Re-transmission or reproduction of any part of this material is strictly prohibited without the prior written consent of Trading Educators, Inc.

Instant Income Guaranteed - CSX Trade
Philippe Gautier: Administration and New Developments
Developer: Joe Ross
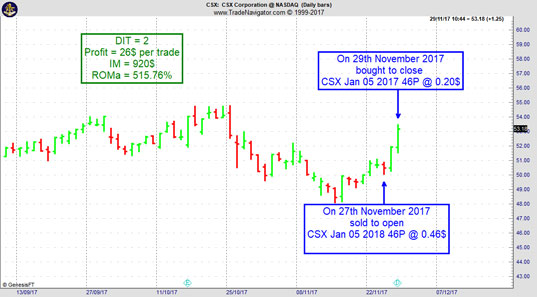
On 26th November 2017 we gave our IIG subscribers the following trade on CSX Corporation (CSX). We sold price insurance as follows:
- On 27th November 2017, we sold to open CSX Jan 05 2018 46P @ 0.46$, with 38 days until expiration and our short strike about 8% below price action.
- On 29th November 2017, we bought to close CSX Jan 05 2018 46P @ 0.20$, after 2 days in the trade for quick premium compounding.
Profit: 26$ per option
Margin: 920$
Return on Margin annualized: 515.76%
Philippe

Receive daily trade recommendations - we do the research for you!
♦ SIGN UP TODAY! THIS IS WORTH THE INVESTMENT ♦
© by Joe Ross and Philippe Gautier. Re-transmission or reproduction of any part of this material is strictly prohibited without the prior written consent of Trading Educators, Inc.
Trading Idea: 1000*CLN18 – 420*HON18
by Professional Trader Andy Jordan
Educator for Spreads, Options, Swing/Day Trading, and
Editor of Traders Notebook Complete and Traders Notebook Outrights
This week, we're looking at 1000*CLN18 – 420*HON18: long July 2018 Crude Oil and short July 2018 Heating Oil (NYMEX on Globex).

Today we consider a Cotton calender spread: long July 2018 Crude Oil and short July 2018 Heating Oil (NYMEX on Globex). After being in a long down-trend, it looks like the spread might want to turn around to the up-side following its seasonal pattern. While the 15 year seasonal pattern shows an up-trend between October and January, the 5 year seasonal pattern shows the start of the seasonal up-move at the beginning of December. Energy spreads using two different markets (so called inter-market spreads) are usually very volatile and therefore need a wide stop. A risk of at least $1,500/spread seems to be appropriate for this spread. Please Note: because Crude Oil and Heating Oil have a different value per price tick we need to multiply the buy side by 1,000 and the sell side by 420 to plot the correct equity chart. The spread is 1:1.
Learn how we manage this trade and how to get detailed trading instructions every day!
Please visit the following link:
Yes, I want additional information!
© by Andy Jordan. Re-transmission or reproduction of any part of this material is strictly prohibited without the prior written consent of Trading Educators, Inc.

Trading Article: 5-Year T-Notes keep on trending in perfect Ambush Rhythm!
by Professional Trader Marco Mayer
Educator for Forex and Futures, Systematic Trader, and
Creator of Ambush Trading Method, Ambush Signals, and AlgoStrats.com
One of the best performing Ambush markets this year has been the 5-Year T-Notes Future (ZF). Actually its performance just hit new all-time-highs!
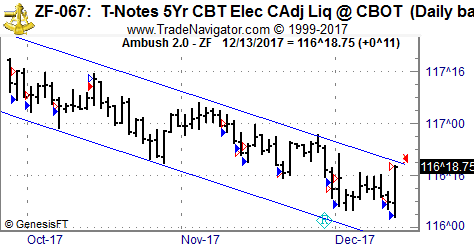
The interesting part here is that this market actually has been trending most of the time. While it’s been in an uptrend during the first part of the year, it’s now been trending lower in an almost perfect channel:

Now as you probably know, Ambush is a mean-reversion method so how is this possible? The answer is that Ambush is hitting that sweet spot of getting into trades usually towards the end of an up- or downswing in the markets and stays in only for a single day.
At the same time this market has been trending lower rather slowly. This creates a very nice environment for Ambush to trade in. Meaning ZF and Ambush are in perfect sync and having a really nice dance!
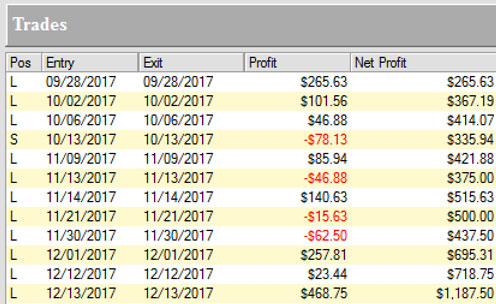
Here’s the trade details of all trades visible on the chart and as you can see ZF is quite a small contract you can trade nicely even with a small account:

Become an Ambush Trader today!
Simply sign up to Ambush Signals. It does all the work for you, allows you to customize what markets you want to see and has a position sizing tool implemented to automatically adjust the positions to your risk preferences.
Each day around 6:30 PM NY Time (yes, it's ready much earlier now than before) the Signals are available for you on the Dashboard. You can then place your orders and literally walk away until the markets close! Can you imagine a more comfortable way to day trade?
Ambush eBook
Now if you’d prefer to rather generate the signals on your own and want to know the exact trading rules of Ambush, you want to get the Ambush eBook. Here’s a hint: we’ve already significantly raised the price of eBook last year and probably we’ll do the same soon in 2018. So if you’re interested in buying the eBook, go for it now.
Happy Trading!
Marco
Feel free to email Marco Mayer with any questions, This email address is being protected from spambots. You need JavaScript enabled to view it..
© by Marco Mayer. Re-transmission or reproduction of any part of this material is strictly prohibited without the prior written consent of Trading Educators, Inc.
Check out our Blog!
To view previous published Chart Scan newsletters, please log in or click on "Join Us,"
shown above, to subscribe to our free "Members Only" section.
A WEALTH OF INFORMATION & EDUCATION:
Joe Ross-Trading Educators' popular free Chart Scan Newsletter has been published since 2004.
Note: Unless otherwise noted, all charts used in Chart Scan commentary were created
by using Genesis Financial Technologies' Trade Navigator (with permission).
Legal Notice and Copyright 2017 Disclaimer - Published by Trading Educators, Inc.
Chart Scan is a complimentary educational newsletter.


