Edition 858
December 4, 2020

A Very Special Thank You to Andy Jordan. Andy managed Traders Notebook for over 20 years and is now focusing on Private Mentoring. He studied under Joe Ross since 2002 and closely follows his trading philosophy. Check out all of our Private Mentoring offered by Trading Educators.
FINAL ARTICLE IN THIS SERIES - ENJOY!
Introduction to a Series on Technical Analysis
This week’s chart scan is a continuation of a series of very basic technical analysis concepts. I’m not a big fan of technical analysis, but I have to admit that I cut my trading teeth using it. Eventually, I came to believe there is a time and place for any and all tools. If something can help you understand the markets and how to trade them, I’m all for it.
There are many beginning traders who read Chart Scan, and over the years I have had many questions from them concerning technical analysis. Instead of giving you an article on the psychological aspects of trading, the next several issues of chart scan will feature articles on technical analysis. My hope is that where and whenever possible, I will show you the right way to use this type of analysis.
Keep in mind, the only real truth on a price chart is price itself. With that in mind and keeping price always in the forefront we can begin taking a look at some tools that fit into the category of technical analysis.

Master Trader Joe Ross
Author, Trader, Trading Mentor, and Founder of Trading Educators, Inc.
Developer of Instant Income Guaranteed
Chart Scan with Commentary: Lesson from the Past
Sugar prices broke out of an extended trading range on September 27, 2004. Almost immediately prices began to form a nine bar ledge with matching highs at 9.10 and matching lows at 8.87 and 8.86. The Law of Charts states that a ledge formation must contain at least four price bars, but no more than ten price bars. Prices broke out to the upside of the ledge on the tenth bar (October 11, 2004), and were followed the next day with the recent high.
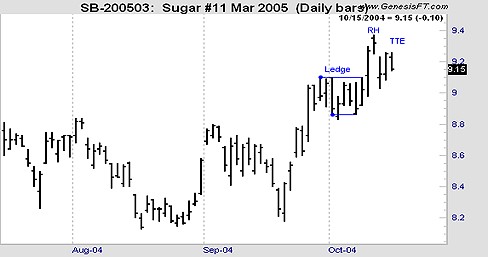
The Law of Charts states that the first failure of prices to continue in the direction they were going subsequent to the breakout of a ledge constitutes a Ross hook. There was a double high Traders Trick entry to go long showing on the chart. A breakout one tick above the double high at 9.26 offers a consideration to buy at 9.27.
Notice also that entry on the breakout from a ledge is taken only in the direction of the previous trend or swing.
This is the most requested recorded webinar, The Law of Charts.
Through this recorded webinar The Law of Charts, we will show how YOU how to win consistently in any market and in any time frame. What it takes to create charts that exactly fit your trading style and level of comfort. The content of this intensive, in-depth recorded webinar takes the "The Law of Charts" to the next step. You'll feel like your attending a private seminar with Joe Ross himself.
PURE SIMPLICITY - LEARN JOE'S WAY TODAY!
CLICK HERE
© by Joe Ross. Re-transmission or reproduction of any part of this material is strictly prohibited without the prior written consent of Trading Educators, Inc.

Master Trader Joe Ross
Author, Trader, Trading Mentor, and Founder of Trading Educators, Inc.
Developer of Instant Income Guaranteed
Trading Article: Oscillators
Oscillators tend to be somewhat misunderstood in the trading industry, despite their close association with the all-important concept of momentum. At its most fundamental level, momentum is actually a means of...read more.
© by Joe Ross. Re-transmission or reproduction of any part of this material is strictly prohibited without the prior written consent of Trading Educators, Inc.
Philippe Guartier: Administration and
New Developments of Instant Income Guaranteed
Instant Income Guaranteed - SCPL TRADE
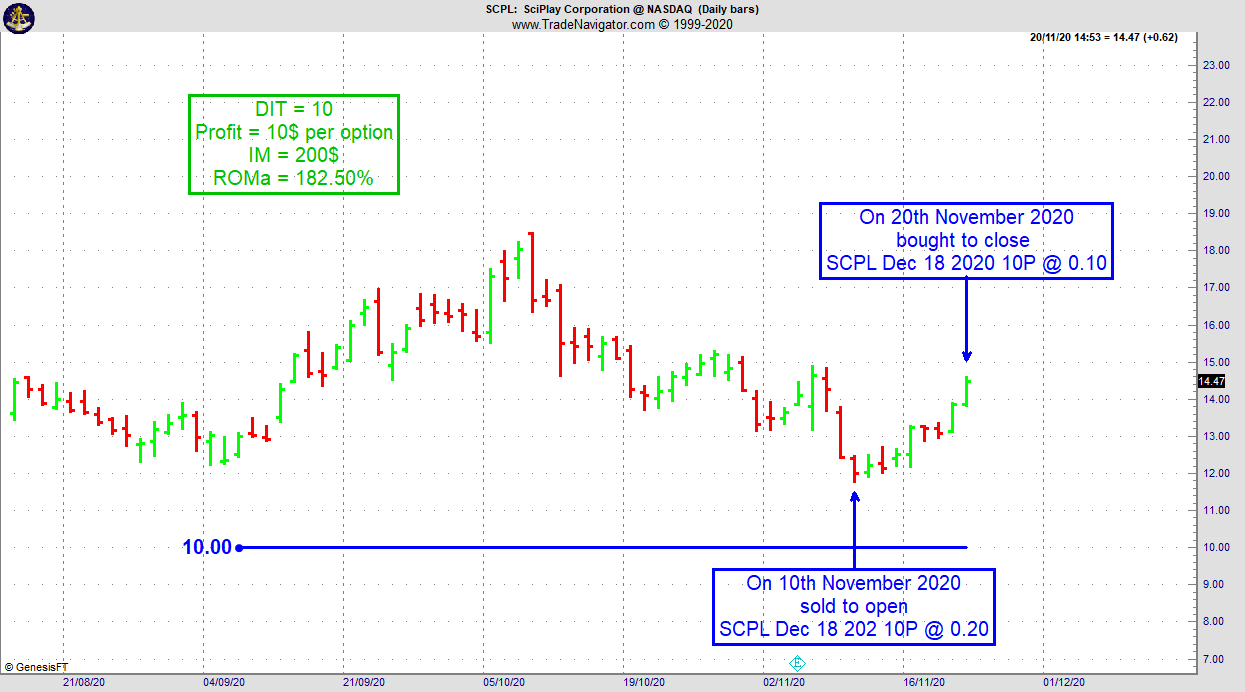
On 5th November 2020 we gave our Instant Income Guaranteed subscribers the following trade on SciPlay Corporation (SCPL). Price insurance could be sold as follows:
- On 10th November 2020, on a GTC order, we sold to open SCPL Dec 18 2020 10P @ 0.20, with 38 days until expiration and our short strike about 32% below price action.
- On 20th November 2020, we bought to close SCPL Dec 18 2020 10P @ 0.10.
Profit: 10$ per option
Margin: 200$
Return on Margin annualized: 182.50%
Philippe
TRADING SUCCESSES EMAILED TO YOU DAILY!
~ WE DO THE RESEARCH FOR YOU ~
CLICK HERE TO Learn More! Instant Income Guaranteed
© by Joe Ross and Philippe Gautier. Re-transmission or reproduction of any part of this material is strictly prohibited without the prior written consent of Trading Educators, Inc.

Professional Trader Andy Jordan
Educator for Spreads, Options, Swing, and Day Trading, and Editor for 20+ years with Traders Notebook, a daily advisory newsletter.
Trading Article: Single-Lot-Strategy
Because some markets are very "expensive" and do not offer a mini or micro contract, many traders have to stick to a single contract once in a while.
In this case, you might trade a single-lot strategy. Finding the right target for a single-lot strategy is tricky and depend on your general trading strategy. You have to study your...read more.
Andy Jordan wants you to learn trading and highly recommends that you invest in yourself. Private mentoring with Andy is the first step to learning about trading, his students find this very helpful and accelerates their trading successes.
Private Mentoring with Andy Jordan – Sign Up Today
© by Andy Jordan. Re-transmission or reproduction of any part of this material is strictly prohibited without the prior written consent of Trading Educators, Inc.

Professional Trader Marco Mayer
Educator for Forex, Futures and Systematic Trader
Creator of Ambush Trading Method, Ambush Signals, and Head of AlgoStrats.com
Gold-Rush: Over $10,000 profit with a Day Trade in the Gold Future?!
One of the top markets over the last couple of months for Ambush Traders has been the gold market. Whether it's the Gold Future, Micro-Future, or XAU/USD forex pair, Ambush Traders are in a crazy gold rush!
Here's a daily chart of the Gold Future (GC, traded at CME), showing the last couple of months of trading. As you can see this market did what markets do 90% of the time, which is why Ambush is such a great trading method. Markets move in boxes/ranges, break out for a few days and then start moving in the next box. Gold has been in huge boxes almost all of the time and so Ambush Traders had a lot of great opportunities!
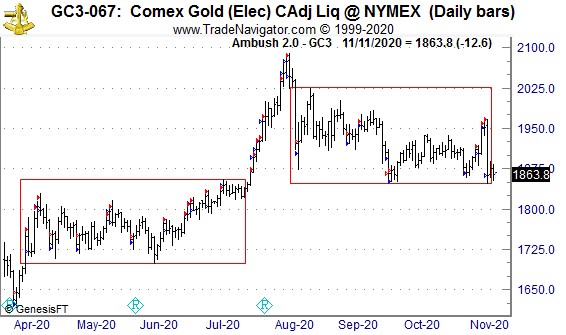
Here are the results of these trades, trading only one Gold Future (GC) contract:
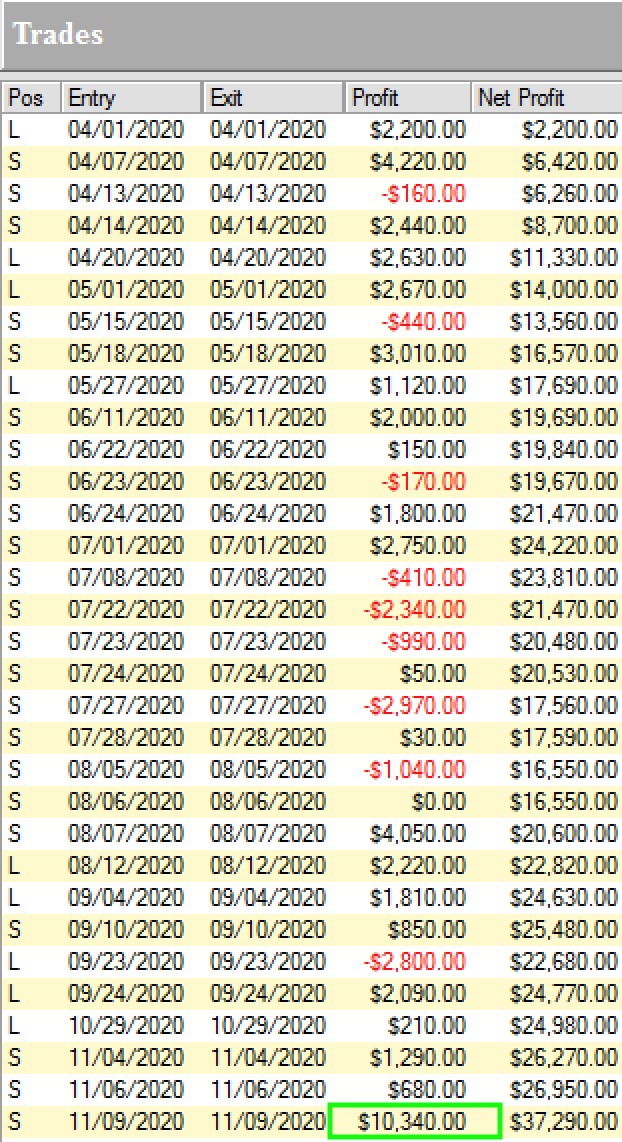
Yup, that's almost $40k profits with almost no drawdowns in between within just a couple of months! And yes we did catch one of the largest moves ever in the gold market on 9th November making OVER $10k with a DAY TRADE!
Now the Gold Future is a large contract and not suitable for small accounts. But you can do these trades also in the E-Micro Gold which is just 1/10 the size or the XAU/USD forex pair.
That's what makes Ambush Signals so great, it works with any account size offering three subscription models depending on your goals.
Notice that all of these are actually day trades, even though they're based on end-of-day trading decisions. Ambush is exactly that, an easy way to day trade not for a few tiny ticks with a lot of stress but placing your trades once a day, walk away, and go for the big intraday moves!
Don't miss the next Gold trade and join Ambush Signals today!
Happy Trading!
Marco
The Ambush Trading System was created in 2007 by Marco Mayer. Since then it proved itself in the markets for over a decade and did so with exceptional results. It's the only trading system we're aware of that is still going strong after so many years. While Ambush is a day trading system, meaning you will always enter and exit on the same trading day - you don't have to sit in front of your trading screen. You simply place your entry orders when the trading session starts and come back at the close!
© by Marco Mayer. Re-transmission or reproduction of any part of this material is strictly prohibited without the prior written consent of Trading Educators, Inc.
WE APPRECIATE YOUR TRUST IN US
THANK YOU FOR YOUR BUSINESS!
Check out our Blog!
To view previous published Chart Scan newsletters, please log in or click on "Join Us,"
shown above, to subscribe to our free "Members Only" section.
A WEALTH OF INFORMATION & EDUCATION:
Joe Ross-Trading Educators' popular free Chart Scan Newsletter has been published since 2004.
Note: Unless otherwise noted, all charts used in Chart Scan commentary were created
by using Genesis Financial Technologies' Trade Navigator (with permission).
Legal Notice and Copyright 2020 Disclaimer - Published by Trading Educators, Inc.
Chart Scan is a complimentary educational newsletter.


