Trading Educators Blog
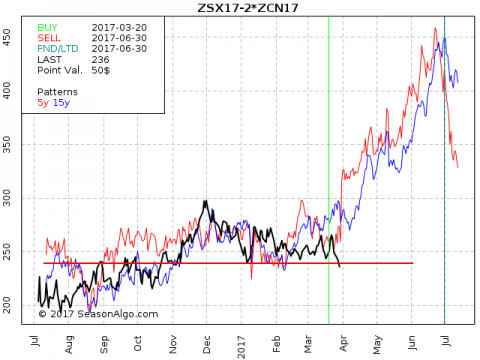
Today I am looking at a so called ratio spread: Long 1 November Soybean and short 2 July Corn. The spread looks interesting to me because it is trading at a level where it could turn around again and follow its seasonal pattern to the up-side. The current level (approx. 235) has provided support several times. The seasonal statistic looks promising as well, with 17 winning trades in a row. But thi...
Optimized entry (green vertical line on the chart below) or exit (red vertical line on the chart below) is part of seasonal patterns. For example: the spread X–Y shows a strong seasonal up move in July with an optimized entry date on July 3 and an optimized exit date on July 28. This means “usually” the spread moves up between July 3 and July 28, but this is just based on statistical data of the p...
Not many traders are familiar with futures spread trading. Even fewer traders understand multi-leg spreads. However, trading these types of spreads is as easy as trading an outright futures contract. Below is a 3-leg butterfly spread in Lean Hogs that we recently closed out in Traders Notebook: short one contract in June and in August, 2016, and long 2 contracts in July, 2016. The blue line on the...


