Edition 714 - February 16, 2018

Trading Article - Stress or just Excitement
by Professional Trader Andy Jordan
Educator for Spreads, Options, Swing/Day Trading, and
Editor of Traders Notebook Complete and Traders Notebook Outrights
There is a tendency to become overemotional when trading. Overcoming the propensity to play emotionally requires a conscious commitment to specific trading objectives. This entails choosing a target, developing a strategy, and finding a method for adhering to it. A goal enables you to keep a relatively even keel through good and bad periods, to sustain momentum, and to keep from becoming bored.
Of course, most traders enjoy the process of building up profits, the satisfaction of adept trading, or simply outwitting the crowd. But it is not just the outcome that is important, it is also the process. The tension that accompanies being in the market is an integral part of the overall experience. For profit without risk or loss without care drains much of the pleasure out of the trading process.
Can it hurt your health? I really can’t say. The wrong kind of stress is known to be harmful to your health, but some stress is what makes you perform at your best.
Andy Jordan is the editor for Traders Notebook which shows you Futures Trading Strategies in Spreads, Options, and Swing Trades. Learn step-by-step how to trade successfully.
Click Here - Traders Notebook
Yes, I want additional information!
© by Andy Jordan. Re-transmission or reproduction of any part of this material is strictly prohibited without the prior written consent of Trading Educators, Inc.

Chart Scan with Commentary - Lesson from the Past—Trend vs Congestion
by Master Trader Joe Ross
Author, Trader, Trading Mentor, and Founder of Trading Educators, Inc.
Developer of Instant Income Guaranteed

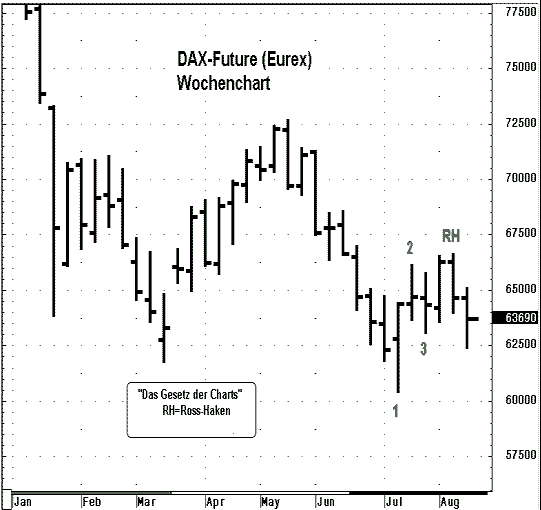
Viewing the chart above, are prices trending or are they consolidating? This kind of question comes up often. According to The Law of Charts, there is a defined trend showing on the chart. But which kind of trend? Is it an uptrend or a downtrend, and how can you tell which it is?
The Law of Charts states that trend supersedes any form of consolidation. That means if you find a trend within an area of consolidation, you must assume prices are trending. At Trading Educators, we call consolidations of 11 to 20 bars "congestion," and consolidations of 21 or more bars "trading ranges" However, in the chart above, if I count from the low marked "1," or even if I count from 3 bars prior to the low marked "1" until the last bar shown, we have nothing visible that can be called either congestion or a trading range. So what do we have?
The chart reveals a correctly marked 1-2-3 low formation. Following the breakout of the #2 point of a 1-2-3 low formation, any failure of prices to move higher is a Ross Hook (RH).
The Law of Charts states that if prices violate the #2 point of a 1-2-3 low formation, we have a defined trend. It further states that if prices were to violate the high or the RH, we would have an established trend.
So based on The Law of Charts, we are looking at a defined uptrend. If prices were to violate the RH we would have an established uptrend, but that has not taken place based on the current chart view. I think the rest of the chart can be quite easily understood, even though it is in German. "Wochenchart" just means "weekly chart." "Das Gesetz der Charts" means "The Law of Charts." "Ross-Haken," means "Ross Hook."
What I like best is that in any language, a chart is a chart. For those who might not know, the DAX is traded at the Eurex Exchange.
© by Joe Ross. Re-transmission or reproduction of any part of this material is strictly prohibited without the prior written consent of Trading Educators, Inc.

Trading Example: Instant Income Guaranteed
Philippe Gautier: Administration and New Developments
Developer: Joe Ross
TRADE WITH NO LOSSES
Here's our latest example!
LITE Trade
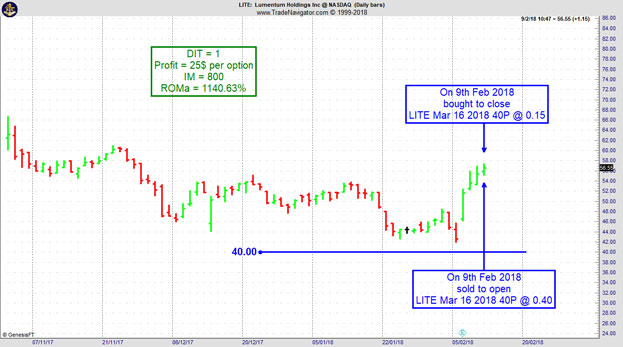
The recent wild jumps in implied volatility can be a disaster for price insurance sellers, or an opportunity for quick profits. On 8th February 2018 we gave our Instant Income Guaranteed subscribers the following trade on Lumentum Holdings Inc (LITE). Price insurance could be sold as follows (not everybody was filled on this one):
- On 9th February 2018, we sold to open LITE Mar 16 2018 40P @ 0.40$ (on a GTC order), with 37 days until expiration and our short strike about 28% below price action, making the trade quite safe.
- About 10 minutes later, we bought to close LITE Mar 16 2018 40P @ 0.15$, for ultraz quick premium compounding.
Profit: 25$ per option
Margin: 800$
Return on Margin annualized: 1140.63%
Philippe

Receive daily trade recommendations - we do the research for you.
♦ SIGN UP TODAY! THIS IS WORTH THE INVESTMENT ♦
Learn More!
Instant Income Guaranteed
© by Joe Ross and Philippe Gautier. Re-transmission or reproduction of any part of this material is strictly prohibited without the prior written consent of Trading Educators, Inc.

Trading Video - Outside Bars in the Russell 2000 Mini Future
by Professional Trader Marco Mayer
Educator for Forex and Futures, Systematic Trader, and
Creator of Ambush Trading Method, Ambush Signals, and AlgoStrats.com
In this video Marco has a look at the "Outside Bars" pattern as an entry signal. He shows you how if it works as an entry signal in the Russell 2000 Mini Future and how to evaluate entry signals in general by using a systematic approach.
Happy Trading!
Marco
Feel free to email Marco Mayer with any questions, This email address is being protected from spambots. You need JavaScript enabled to view it..
© by Marco Mayer. Re-transmission or reproduction of any part of this material is strictly prohibited without the prior written consent of Trading Educators, Inc.
To view previous published Chart Scan newsletters, please log in or click on "Join Us,"
shown above, to subscribe to our free "Members Only" section.
A WEALTH OF INFORMATION & EDUCATION:
Joe Ross-Trading Educators' popular free Chart Scan Newsletter has been published since 2004.
Note: Unless otherwise noted, all charts used in Chart Scan commentary were created
by using Genesis Financial Technologies' Trade Navigator (with permission).
Legal Notice and Copyright 2018 Disclaimer - Published by Trading Educators, Inc.
Chart Scan is a complimentary educational newsletter.


