Edition 717 - March 9, 2018


Chart Scan with Commentary - Trading Strategies
by Master Trader Joe Ross
Author, Trader, Trading Mentor, and Founder of Trading Educators, Inc.
Developer of Instant Income Guaranteed
There are countless trading strategies available for all markets. Whether you trade stocks, forex, futures, or CFDs, there are one or more trading strategies that will fit your risk tolerance and trading style.
Most important is to first know and understand your personal risk tolerance. This is an absolute “must´ decision for every trader, a decision you have to make before you ever attempt to use any of the available trading strategies.
What exactly would put you out of the trading business, in the event things went against you? How much risk can you handle emotionally, psychologically, and financially? What would completely demoralize you, and cause you to give up trading? If you haven’t figured that out, then stop right now—get your thoughts together—and make that all-important decision before you ever attempt to use any of the possible trading strategies.
Once you have determined your personal risk tolerance, you are ready for the next step—matching the strategy, market, and time frame to your risk tolerance. You must discard any of the trading strategies that do not match up.
Let’s look at an example of matching trading strategies to personal risk tolerance.
Let’s assume you want to make a trade in gold. You can make this trade in the futures market, via an ETF in the stock market, or using a CFD. The CFD could possibly be used to trade either futures or shares in an ETF.
After assessing your personal risk tolerance you decide all you can handle is a $1,000 loss.
In futures, if you trade 5 contracts, and lose $200 per contract it would amount to a $1,000 loss overall. Four lots would equal $800. Two lots would equal $400. If you are trading something other than futures, decide how many shares it would take to equal the amount you are willing to lose, if the price per share should happen to drop.
Next, let’s take one strategy of the many trading strategies available. One strategy available to us we call “gimmee bars.” Gimmee bars overall yield 80% winning trades if traded properly. A gimmee bar is a reversal bar that touches or exceeds 2-Standard Deviations from a moving average of the Closes. A reversal bar is one that opens and closes opposite to the direction prices were moving
![]() Using a 20 bar moving average and 2-Standard Deviations, we can set up a study called “Bollinger Bands” to determine an entry point and the amount of risk we would have to take.
Using a 20 bar moving average and 2-Standard Deviations, we can set up a study called “Bollinger Bands” to determine an entry point and the amount of risk we would have to take.

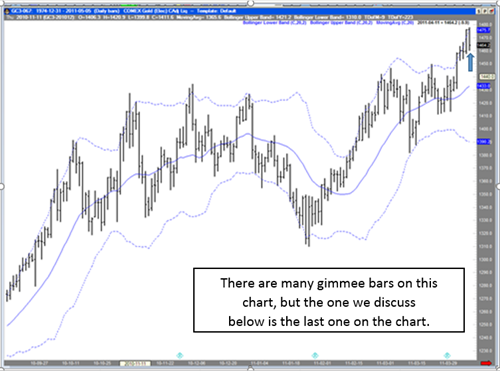
The chart we’re looking at is a daily chart of gold on April 12. The arrow on the chart points to a Gimmee Bar. Gimmee Bars are one of the oldest, and most reliable trading strategies around. Prices had been rising, had reached the upper Bollinger Band, and had reversed direction by closing lower than it had opened.
How do we calculate the risk?
The upper band was at 1475.70. The moving average was at 1433.10. The difference was 42.7 points. A point in gold futures is $100. The risk was $4,270 of volatility between the moving average and the upper Bollinger Band. As a rule, we risk only half the volatility when making a trade. Still $2,135 is too much to risk if our risk tolerance is $1,000. The risk on the daily gold chart is too great. We cannot handle even one contract. We are unable to match our risk tolerance to the risk in the market.
We now have to make a choice:
- Find another market to trade using this trading strategy.
- Move to a lower time frame in gold if we want to use this strategy.
- Use another of the trading strategies that may be available to us.
Let’s say in this example we move to a lower time frame. We’ll try to find the same thing happening on or closely following April 12 on a 60-minute chart.
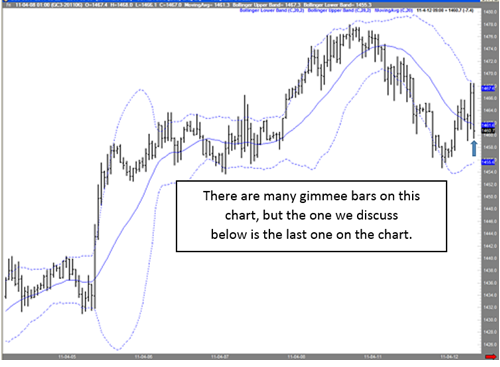
At 9AM on April 12, prices touch the upper Bollinger Band and then reverse.

The upper band is at 1467.60 and the moving average is at 1461.60. The volatility between the upper band and the moving average is 6 points, or $600. Half of that amount is $300. The strategy calls for us to sell on the next bar at the low price of the gimmee bar. We can sell 3 contracts, risking $300 per contract, and still be within our personal risk tolerance. We have successfully matched our personal risk tolerance to the risk in the market. At the same time, we have positioned-sized the trade to 3 contracts, risking $900 in all.
Any one of the many trading strategies available to traders can be used following the principle of matching personal risk tolerance to the amount of risk in the market.
© by Joe Ross. Re-transmission or reproduction of any part of this material is strictly prohibited without the prior written consent of Trading Educators, Inc.

Trading Example: Instant Income Guaranteed
Philippe Gautier: Administration and New Developments
Developer: Joe Ross
TRADE WITH NO LOSSES
Here's our latest example!
WDC Trade
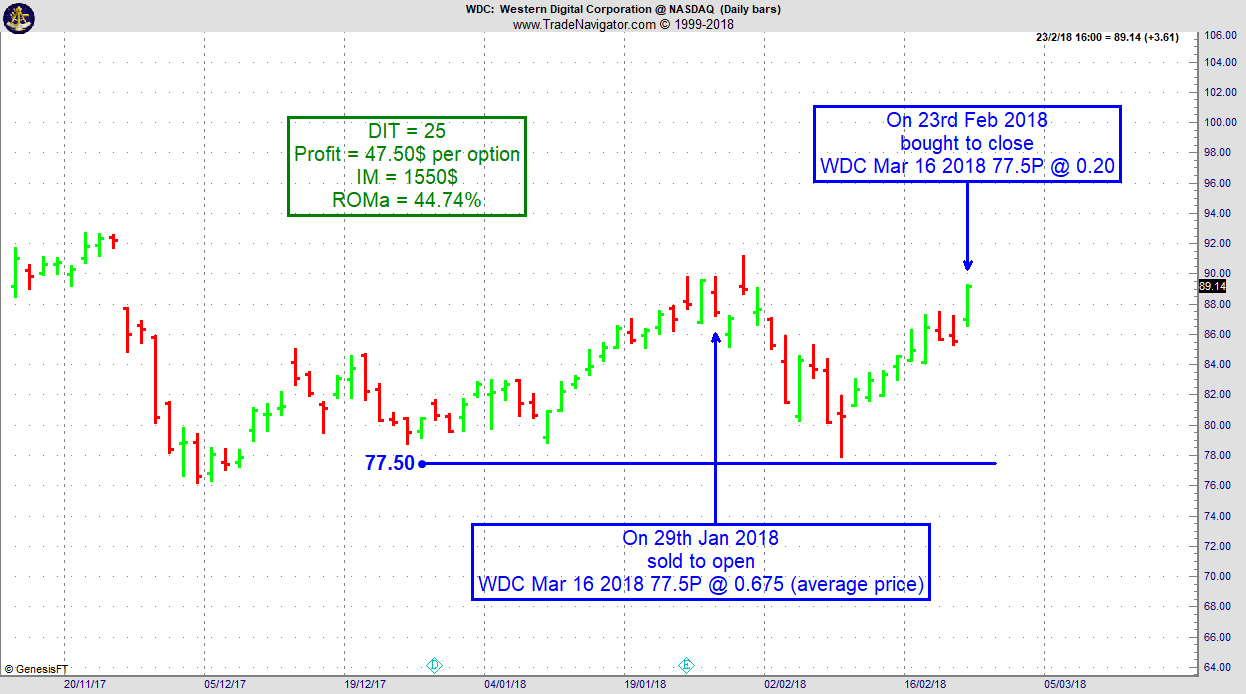
Here is another recent example where, when the put short strike is carefully chosen, we can withstand a sharp downside correction without any trouble. On 28th January 2018 we gave our Instant Income Guaranteed subscribers the following trade on Western Digital Corporation (WDC). Price insurance could be sold as follows:
- On 29th January 2018, we sold to open WDC Mar 16 2018 77.5P @ 0.675 (average price), with 47 days until expiration and our short strike about 14% below price action,
- On 23rd February 2018, we bought to close WDC Mar 16 2018 77.5P @ 0.20, after 25 days in the trade; our short strike was never challenged during the sharp market correction, we only had to stay a little longer in the trade to close it.
Profit: 47.50$ per option
Margin: 1550$
Return on Margin annualized: 44.74%
Philippe

Receive daily trade recommendations - we do the research for you.
♦ SIGN UP TODAY! THIS IS WORTH THE INVESTMENT ♦
Learn More!
Instant Income Guaranteed
© by Joe Ross and Philippe Gautier. Re-transmission or reproduction of any part of this material is strictly prohibited without the prior written consent of Trading Educators, Inc.
Blog Post - Mounting Losses
by Professional Trader Andy Jordan
Educator for Spreads, Options, Swing/Day Trading, and
Editor of Traders Notebook Complete and Traders Notebook Outrights
Find out three things you can do to avoid mounting losses...read more.
Andy Jordan is the editor for Traders Notebook which shows you Futures Trading Strategies in Spreads, Options, and Swing Trades. Learn step-by-step how to trade successfully.
Click Here for Valuable Information about Traders Notebook
© by Andy Jordan. Re-transmission or reproduction of any part of this material is strictly prohibited without the prior written consent of Trading Educators, Inc.

Trading Article - Finding big market moves: BarStrength Indicator
by Professional Trader Marco Mayer
Educator for Forex and Futures, Systematic Trader, and
Creator of Ambush Trading Method, Ambush Signals, and AlgoStrats.com
I’d like to share an indicator I came up with that I found very useful over the years. It’s actually a very simple one but it proved itself against over and over again against much more complicated indicators that try to do the same thing. I surely wouldn’t want to miss it.
Here’s the formula: abs(open-close) / (high-low) * 100
Which gives us a value between 0 and 100 that measures the actual price change of a single price bar (absolute value of open-close) against the whole price bars range (high-low). Or in Candlestick charting language: measures the size of the candle body against the whole candle including the wicks.
Let’s look at a price chart to make this more clear:

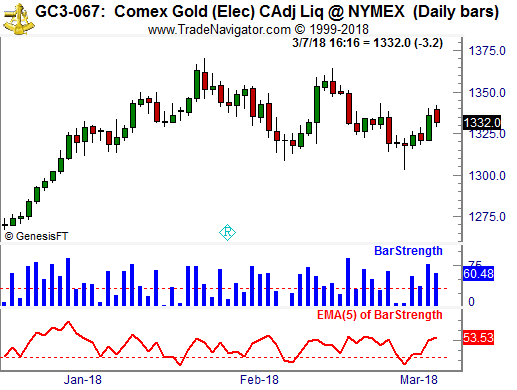
The blue bars are showing the Daily BarStrength of Gold for each of the price bars/candles. Below you can find a 5 period EMA of that BarStrength. Notice that huge green candles that open nearby the low and close nearby the high show a high BarStrength score (50+) while candles that close near the open have a very low score.
So what you might wonder. Well here’s the interesting part: Notice that quite often you’ll get a strong price bar/candle after a weak one and the other way around. To highlight this I’ve plotted a horizontal line at 33.
The same is true on a larger scale looking at the moving average below. When it’s showing low values, meaning there’s been hardly any real price change in Gold for a couple of days, there’s a tendency for big moves to happen afterward.
I’ve found this to be true in many markets, Gold is just an example. While this works in principle on any timeframe, it’s most effective on higher timeframes like daily and weekly charts.
The BarStrength indicator doesn’t show you in which direction the market will move. But knowing when a market is more likely to make a big move than not can make a really huge difference in your trading results. This is why I like to use this as a filter for breakout strategies, like ORB (opening range breakout) strategies for example.
Feel free to email Marco Mayer with any questions, This email address is being protected from spambots. You need JavaScript enabled to view it..
Happy Trading!
Marco
© by Marco Mayer. Re-transmission or reproduction of any part of this material is strictly prohibited without the prior written consent of Trading Educators, Inc.
To view previous published Chart Scan newsletters, please log in or click on "Join Us,"
shown above, to subscribe to our free "Members Only" section.
A WEALTH OF INFORMATION & EDUCATION:
Joe Ross-Trading Educators' popular free Chart Scan Newsletter has been published since 2004.
Note: Unless otherwise noted, all charts used in Chart Scan commentary were created
by using Genesis Financial Technologies' Trade Navigator (with permission).
Legal Notice and Copyright 2018 Disclaimer - Published by Trading Educators, Inc.
Chart Scan is a complimentary educational newsletter.


