Edition 718 - March 16, 2018


Ambush hits new all-time equity highs in 2018!
by Professional Trader Marco Mayer
Educator for Forex, Futures and Systematic Trader
Creator of Ambush Trading Method, Ambush Signals, and Head of AlgoStrats.com
Yes, Ambush did it again as most of the Ambush markets and portfolios just hit new all-time equity highs in March!
Trading has been tough for most traders so far this year, especially due to the crazy correction we had in the stock markets in early February. This lead to higher volatility in many markets mixed with a lot of uncertainty and crazy market moves.
That’s a recipe for disaster for many trading strategies but for Ambush it’s one of the most favorable market conditions. And oh boy did it rally during that period .The Ambush Small Portfolio, for example, showed a performance gain of over 11k within just four weeks of trading!
Thanks to that rally, almost all Ambush markets are now showing nice gains for 2018 and the year just started. To give you a better picture, here’s a chart showing the performance of all Ambush Futures markets (per contract) so far in 2018:
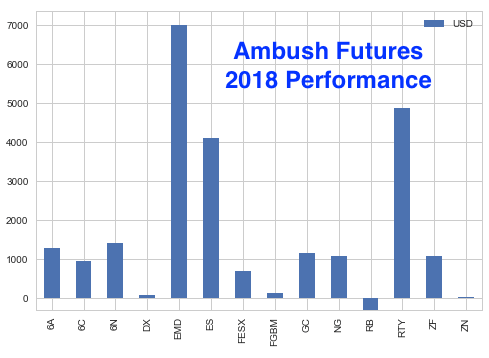
As you can see, only RBOB Gasoline is left with a slightly negative performance and especially the equity indices like the E-Mini S&P 500 (ES) or the E-Mini Russell 2000 (RTY) have been exceptional performers.
Now, this is just a tiny part of the whole Ambush history, so let’s zoom out and have a look at the broader picture. Ambush has been around for almost 10 years now. That’s exceptional for a trading system. Actually, it’s the only one I know that’s been around that long. But as markets tend to change, I do review Ambush once a year to see if any changes are necessary to adapt to changing market conditions. The last time any significant changes have been required was in July 2015. As you can see on the following chart Ambush kept on performing as expected since then in live trading.
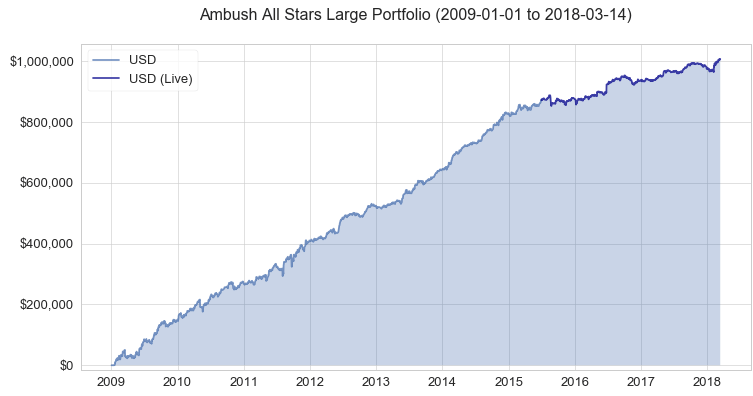
You can find out more about the sample portfolios and the long-term performance of each of the Ambush Markets on the Performance Page.
If you missed these first few months of Ambush Trading in 2018, you probably want to get on board now.
Join us and become an Ambush Trader!
The most popular and easiest way to follow Ambush is Ambush Signals. It does all the work for you, allows you to customize what markets you want to see and has a position sizing tool implemented to automatically adjust the positions to your risk preferences.
Each day around 6:30 pm NY Time the Signals are available for you on the Dashboard. You can then place your orders and literally walk away until the next market close! To find out more about the details of Ambush and how Ambush Signals works, have a look at the Ambush Signals Website.
Let’s be realistic. Following any System can be tough, especially in the beginning. It simply needs time to build the confidence needed to make it through inevitable drawdowns. So what if you’re unlucky and don’t catch a good start right away?
I want you to succeed trading Ambush Signals, so here’s something for you that will strongly increase your odds of success and allow you to easily gain the confidence you’ll need to become a long-term profitable Ambush trader.
We offer you 6 months of Ambush Signals for just $499. That’s a saving of $215, giving you almost two months of Ambush Signals for free. As we usually only offer monthly or 3-months subscriptions, this is a very special offer!
These 6 months will allow you to get to know Ambush Signals without too much stress or pressure and to follow it for a long enough time period that it simply won’t that much if you’re lucky and start on Ambush’s best trading month ever or not.
Don’t miss out on this and get your 6 months of Ambush Signals for $499 today!
Click HERE to purchase AMBUSH SIGNALS for 6-MONTHS
Now many of you already have been following Ambush for years now and so you’ve been asking for a long-term subscribers bargain. Here it is. For the first time ever we offer you a whole year of Ambush Signals for $799. That’s a whopping $629 off the regular yearly subscription price, giving you over five months for free!
Click HERE to purchase AMBUSH SIGNALS for 1-YEAR
Ambush eBook
If you’d prefer to rather generate the signals on your own and want to know the exact trading rules of Ambush, you want the Ambush ebook. We also have a very special offer for you then:
Coupon Code for $500 off:
- Ambush eBook: use "ambush500" to get the Ambush eBook $500 off, for $1,299 instead of $1,799.
All special offers are valid only until March 30th. So hurry up and don’t miss out!
Happy Trading!
Marco Mayer
© by Marco Mayer. Re-transmission or reproduction of any part of this material is strictly prohibited without the prior written consent of Trading Educators, Inc.

Chart Scan with Commentary - Trading U.S. Stock Options
by Master Trader Joe Ross
Author, Trader, Trading Mentor, and Founder of Trading Educators, Inc.
Developer of Instant Income Guaranteed
For most of my trading career I have been a seller of Options. I preferred to sell options on futures and have done more than my share of selling options on stocks.
However, for those of you who are afraid to sell options, the following should be of help in buying options.
I suppose many readers of Chart Scan do not trade the U.S. stock markets, but with the option buying method I’m now going to show you, the time differential between the U.S. and anywhere else on earth shouldn’t be a hindrance.
To employ the method, I use weekly charts. I am screening for stocks making 52 week highs. There are a number of websites that will show you stocks making 52 week highs. Look up “stocks making 52 week highs” on your browser and you can find several sources.
The next step is to bring up a weekly chart for every stock making the “New Highs” List. You will consider buying Call options for any stocks you care to trade from the list. If you want to purchase Put options, you can bring up charts from the any “New Lows” list.
I am going to restrict this article to purchasing Calls. Hopefully, there will be a sufficient number of rising stocks to make the article worthwhile. Of course, you can do just the opposite when stocks are falling.
Screening: I use four screens to whittle down the number of stocks I’m willing to consider.
- The stock must be optionable (I am able to determine that by using Genesis Trade Navigator). If you browse for “optionable stocks” you will find additional sources. Again, you will find several sources.
- Volume – Must be at least 400 thousand shares/day.
- Price – Must be between U.S. $50 – U.S. $80. You can go higher in price, but I don’t recommend going lower.
- Visual graphic of the chart.
The reason for choosing stocks between fifty and eighty dollars (or more), is that higher price stocks tend to move more money per share each day than lower priced stocks.
The process I follow is simple: I want to buy the options having at least six weeks but no more than three months until expiration. I want to buy one strike away, but if that strike is very close to the current share price, I want to buy the next strike beyond the closest one. What I want to enjoy is the appreciation in the Delta. If prices move my way, at-the-money options quickly move to 100 Delta and limit my gains. In-the-money options already are at 100 Delta and so I lose the ability to benefit from gains in Delta.
I also need the leverage I can get from out-of-the-money options. If I buy 100 shares of a U.S. $80 stock, I will use up $8,000 in capital. No thanks! I can buy the option at a fraction of the cost. Since these are stocks that have made a 52 week high, I have the benefit of momentum in my favor. I do not need to know anything about the fundamentals of the stock. The truth is, I don’t care who or what the company is or what business they are in. If a relatively high-priced stock is making new highs, there must be a reason—that reason is good enough for me.
I suppose the most difficult part of the process is the visual part. I will try to describe it and give a couple of examples. I want a stock that has been trending on the weekly chart. Some stocks trend nicely, and when they make a correction (retracement), they rarely go back as far as violating the previous correction. I automatically reject stocks that frequently violate the previous correction.
Let’s look at a couple of historical charts for trades in which I was involved to see what I mean. I save the charts from a lot of trades I made or considered as part of my personal education:
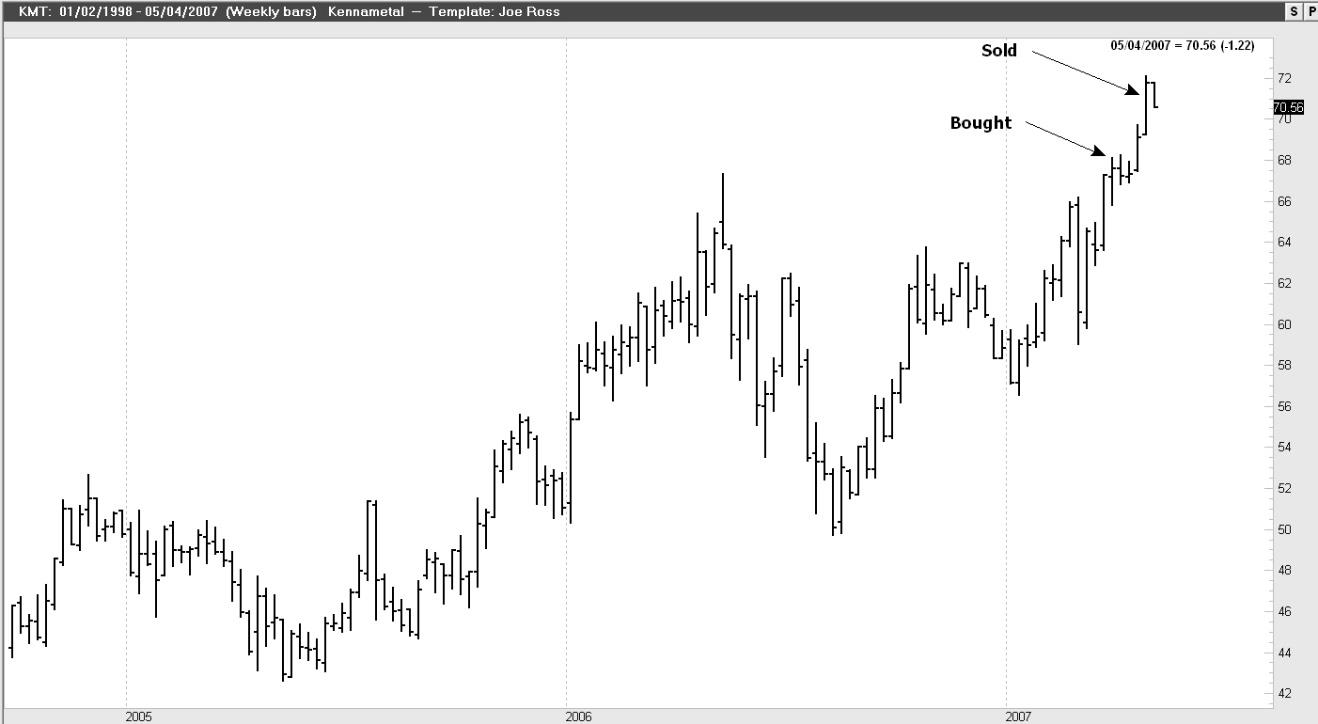
During the week beginning March 26, 2007, with the price for Kennametal (KMT) at $67.40, I bought the May 70 KMT Call for $2.10 and sold it for $4.00 during the week of April 23, 2007, with the price of the stock at $71.00, pocketing a profit of $1.90 per share. Expiration for the Calls was May 18.4.
My increase on a percentage basis was 90.5%. Had I purchased the stock my increase on a percentage basis would have been 5.7%.
Note: The arrows point to the weeks bought and sold, not to the actual prices.
Charts: Courtesy Genesis Financial Data Systems
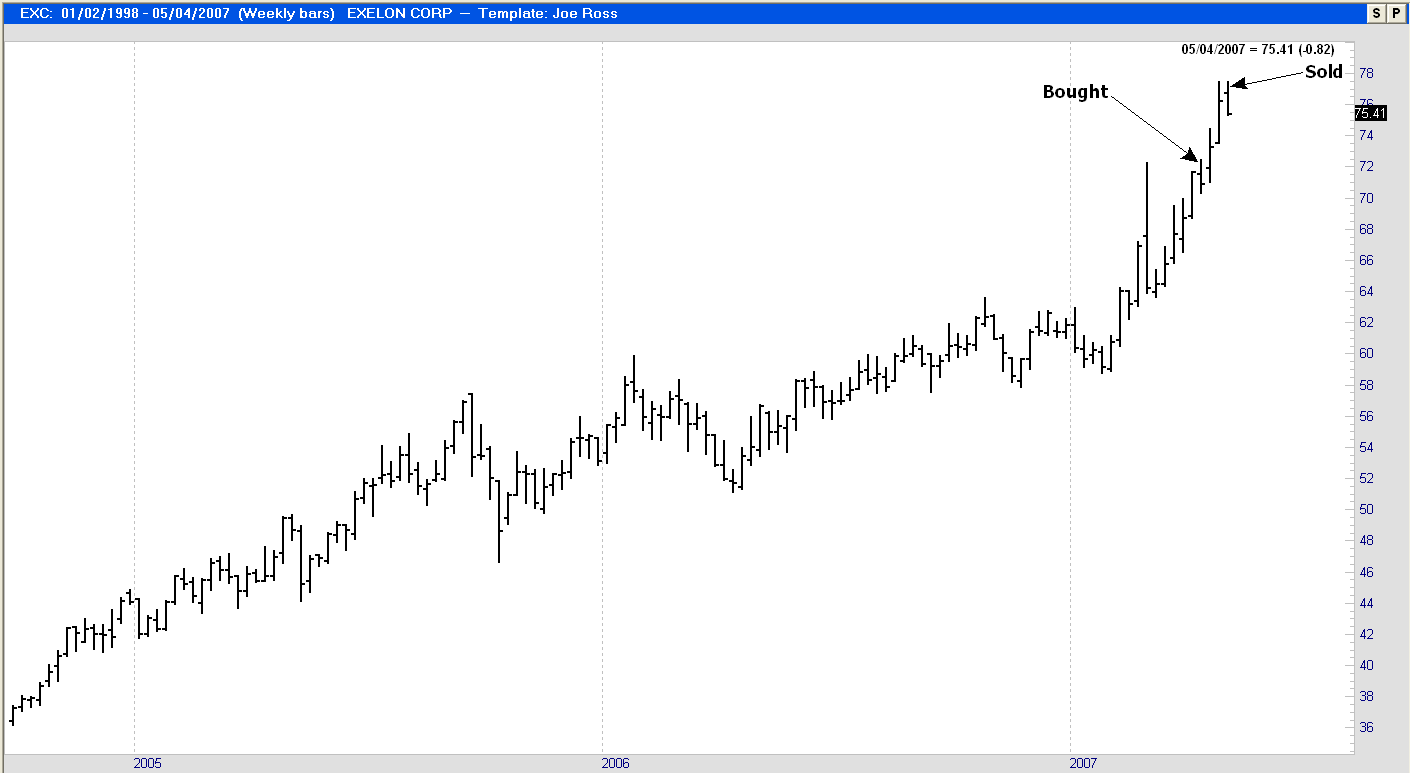
During the week beginning April 9, 2007, with prices for Exelon (EXC) at $72.35, I purchased the 75 Call for a price of $.75 and sold it for $2.60 on April 30, 2007, with the price of the stock at $76.25. The expiration date for the options was May 18.
My increase on a percentage basis was 71.2%%. Had I purchased the stock my increase on a percentage basis would have been 5.1%.
Charts: Courtesy Genesis Financial Data Systems
On April 17, 2007, I purchased the T Rowe Price June 55 Calls for $.25, with the price of the shares at $50.40. Expiration date for the Calls was June 15. Volume was very small, and I may have been the only buyer. I anticipate having trouble selling these options when the time arrives. But over the years I have learned a little trick. If I am having trouble finding a buyer at my price, I simply exercise my option and simultaneously sell short the stock. Since I cannot be both long and short at the same time, I am able to walk away with my profits intact.
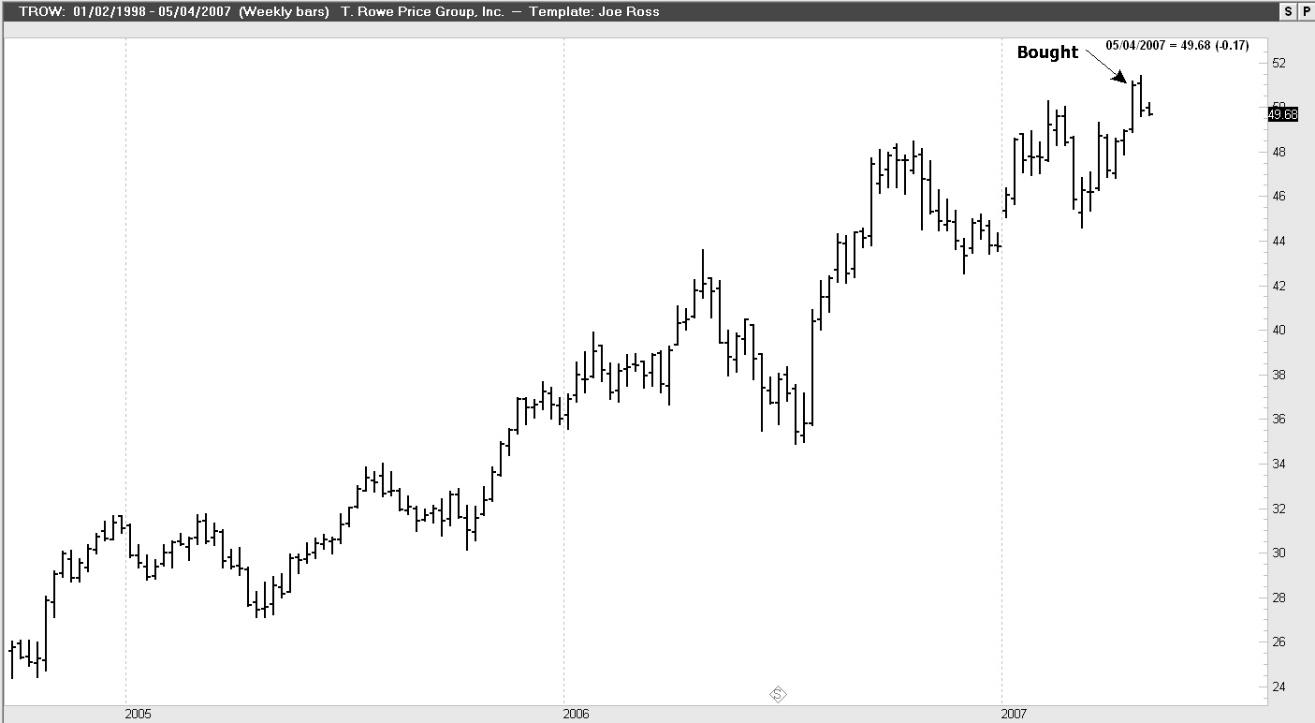
Chart: Courtesy Genesis Financial Data Systems
What might a stock look like when I didn’t want to buy an option for it?
Corn Products International is an optionable stock. But:
- The price is too low.
- It makes multiple violations of previous corrections.
- Quite often it has too little volume.
- Instead of making nice steady trends, it jerks up and down.
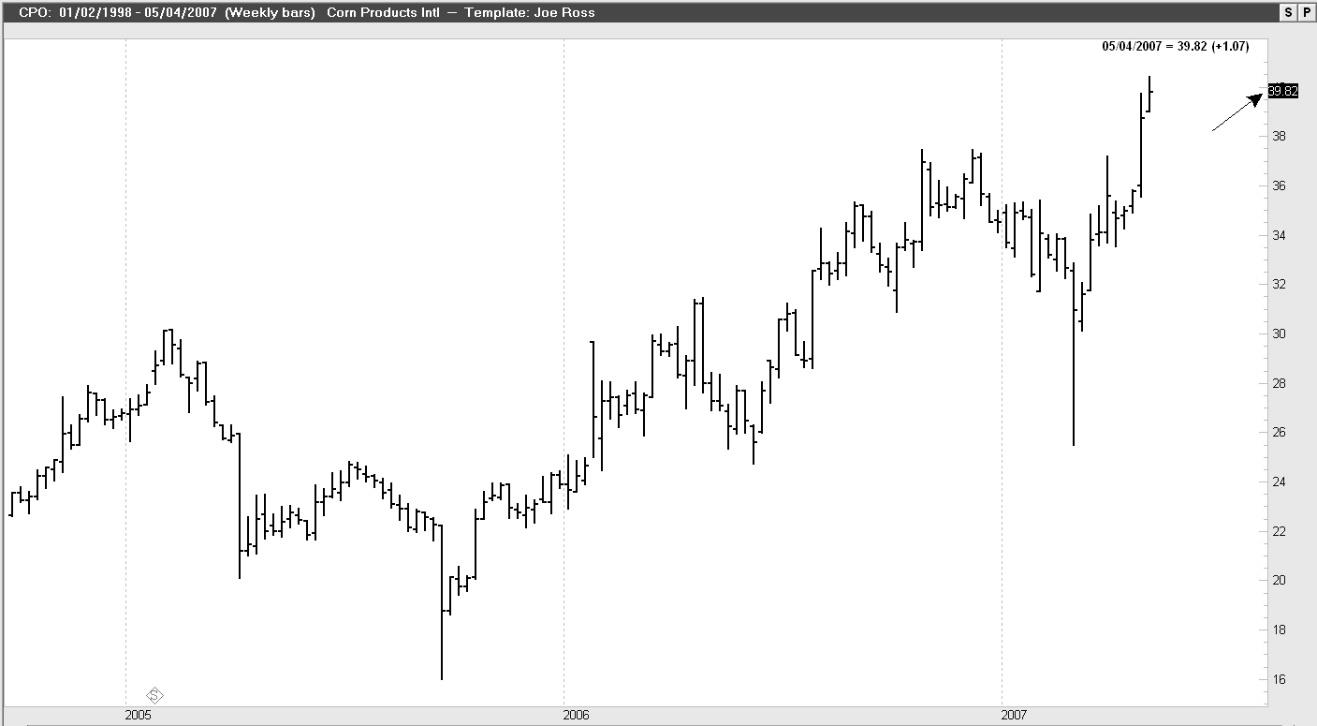
Chart: Courtesy Genesis Financial Data Systems
It takes a bit of work to dig out the best stocks for which to purchase options. However, there are stocks making new 52 week highs, just about every day. You have to carefully screen these stocks hitting new highs, however the reward has been well worth the effort.
Interestingly, using similar parameters, you can achieve a great deal of success selling put options on stocks. Our “Instant Income Guaranteed (IIG)” program is now in its 3rd year without sustaining a loss. Can you name any advisory that can match that record? Follow this link for more information about Instant Income Guaranteeed.
© by Joe Ross. Re-transmission or reproduction of any part of this material is strictly prohibited without the prior written consent of Trading Educators, Inc.

Trading Article - Take Advantage of New Market Opportunities
by Master Trader Joe Ross
Author, Trader, Trading Mentor, and Founder of Trading Educators, Inc.
Developer of Instant Income Guaranteed
Something is usually going up when something else is going down. Therefore, good trading times may be just ahead. Are you ready? It's times like these when the right mental edge can make all the difference. If you want to take advantage of trading opportunities for the New Year, it's vital that you approach trading with the proper mindset. Be ready to work hard and do whatever it takes to come out a winner.
Unfortunately, many traders aren't up to the challenge. They don't have the proper mindset. They don't have rock-solid confidence, and when they see a high probability setup, they flinch, make a trading error, and end up with a losing trade. When market conditions are ideal, you must be ready to take advantage of them. Often, self-reproach is the biggest culprit. Many traders are ready to criticize their own actions.
Some traders take setbacks in stride. Nothing seems to faze them. Why? They know how to put any setback into the proper perspective; they readily think, "It's just business. It says nothing about me."
After years of experience, they've seen it all, lived through it all, and have learned that the markets are ultimately in control, and so there's no reason to get unnecessarily upset about the uncertainty of it all.
Other traders, however, secretly fear that the markets will expose their inadequacies. Deep down, they believe they will eventually fail. A little voice in the back of their mind tells them so. This little voice isn't correct, helpful, or accurate, but it has a subtle impact on the trader's every move. These thoughts usually happen just below our awareness level.
Such thinking patterns are automatic thoughts. An event happens, such as the market going against you, and you 'automatically' think, "The truth is out, I can't keep trading profitably." The old saying, "I think, therefore I am," is apt here. If you think you can't keep up your trading performance, you won't be able to. You'll start believing your little voice that tells you that you can't trade. And you will find that even a minor trading error will upset you.
How do you defeat the little voice? Write down your automatic thoughts after they happen, and analyze them. Break them down, refute them, and convince yourself that they just aren't true. For example, if you face a trading setback and think, "This setback shows that I'm not a natural-born trader; I might as well give up," you will actually feel like giving up. This automatic thought is inaccurate, however. When you look at it more closely, you can see that it is not true. First, setbacks happen to all traders. Setbacks should be expected. By thinking they are rare and significant, you are exaggerating their importance. You are "magnifying" the event into something bigger than it really is. A setback may reflect poor market conditions, and it may even reflect a lack of experience on your part to deal with a particular set of market conditions, but it is not so meaningful that it is a "sign" that you are not a "natural-born trader." Keep things in proper perspective.
No one really knows what the future will hold. There is virtually always something that affords the opportunity to make profits. Don't sabotage your efforts through self-doubt and unreasonable self-criticism. You can trade profitably if you put in the time and effort. Think optimistically, work hard, and take home the profits!
© by Joe Ross. Re-transmission or reproduction of any part of this material is strictly prohibited without the prior written consent of Trading Educators, Inc.

Trading Example: Instant Income Guaranteed
Philippe Gautier: Administration and New Developments
Developer: Joe Ross
TRADE WITH NO LOSSES
Here's our latest example!
ADM Trade
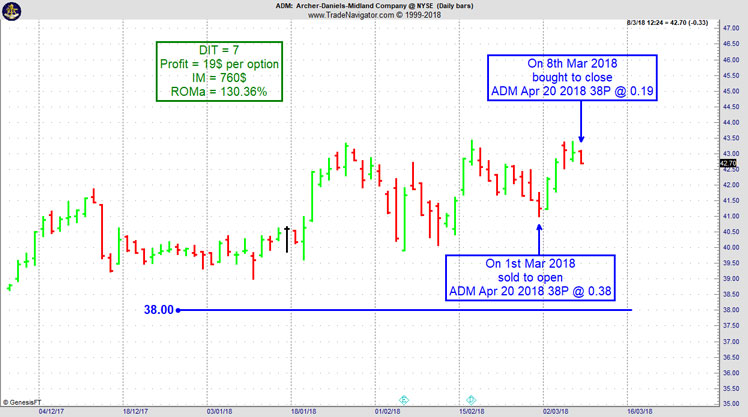
On 22nd February 2018 we gave our Instant Income Guaranteed subscribers the following trade on Archer-Daniels-Midland Company (ADM). Price insurance could be sold as follows:
- On 1st March 2018, we sold to open ADM Apr 20 2018 38P @ 0.38, with 49 days until expiration and our short strike about 8% below price action,
- On 8th March 2018, we bought to close ADM Apr 20 2018 38P @ 0.19, after 7 days in the trade for quick premium compounding.
Profit: 19$ per option
Margin: 760$
Return on Margin annualized: 130.36%
Philippe
Receive daily trade recommendations - we do the research for you.
♦ SIGN UP TODAY! THIS IS WORTH THE INVESTMENT ♦
Learn More!
Instant Income Guaranteed
© by Joe Ross and Philippe Gautier. Re-transmission or reproduction of any part of this material is strictly prohibited without the prior written consent of Trading Educators, Inc.
Blog Post - Pride Goes Before a Fall
by Professional Trader Andy Jordan
Educator for Spreads, Options, Swing/Day Trading, and
Editor of Traders Notebook Complete and Traders Notebook Outrights
To be a winning trader you cannot be overly proud...read more!
Andy Jordan is the editor for Traders Notebook which shows you Futures Trading Strategies in Spreads, Options, and Swing Trades. Learn step-by-step how to trade successfully.
Click Here for Valuable Information about Traders Notebook
© by Andy Jordan. Re-transmission or reproduction of any part of this material is strictly prohibited without the prior written consent of Trading Educators, Inc.
To view previous published Chart Scan newsletters, please log in or click on "Join Us,"
shown above, to subscribe to our free "Members Only" section.
A WEALTH OF INFORMATION & EDUCATION:
Joe Ross-Trading Educators' popular free Chart Scan Newsletter has been published since 2004.
Note: Unless otherwise noted, all charts used in Chart Scan commentary were created
by using Genesis Financial Technologies' Trade Navigator (with permission).
Legal Notice and Copyright 2018 Disclaimer - Published by Trading Educators, Inc.
Chart Scan is a complimentary educational newsletter.


