Edition 777 - May 24, 2019
It seems a recent update has affected any customer that purchased an eBook(s), we are sorry for any inconveniences. Please email us at This email address is being protected from spambots. You need JavaScript enabled to view it. if there are other concerns to address.
THANK YOU FOR YOUR PATIENCE WHILE ACTIVELY WORK ON THIS MATTER
WE APPRECIATE YOUR BUSINESS!

by Master Trader Joe Ross
Author, Trader, Trading Mentor, and Founder of Trading Educators, Inc.
Developer of Instant Income Guaranteed
Chart Scan with Commentary: Bollinger Bands
Hey Joe! I know you have used Bollinger Bands with options when there is a reversal bar at one of the outer bands. Are there other ways to us it?
First, realize that most people use it as an indicator to locate overbought and oversold market conditions.
Yes! BBs can be used as a short-term trading indicator to determine market conditions and market direction. The idea is to sell when the price reaches above the upper band and to purchase when the market gets below the lower Bollinger Band.
The BBs also work very well for fading trends when the market is range bound and choppy. However, when markets are trending strongly, using the Bollinger Bands for picking tops and bottoms is highly discouraged. Traders who make this mistake can end up paying a huge price.
I’ve found it useful to use BBs to determine if the market is in fact range bound or trending. This helps me when trading options. However, I do change the settings from the standard 20 bar moving average of the close, along with two standard deviations for the outer bands, to a 15 day moving average along with two standard deviations.
To determine a strong up trend you want to see the upper band sloping upwards, with price bars touching or penetrating the upper band.
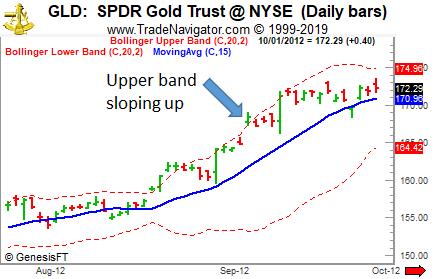
Notice how the upper band rises and prices are either coming very close, touching or penetrating the upper band.
Below you can see an example of how the BBs catch a strong downtrend. Notice the slope of the lower band and how the prices are moving and collecting at that band. This is a good sign that markets are headed sharply down, you can also see at one point the band is flattening out and market is becoming range bound and flat as well. This is what makes the Bollinger band one of the best short term trading indicators, the ability to analyze market conditions in volatile and flat markets.
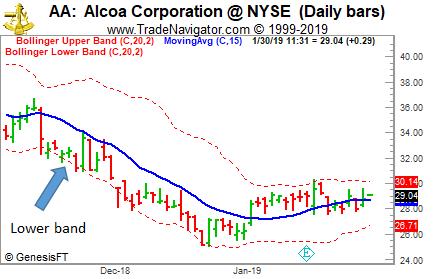
Notice that in the beginning part of the GLD chart, and the latter part of the AA char prices are flat and sideways. There you see that the bands are flat and most of the price action is contained inside the bands. The Bollinger Bands do a very good job of identifying market conditions.
There are several ways your trading can benefit from using BBs to determine market direction. If you are trading a breakout or a trend following strategy, you can use this method as a filter to confirm that market is in fact trending strongly either upwards or downwards. If you are trading a flat market strategy or a reversal strategy you can use this method as filter to confirm that the market is in fact flat.
By using the Bollinger Band as a filter to determine market conditions and market direction you will avoid trading trend following strategies during dull flat market conditions and avoid picking tops and bottoms during strong trending market conditions.
© by Joe Ross. Re-transmission or reproduction of any part of this material is strictly prohibited without the prior written consent of Trading Educators, Inc.

by Master Trader Joe Ross
Author, Trader, Trading Mentor, and Founder of Trading Educators, Inc.
Developer of Instant Income Guaranteed
Trading Article: Where the Public Go Next?
Even during a strong bull market, you have to do your homework. Many stocks will go up while the public is interested in trading the markets, but not all stocks are equal. Some will...read more.
© by Joe Ross. Re-transmission or reproduction of any part of this material is strictly prohibited without the prior written consent of Trading Educators, Inc.

by Philippe Guartier: Administration and
New Developments of Instant Income Guaranteed
Trading Idea: Instant Income Guaranteed
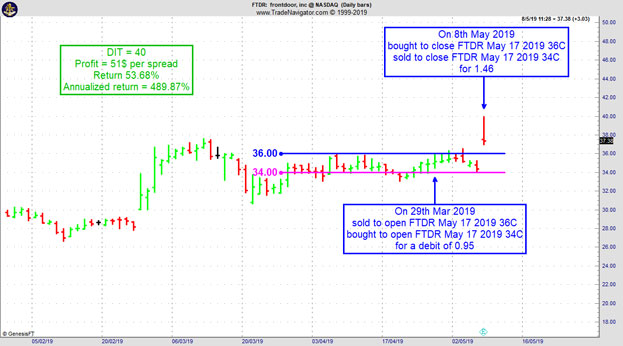
FTDR Trade
- On 29th March 2019, we sold to open FTDR May 17 2019 36C and bought to open FTDR May 17 2019 34C for a debit of 0.95.
- On 8th May 2019, we bought to close FTDR May 17 2019 36C and sold to close FTDR May 17 2019 34C for 1.46.
Philippe
Receive daily trade recommendations - we do the research for you.
♦ SIGN UP TODAY! WEALTH BUILDING FOR YOUR FUTURE ♦
Learn More!
Instant Income Guaranteed
© by Joe Ross and Philippe Gautier. Re-transmission or reproduction of any part of this material is strictly prohibited without the prior written consent of Trading Educators, Inc.

by Professional Trader Andy Jordan
Educator for Spreads, Options, Swing, Day Trading, and
Editor of Traders Notebook Complete
Trading Article: Believe in Trading
Is there anything we can believe when it comes to trading? Is it all lies and fakery?
Trading is a challenge. Tens of thousands are…read more.
Andy Jordan is the editor for Traders Notebook which shows you Futures Trading Strategies in Spreads, Options, and Swing Trades. Learn step-by-step how to trade successfully.
Traders Notebook Complete
Learn how to manage this trade by getting daily detailed trading instructions, click here!
© by Andy Jordan. Re-transmission or reproduction of any part of this material is strictly prohibited without the prior written consent of Trading Educators, Inc.

by Professional Trader Marco Mayer
Educator for Forex, Futures and Systematic Trader
Creator of Ambush Trading Method, Ambush Signals, and Head of AlgoStrats.com
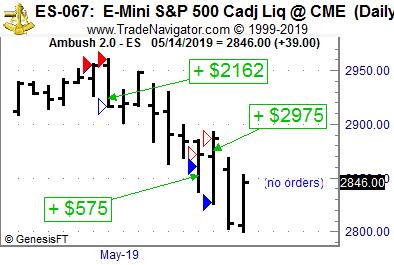
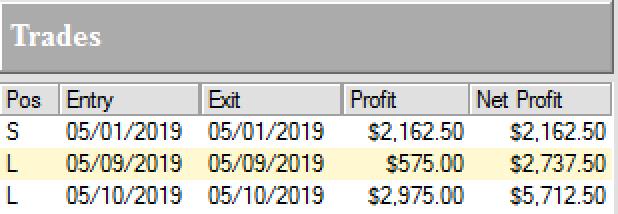
Ambush Traders lock in $5700 of profits in the E-Mini S&P 500!
The Ambush trading method is specialised in catching intraday market tops and bottoms in a variety of Futures markets. Including the E-Mini S&P 500 Future (ES) traded at the CME, where Ambush Traders cashed in big time again over the last couple of days!
Ambush day trades on an end-of-day basis so there’s no need to even check the markets during the day.
The E-Mini S&P 500 is the most popular market out there. Everyone follows it and most of you guys probably trade it or at least own some ETFs based on the S&P 500 index. Ambush has always been doing well in this market and so it’s no surprise it has actually just made new all time equity highs.
But this month so far has been really crazy. While a lot of traders lost their shirts on the huge reversal we’ve seen related to the news around the trade war with china, Ambush took the other side of these trades and made over $5700 within a couple of days!
Yes, looking at that chart you’re right, Ambush went short pretty much exactly at the all time high of the S&P 500...
You have to ask yourself if you really can afford to miss out on these trades or at least be aware of the signals.
Now with the new Micro E-mini S&P 500 Index Futures (MES) that just started trading at the CME you can also follow these Ambush trades now with a small account:
Yes it’s just 1/10 the size of the regular E-Mini and this allows you to nicely position size into these trades. This is great news as the E-Mini S&P 500 hasn’t been that “mini” any more lately trading at such high prices.
Whether you’re trading a $10k account or a $100k account, Ambush has the right markets for you to start following the signals.
Again, ask yourself if you really can afford to miss out on these trades or at least be aware of the signals? Now if you’ve been on the other sides of these trades trying to buy the breakouts you maybe should think about switching sides?
TWO WAYS TO JOIN US
AND BECOME AN AMBUSH TRADER!
1) AMBUSH SIGNALS
OR
2) AMBUSH EBOOK
READ ON....
With Ambush Signals you can easily follow Ambush, a system specialized in catching intraday market tops and bottoms in the Futures markets!
The most popular and easiest way to follow Ambush is Ambush Signals. It does all the work for you, allows you to customise what markets you want to see and has a position sizing tool implemented to automatically adjust the positions to your risk preferences.
Each day around 6:30 pm NY Time the Signals are available for you on the Dashboard. You can then place your orders and literally walk away until the next market close! To find out more about the details of Ambush and how Ambush Signals works, have a look at the Ambush Signals Website.
Let’s be realistic. Following any System can be tough, especially in the beginning. It simply needs time to build the confidence needed to make it through inevitable drawdowns. So what if you are unlucky and don’t catch a good start right away?
I want you to succeed trading Ambush Signals, so here’s something for you that will strongly increase your odds of success and allow you to easily gain the confidence you’ll need to become a long-term profitable Ambush trader.
Find out more about Ambush eBook and Ambush Signals!
Did you come up with questions? Don't be shy, email Marco Mayer, he wants to hear from you! This email address is being protected from spambots. You need JavaScript enabled to view it.
Sign up for Ambush Signals Today!
LEARN ABOUT AMBUSH TRADING METHOD
© by Marco Mayer. Re-transmission or reproduction of any part of this material is strictly prohibited without the prior written consent of Trading Educators, Inc.
WE APPRECIATE YOUR TRUST IN US
THANK YOU FOR YOUR BUSINESS!
Check out our Blog!
To view previous published Chart Scan newsletters, please log in or click on "Join Us,"
shown above, to subscribe to our free "Members Only" section.
A WEALTH OF INFORMATION & EDUCATION:
Joe Ross-Trading Educators' popular free Chart Scan Newsletter has been published since 2004.
Note: Unless otherwise noted, all charts used in Chart Scan commentary were created
by using Genesis Financial Technologies' Trade Navigator (with permission).
Legal Notice and Copyright 2019 Disclaimer - Published by Trading Educators, Inc.
Chart Scan is a complimentary educational newsletter.


