- Short Term Trading
- Futures
Edition 602 - December 18, 2015

The team at Trading Educators wish you and your family a very special holiday. We hope that you balance family and work, to keep you, as a trader, and your family, happy, healthy, and strong.
We will not publish a newsletter next week, December 25, 2015. The new year edition will arrive on January 1, 2016.
Our Traders Wish List, which includes both our products and those of others, is still available on our website if you need some last-minute gift ideas.

The Law of Charts with Commentary
by Master Trader Joe Ross
Author, Trader, Trading Mentor, and Founder of Trading Educators, Inc.
Euro Fx
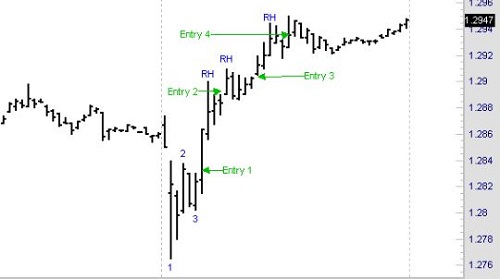
As you can see, Euro FX (10-minute chart) made a 1-2-3 low. On the bar marked 3, there was a Traders Trick entry to go long 1-tick above the high. I marked that "Entry 1."
Prices shot up and then corrected, giving me my first Ross hook (RH) of the day. Entry 2 from the Traders Trick, along with good trade management, offered an opportunity for a small win, but more than likely a breakeven trade.
Another RH formed a couple of bars later, which provided a second Traders Trick Entry. This time prices moved up nicely, and good profit was available. I labeled that Ross Hook "Entry 3."
Finally, you see Entry 4, which took place just ahead of exhaustion. The Close of the highest bar shows that momentum was no longer there. Still, the worst that could have happened with that trade was to break even. There were enough ticks to ensure that result.
The Traders Trick, along with The Law of Charts (TLOC), continue to provide opportunities for traders willing to learn to use them. Keep your eyes on the charts, they are the sources of the best trades.
© by Joe Ross. Re-transmission or reproduction of any part of this material is strictly prohibited without the prior written consent of Trading Educators, Inc.

Spread Scan with Commentary
by Master Trader Andy Jordan
Educator for Spreads, Options, Swing/Day Trading, and Editor of Traders Notebook
This week, let's examine one of the meats market: Lean Hogs.
.png?i=756 "andy-602")
As you can see on the chart above, Lean Hogs has been moving slightly higher since mid-November. Is this a change of direction or only a correction of the strong down-move in October/November? So far, we don't know, but as long as the 55.000 level holds, there is a good chance Lean Hogs will not move much lower. And that's all an options seller needs to know. With the Implied Volatility at a good level, aggressive traders might start to sell puts at the current level while more conservative traders might want to wait for the next up-move.
Find out more about how to manage this and other trades in our daily detailed trading newsletter Traders Notebook.
© by Andy Jordan. Re-transmission or reproduction of any part of this material is strictly prohibited without the prior written consent of Trading Educators, Inc.
Trading Article with Commentary
by Master Trader Andy Jordan
Educator for Spreads, Options, Swing/Day Trading, and Editor of Traders Notebook
Andy, if I get all my buy and sell signals to work properly, I should come out a winner, right?
Wrong! The perennial questions are, "Should I buy? Should I sell?" All too many traders focus their efforts on identifying buy and sell signals. In fact, that’s what most trading books consist of—some way to find buy and sell signals. Trading systems are usually all about "where to get in."
The research and analysis traders use is geared towards reaching the goal of getting that magic "base line" directive to guide their actions. How misguided can they be?
Any successful, experienced trader will tell you that although properly identifying buy/sell signals is important, it’s not the key to being successful. Instead, the way you manage each trade is what will determine your success.
Traders who take the baseline approach tend to believe that the success of their trading activity is dependent on following the right buy/sell signals at the right time. Clearly, it’s important that a trader be able to understand the process of generating signals and to use the methods involved. Realistically though, almost any trader can find a way to generate signals (whether using technical methods already out there, coming up with their own system, or using their platform’s automated signal generation tools).
Successful, experienced traders will tell you that your trade doesn't begin and end with a buy or sell. There’s a trade management process involved. For each trade you make, you’re making a group of decisions. The way you manage and time those decisions is what will determine the success of your trade. Let’s say two traders get the same signal at the same time, and act on it. One’s trade may result in profits, while the other's results in losses. How is this possible? It can occur because each trader made a different combination of decisions throughout the course of the trade. The decisions might include scaling in and/or out of the trade, using or not using trailing stop losses, setting or not setting profit objectives prior to entry, patience or lack thereof, etc. The trader who made the most effective overall combination of decisions will have the better trade results in the end. Of course, there are times when pure chance gives the better result to the worst trader.
It's very important to regard trading as a process, and to understand that as a trader, your efforts need to be focused on the activity of trading itself, as opposed to getting a quick base line answer. Because there are many things to take into consideration in making your trades successful, it’s essential that you educate and train yourself in all the different areas. Learn how to develop better trading plans and analysis methods, and then learn how to apply what you’ve developed to the process of making a trade – from the original impulse to enter or stay out of a trade to the control, of your thought processes and emotions in managing that trade.
© by Andy Jordan. Re-transmission or reproduction of any part of this material is strictly prohibited without the prior written consent of Trading Educators, Inc.

Ambush Method Trade and Performance Report
by Master Trader Marco Mayer
Educator for Forex and Futures, System Trader, and Creator of Ambush Trading Method
This week, let’s share some thoughts on support/resistance using the daily chart of the Australian Dollar Futures (6A, AUD/USD Spot Forex).
I’ve marked the most important price level in this market during the last couple of months, and that is 0.7150. Even if you don’t pay much attention to the concept of support and resistance levels in your trading, you should be aware of it.
Why? Because it’s simply too obvious to ignore. And if that is the case for you, be sure other traders are aware of it too. That is why you should have marked that exact level on your charts, because it is then a self-fulfilling prophecy. Whether you believe in it or not, others will!
How do you spot such a level of interest? Look for accumulations of swing highs/lows around the same price. On a daily chart it will never be exactly the same price, but fairly close. Also, look for levels that react on both sides, support that turns into resistance, and the other way around. The longer the timeframe in which you can spot these, the more important they usually are. Simply put, if you can see them on a weekly chart, they will also be obvious on a daily, on a 4-hour, and on an hourly chart. More traders will notice them. The other way around, you’ll have many potential levels on a 5-minute chart, but those trading on a daily chart won’t notice 90% of them (unless they mark the high/low of a day).
One more thing to notice here is how well Ambush traded at that 0.7150 level multiple times. It nicely got in around that price pretty much at the low of the days price, and then reversed at the support mark. This is to some degree accidental, since Ambush doesn’t use support/resistance directly, but it is surely a nice coincidence!
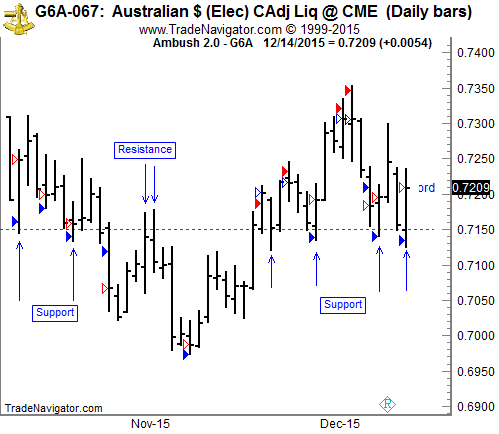
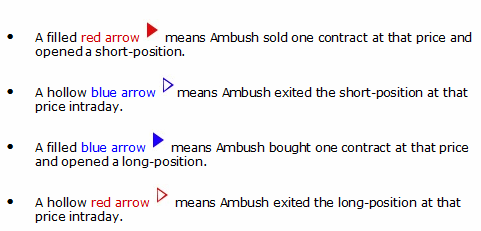
On the chart above are four different kinds of arrows:
Let's examine the results of those trades (including $10 for commissions and slippage round-turn) trading just one Australian Dollar Futures (6A) contract:
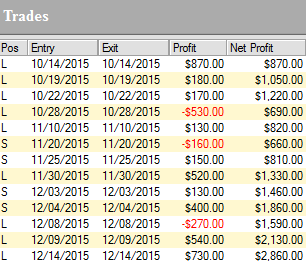
As you can see, Ambush managed to make a total of $2,860.00 profit (including $10 for commissions and slippage round-turn) trading just one contract without keeping any positions overnight!
Click on the link below to see the long-term performance of the Australian Dollar Futures (6A) and all other markets supported by Ambush:
View the Reports Now
© by Marco Mayer. Re-transmission or reproduction of any part of this material is strictly prohibited without the prior written consent of Trading Educators, Inc.
To view previous published Chart Scan newsletters, please log in or click on "Join Us," shown above, to subscribe to our free "Members Only" section.
A WEALTH OF INFORMATION & EDUCATION:
Joe Ross-Trading Educators' popular free Chart Scan Newsletter has been published since 2004.
Note: Unless otherwise noted, all charts used in Chart Scan commentary were created
by using Genesis Financial Technologies' Trade Navigator (with permission).
Legal Notice and Copyright 2015 Disclaimer - Published by Trading Educators, Inc.
Chart Scan is a complimentary educational newsletter.
© by Trading Educators, Inc. Re-transmission or reproduction of any part of this material is strictly prohibited without prior written consent.
- Short Term Trading
- Futures
Edition 598 - November 20, 2015
The team at Trading Educators is proud to announce the fresh, new look in our newsletter and website. You will still receive our high quality products and services with the most noticeable changes being an easier and more logical flow throughout our website. Happy Trading!
GRAND RE-OPENING SALE ~ 30% OFF*
Coupon Code: CELEBRATION30
Offer ends December 6, 2015
* This offer excludes 1-month subscription products and private tutoring
The Law of Charts with Commentary
by Master Trader Joe Ross
Author, Trader, Trading Mentor, and Founder of Trading Educators, Inc.
Old-Fashioned Chart Reading
The law of charts is to a large extent about chart reading, and chart reading incorporates some of the observations traders made over 100 years ago.
While these kinds of observations do not follow the strict rules of the Law of Charts, they are interesting, and it is exciting to see them work. Of course, we know that nothing works all the time, but it might be interesting to follow the chart of an investment (see the chart below).
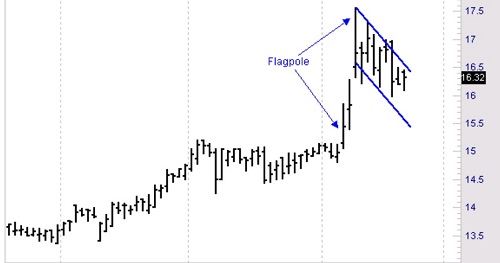
The “wisdom of the ages” states that following a breakout from consolidation, if prices shoot up creating what looks like a “flagpole,” and are then followed by a flag or pennant formation such as you see on the chart, when prices resume rising, they will rise again by the height of the flagpole. The flagpole begins its ascent at 15.20, which is a violation of the high of the consolidation. Prices then rise to a high of 17.56, so the total height of the flagpole is 2.36.
The low of the pennant formation is 15.98. Therefore the projection is that prices will rise to at least 18.34.
© by Joe Ross. Re-transmission or reproduction of any part of this material is strictly prohibited without the prior written consent of Trading Educators, Inc.
Spread Scan with Commentary
by Master Trader Andy Jordan
Educator for Spreads, Options, Swing/Day Trading, and Editor of Traders Notebook
This week, we're looking at LEJ16 – HEJ16: long April 2016 Live Cattle and short April 2016 Lean Hogs (CME at Globex).
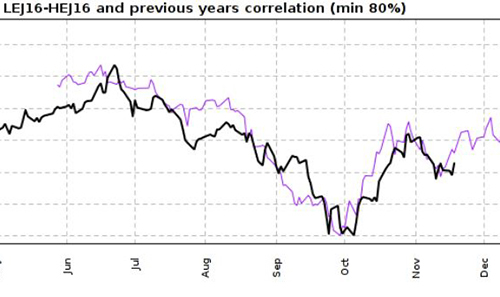
Today we consider an inter-market spread in the meats: long April 2016 Live Cattle and short April 2016 Lean Hogs (elec. symbols: LEJ16 – HEJ16). This spread has been nicely following the correlation chart (correlated with the years 1976 and 1983, see chart above) and we might see a strong up-move during the next few days. In addition to the close correlation to the years 1976 and 1983 there is a strong seasonal up-move in the time between 11/24 and 12/21.
Find out more about how to manage this and other trades in our daily detailed trading newsletter Traders Notebook.
© by Andy Jordan. Re-transmission or reproduction of any part of this material is strictly prohibited without the prior written consent of Trading Educators, Inc.
Stealth Trader with Commentary
by Master Trader Andy Jordan
Educator for Spreads, Options, Swing/Day Trading, and Editor of Traders Notebook
On November 4th, our method "Stealth Trader" generated an entry signal for the next trading day. We got short with 2 contracts: December Copper (first red arrow), and we reached our first target on the second day (first blue arrow). We are still in the trade with one contract using a simple trailing stop at the high of each daily bar (second blue arrow).
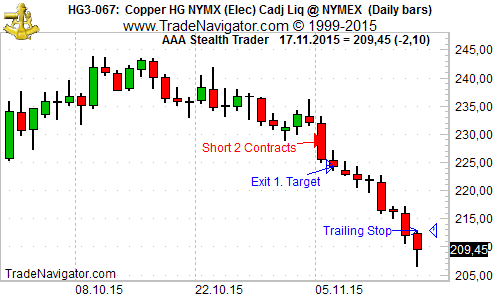
With an initial risk of approximately $1,100.00 per contract, the method generated a profit of $1,140.00 on the first contract, with an open equity of about $4,840.00 on the second contact.
Learn more about Stealth Trading!
© by Andy Jordan. Re-transmission or reproduction of any part of this material is strictly prohibited without the prior written consent of Trading Educators, Inc.
Trading Article
by Master Trader Marco Mayer
Educator for Forex and Futures, System Trader, and Creator of Ambush Trading Method
Hi Marco, looking at the successful large hedge funds who’re considered to be the best in the industry, is it really possible to outperform them?
That’s a really good question, and it can lead to some interesting insights - especially since the best performers often don't do better than making 10-15% a year, which for most retail traders with small accounts simply wouldn’t be worth the effort, right? What’s the point of making 10% on a $10,000 account in a year by day trading, when you’d make more by flipping burgers?
While most traders focus on what they consider the big advantage of large funds over retail traders, that is tons of capital, I have to strongly disagree. Nothing could be further from the truth, and talking to any successful CTA who started out with $100,000 and had a great performance for many years - as soon as the big money discovers them, that’s when things start to get much more difficult.
Imagine you have found a system that works great in a couple of markets like the DAX, Gold, and the E-Mini S&P 500. You have to get in and out of these markets multiple times a day. No problem to do that with 5 contracts in the DAX or gold, and for sure not in the S&P 500. You manage to achieve 50% a year for 3 years in a row. Of those 50%, 40% come out of the DAX and Gold trades, 10% you make in the ES.
At that point, big money gets interested in your fund, and now instead of managing half a million, you have 10 million to manage. Very quickly you start noticing the results of your system getting much worse due to lots of slippage in the DAX and Gold futures, and you’re forced to more actively trade the market which performed worst, the E-Mini S&P 500.
While more money comes in, you have to close the fund to new investors, think about new markets to trade, and how to adjust your system in the DAX and Gold markets. You develop new entry-techniques using limit-orders only, and limiting the trading times in those markets. This way you can still get a nice performance, but much less than before.
To make a long story short, yes, I think it’s possible to strongly outperform the big guys since it’s considerably easier to make 50% on a $10,000 account than on a $10,000,000 account! Think about it.
If you like, take it one step further and use that as an inspiration to think about what you can do by trading one contract in the DAX or any other small market, that you couldn’t do with 100 contracts. This might result in some interesting trading strategies...at least it did for me.
Happy Trading!
Marco
© by Marco Mayer. Re-transmission or reproduction of any part of this material is strictly prohibited without the prior written consent of Trading Educators, Inc.
To view previous published Chart Scan newsletters, please log in or click on "Join Us," shown above, to subscribe to our free "Members Only" section.
A WEALTH OF INFORMATION & EDUCATION:
Joe Ross-Trading Educators' popular free Chart Scan Newsletter has been published since 2004.
Note: Unless otherwise noted, all charts used in Chart Scan commentary were created
by using Genesis Financial Technologies' Trade Navigator (with permission).
Legal Notice and Copyright 2015 Disclaimer - Published by Trading Educators, Inc.
Chart Scan is a complimentary educational newsletter.
© by Trading Educators, Inc. Re-transmission or reproduction of any part of this material is strictly prohibited without prior written consent.
- Short Term Trading
- Futures
Edition 599 - November 27, 2015
The team at Trading Educators is proud to announce the fresh, new look in our newsletter and website. You will still receive our high quality products and services with the most noticeable changes being an easier and more logical flow throughout our website. Happy Trading!
The Law of Charts with Commentary
by Master Trader Joe Ross
Author, Trader, Trading Mentor, and Founder of Trading Educators, Inc.
A 15-Minute Chart of the Euro/Dollar Forex Pair
"Trading by the Book" states that if prices break out of a trading range in one direction and then reverse and come through that range in the other direction, it is time to "sell the store."
However, looking at the chart below, we see that there was little way to know that such a thing would happen after the upside breakout of the trading range which was caused by an economic report.
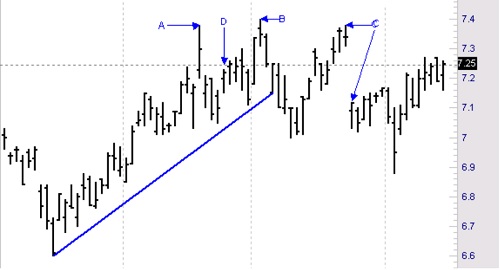
Nevertheless, the Law of Charts came to the rescue by providing a Reverse Ross hook.
The question is this: is the Reverse Ross hook telling us that momentum has truly changed, and should we risk going short based on a Traders Trick entry? Please note that a Reverse Ross hook can be somewhat different from a 1-2-3 high. A 1-2-3 high comes only at the end of a trend or a swing, but we have neither at the time in question.
We have an upside breakout of a trading range, and then a Ross hook due to the fact that following the breakout of the trading range, prices failed to go higher. So the formation I’ve labeled a-b-c is what is known as a Reverse Ross hook (RRh). The RRh is discussed in detail in my book "Trading the Ross Hook."
There is a reliable way to know with a high degree of certainty whether or not to use the Traders Trick to try to get into the trade. It is a specialized use of the stochastic study. The settings are nothing special, 5-3-3. It is the use that is special. If the fast stochastic has crossed below the slow stochastic at the time you seek to enter the trade, then it is a low risk opportunity to enter short using a tight stop for protection. The graph is not very clear because of the colors I used, but if you look closely, you can see the upper dotted line (the fast Stochastic) cross the lower line (the slow Stochastic). The result of taking the trade was a handsome profit.
© by Joe Ross. Re-transmission or reproduction of any part of this material is strictly prohibited without the prior written consent of Trading Educators, Inc.
Spread Scan with Commentary
by Master Trader Andy Jordan
Educator for Spreads, Options, Swing/Day Trading, and Editor of Traders Notebook
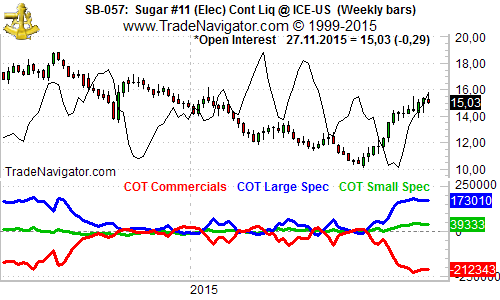
Sugar has been moving higher since September, almost reaching the January high. As we note from the chart below, Commercials are extremely net short at the moment, while the Large Speculators can be found at the other extreme to the long side. While this is not a guarantee that the market will turn around and move lower, there is at least a good chance that the market will not move much higher at the moment. We consider selling calls under these conditions, but with the idea of hedging the calls with some puts as soon as the market starts to shoot higher again.
Find out more about how to manage this and other trades in our daily detailed trading newsletter Traders Notebook.
© by Andy Jordan. Re-transmission or reproduction of any part of this material is strictly prohibited without the prior written consent of Trading Educators, Inc.
Trading Article with Commentary
by Master Trader Andy Jordan
Educator for Spreads, Options, Swing/Day Trading, and Editor of Traders Notebook
Benefits of Long-Term Charts
The longer term charts can be very revealing, even if you are a shorter term trader. Longer term charts are educational, and definitely help you to see things in perspective. Pay attention to what you see, and analyze in accordance with the following questions:
Note the yearly ranges for the commodities you trade. What is this yearly high and low, are they higher highs, lows and closes compared with last year? Does the close confirm price action? What is the long-term trend? How does this year's range compare with the last three years' average range? Should next year have greater volatility than this year? How much, in dollars, was the price move from the annual lowest low to highest high? How much did you take out of that range? What should next year's high and low be for the commodities you trade, based on the yearly trend analysis?
These questions define the yearly long-term price bars, using the monthly price bars to answer them. Use weekly price bars to answer major trend questions for monthly highs and lows.
© by Andy Jordan. Re-transmission or reproduction of any part of this material is strictly prohibited without the prior written consent of Trading Educators, Inc.
Ambush Method Trade and Performance Report
by Master Trader Marco Mayer
Educator for Forex and Futures, System Trader, and Creator of Ambush Trading Method
It’s time to look at the stock market again, after all the examples about currencies and commodities! This week, I've chosen one of the less popular futures markets among traders, the EuroSTOXX 50, traded at Eurex.
It seems that retail traders usually prefer the DAX, since there’s more action, and the tick value is much higher. In my opinion, the DAX tick is too high for most traders, often leading to margin calls. Happily, there’s a Mini-DAX Futures now, which I think has a lot of potential!
For a strategy like Ambush that require larger stops, the EuroSTOXX is a much better choice for most traders. It’s also easier to predict, and has less noise and fewer crazy moves than the DAX. Plus, there’s a lot more volume in the EuroSTOXX.
Looking at the daily chart of the FESX, we can see tons of consolidations, hard to predict price moves, and many reversal-bars or other bars with long-tails. This is perfect for Ambush, which was built to exploit exactly that kind of market action!
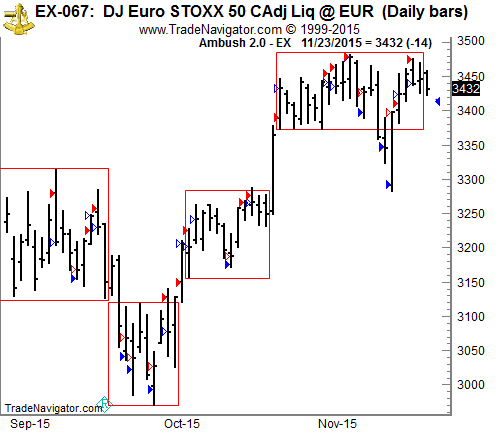
On the chart above are four different kinds of arrows:
Let's examine the results of those trades (including $10 for commissions and slippage round-turn) trading just one EuroSTOXX 50 Futures (FESX) contract:
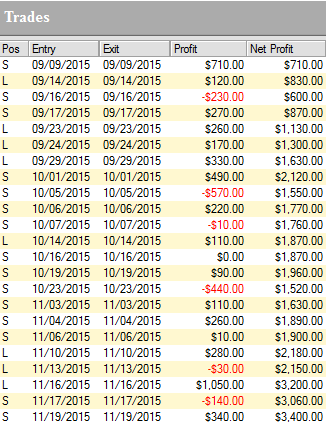
As you can see, Ambush managed to make a total of $3,400.00 profit (including $10 for commissions and slippage round-turn) trading just one contract without keeping any positions overnight!
Click on the link below to see the long-term performance of the EuroSTOXX 50 Futures (FESX) and all other markets supported by Ambush:
View The Reports Now
© by Marco Mayer. Re-transmission or reproduction of any part of this material is strictly prohibited without the prior written consent of Trading Educators, Inc.
To view previous published Chart Scan newsletters, please log in or click on "Join Us," shown above, to subscribe to our free "Members Only" section.
A WEALTH OF INFORMATION & EDUCATION:
Joe Ross-Trading Educators' popular free Chart Scan Newsletter has been published since 2004.
Note: Unless otherwise noted, all charts used in Chart Scan commentary were created
by using Genesis Financial Technologies' Trade Navigator (with permission).
Legal Notice and Copyright 2015 Disclaimer - Published by Trading Educators, Inc.
Chart Scan is a complimentary educational newsletter.
© by Trading Educators, Inc. Re-transmission or reproduction of any part of this material is strictly prohibited without prior written consent.
- Short Term Trading
- Futures
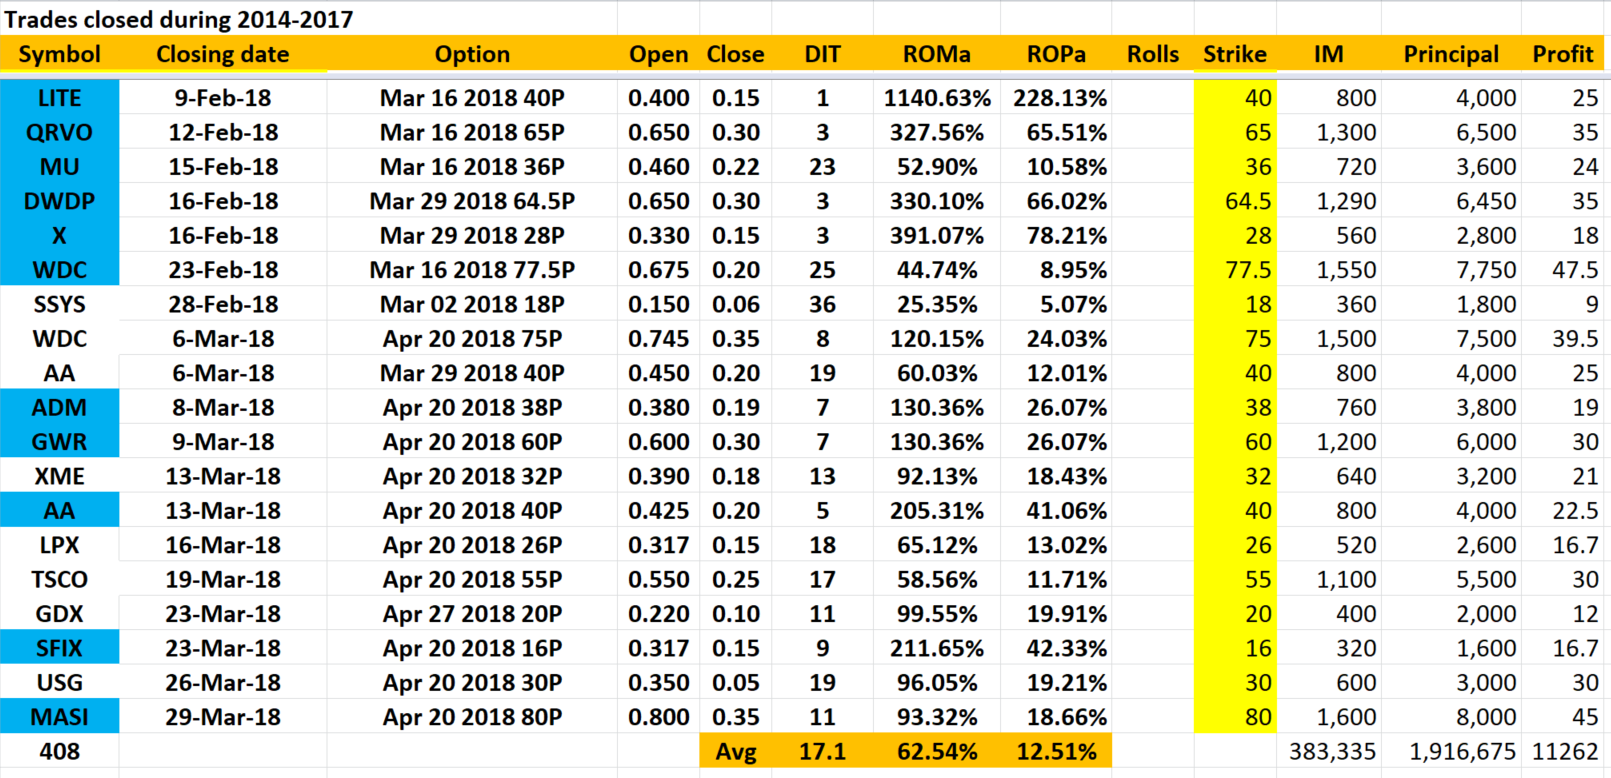
Links for details of trade:
SFIX
- Short Term Trading
- Futures
Joe Ross, Founder of Trading Educators created this program to teach his students how to trade using the IIG method. Joe has since passed away, September 2021, but his recordings still provide valuable teaching lessons. Let's get started learning the art of trading Joe Ross' way!
Welcome to the Instant Income Guaranteed
Webinar and Workshop Recordings
PLEASE FOLLOW THE STEPS BELOW TO HELP YOU GET STARTED
STEP 1:
For Beginners, How to Enter and Exit Trades. If you're ready to jump right in, skip to STEP 2.
STEP 2:
Start with the webinar recording which is 35 minutes.
PDF (36 pages) titled WEBINAR SLIDES can be downloaded below, please scroll down to bottom of the page.
STEP 3:
Next is the workshop recording which is one hour and 24 minutes.
PDF (128 pages) titled WORKSHOP SLIDES can be downloaded below, please scroll down to bottom of the page.
STEP 4:
Philippe Gautier has made new developments and modifications to the original method in this two part webinar. Part One is 20 minutes and Part Two is 16 minutes.
Windows 10 Users: Please use Chrome or Mozilla Firefox
PDF (43 pages) titled MODIFICATION SLIDES can be downloaded below, please scroll down to bottom of the page.
Synthetic Long & Rolling with Spread Orders
PDF: Put Roll Study - Time of Day
STEP 5:
Please carefully read our Q&A link below which is updated regularly as traders, like you, ask us questions.
Instant Income Guaranteed Q&A
If you have any non-trading related questions, please contact us and one of our team members will get back to you as soon as possible.
We wish you the best in your trading!
Joe Ross (Founder of Trading Educators) and Philippe Gautier (IIG Administration and New Developments)









