Trades in Stock Options. Receive daily trade recommendations. Can you imagine discovering a way to trade that promises instant income? If you think such a method is impossible, think again. It is definitely achievable, and everything you need to know is available online for one low price that includes special three-part online webinars.
Ambush is a time-proven mean-reversion day trading System focused on a variety of Futures markets around the globe. With Ambush Signals you can now easily follow the Ambush System on a subscription basis for educational purposes.
If you didn't fail early in your trading business, then you have probably been around long enough to realize that many of the problems you encounter as a trader are those that derive from your own individuality. Such problems are common among traders and, in fact, common among all human beings. Seeking spiritual help from a power much greater than your own is the area I address in the "Spiritual Side of Trading".
In life and in business, we prepare ourselves to head down a certain path, to quickly find that alterations need to be made in order to continue in a good direction. Those who have surrounded themselves with trustworthy and reliable resources will celebrate their success sooner.
Law of Charts with Commentary
by Master Trader Joe Ross
Author, Trader, Trading Mentor, and Founder of Trading Educators, Inc.
Old Style Chart Reading Still Works
The Law of Charts is to a large extent about chart reading, and chart reading incorporates some of the observations made by traders over 100 years ago. While these kinds of observations do not follow the strict rules of the Law of Charts (TLOC), they are interesting, and it is exciting to see them work. Of course we know that nothing works all the time, but it might be interesting to learn from the chart below.
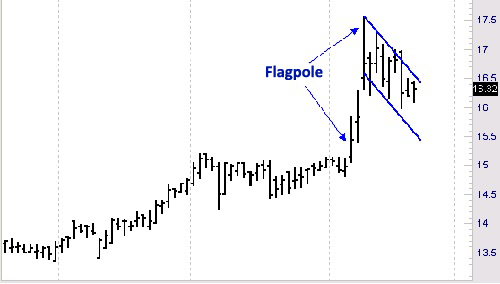
The "wisdom of the ages" states that following a breakout from consolidation, if prices shoot up creating what looks like a "flagpole," and are then followed by a flag or pennant formation such as you see on the chart, when prices resume rising, they will rise again by the height of the flagpole. The flagpole begins its ascent at 15.20, which is a violation of the high of the consolidation. Prices then rise to a high of 17.56, so the total height of the flagpole is 2.36.
The low of the pennant formation is 15.98. Therefore, the projection is that prices will rise to at least 18.34.
by Master Trader Joe Ross
Author, Trader, Trading Mentor, and Founder of Trading Educators, Inc.
Whether you are a long-term investor or a short-term trader, you might be looking through reams of information, such as charts, analyst commentaries, and financial statements, to arrive at a wise decision. You may have to sift through it all, weigh it appropriately, and use your intuition to make the most informed decision possible.
In the end, it's usually an educated guess. Traders are hardly objective, logical processors of information. They suffer from what decision-making theorists call confirmation bias. When devising a trading plan, there is strong pressure to reach a decision and implement a plan. The consequences of a wrong decision can be financially disastrous. The added pressure can get to us. Rather than look at each piece of information objectively, we tend to pay closer attention to information that confirms our initial decision, while ignoring contrary information.
If you want to make sound trading decisions, you must fight the urge to seek out information that supports your initial expectations. As a basic rule of thumb, when trying to arrive at a sound decision, you should spend more of your time looking for information that goes against your initial hunches than information that confirms them.
Because of the short week ahead of us, I've decided to head for the beach for a few days (until Sunday). Of course, I will take my "trading stuff" with me (Laptop, Smartphone) to watch and manage my open trading positions. Visit Andy's blog post to read more.
In his latest video, Marco gives you some insights on his journey into the world of traditional trend following. He talks about how trend following works, what to consider, and if it's a trading style for the average trader to consider. This is Part 1 of a 2-Part series. In his next video, Marco will go into the details of his backtests.
To view previous published Chart Scan newsletters, please log in or click on "Join Us,"
shown above, to subscribe to our free "Members Only" section.
A WEALTH OF INFORMATION & EDUCATION:
Joe Ross-Trading Educators' popular free Chart Scan Newsletter has been published since 2004.
Note: Unless otherwise noted, all charts used in Chart Scan commentary were created
by using Genesis Financial Technologies' Trade Navigator (with permission).
Legal Notice and Copyright 2016 Disclaimer - Published by Trading Educators, Inc.
Chart Scan is a complimentary educational newsletter.
Here's some trading humor: A few days ago I booked a lot of money on a trade with a water development company. Today a man knocked on my door and asked for a small donation towards the local swimming pool. I gave him a glass of water. Now, I’m wondering if I did the right thing.
Law of Charts with Commentary
by Master Trader Joe Ross
Author, Trader, Trading Mentor, and Founder of Trading Educators, Inc.
Trade What You See
Trading Educators teaches traders to trade what they see, not what they think. But as a trader, you will never see anything if you fail to first look!
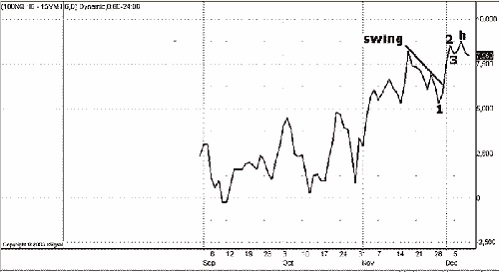
Fairly often a trade comes along that is extremely obvious. I'm wondering right now how many traders missed the absolutely easy-money Intermarket spread. The spread calls for going long the E-mini Nasdaq 100 and short the Mini Dow.
Simple observation was all that was needed to make the trading decision. The CBOT gives a 90% margin credit if you will trade the spread as a ratio spread. To obtain the credit, the CBOT called for entering 3 Mini Dow contracts vs 5 E-mini Nasdaq contracts (Note: The ratio can change).
As you can see below, The Law of Charts is at work in spreads as well as in outright futures or stocks. In fact, The Law of Charts works with any kind of chart you want to use. It works with bar charts, line charts, point and figure charts, and candlestick charts. As long as a chart has a horizontal axis and a variable vertical axis, you can see The Law of Charts in action. The Law of Charts™ states that a 1-2-3 low occurs only at the end of a trend or swing. Since the low of the swing on the chart moved lower than the low of the previous retracement, the line I have drawn indicates a downswing. If you will take a look at your own charting software, you will see that the Nasdaq futures are moving sideways, while at the same time the Dow futures are moving down. This gives the reason for the spread to work.
by Master Trader Joe Ross
Author, Trader, Trading Mentor, and Founder of Trading Educators, Inc.
Jack and John have just started a small trading business. Jack says, "I can feel it. We're going to make a fortune. By this time next year, we'll be rolling in money."
John counters, "I doubt it. That would take a miracle."
Jack says, "You're such a pessimist. Why are you so bleak?"
John argues, "I think we'll be successful. But I don't think it's going to happen overnight. It's going to take some time, and a lot of hard work!"
John is a realist. He knows they will make huge profits eventually, but he does not falsely believe that a miracle will happen. Becoming a winning trader will require that you overcome endless setbacks. It's important to be optimistic, but it is more important to be realistic. If you are overly optimistic, like Jack, you are setting yourself up for failure. You may take unnecessary risks, or be especially disappointed when you encounter the endless setbacks that are commonplace in trading.
If you want to beat the odds and become a winning trader, then you must doggedly make trade after trade, even when you face endless setbacks. It takes a rare person to be able to pick oneself up after a fall and be ready to face each setback with enthusiasm.
Optimists do better in school, win more elections, and succeed more at work than pessimists. A study of several occupational groups from top notch winning athletes to traders on the floor of the exchange, found that optimists do better. What's their secret? It is in how they explain setbacks or failures. They don't blame themselves. They don't believe that success or failure is a matter of enduring personality traits. Instead, they explain setbacks as the result of minor, controllable situations that have nothing to do with them personally. They believe that, with enough persistence, they will have a good outcome.
On the other hand, pessimism has its virtues. Pessimists may feel badly most of the time, but research studies have shown that they more accurately judge how much control they have over situational circumstances. Pessimists are more realistic in their judgments, and thus it may be beneficial to think pessimistically on occasion. Optimism may make you feel good, but pessimism helps you evaluate the feasibility of your plans, goals, or ideas. Traders, especially novices, are notoriously overly confident. Novice traders tend to over-trade, and are unrealistically optimistic. It's vital for survival to have realistic expectations when it comes to trading. Optimism helps you persist in the face of a setback, but a healthy sense of skepticism will keep you based in reality.
by Master Trader Andy Jordan
Educator for Spreads, Options, Swing/Day Trading, and Editor of Traders Notebook
In the video below, Andy reveals the the difference between Implied Volatility and Historical Volatility. Which volatility is important to an options trader (seller), and does one affect the other?
Profitable trades are attainable! To find out how to manage this and other trades, and also to receive our daily detailed trading newsletter, subscribe to Traders Notebook.
by Master Trader Andy Jordan
Educator for Spreads, Options, Swing/Day Trading, and Editor of Traders Notebook
The world's most successful traders believe in themselves and their ability to win. In fact, many of them feel that they “own” the market. They are not necessarily being arrogant, but they are sure of themselves and that they are able to take profits out of the market. Most importantly, they believe that they deserve to win. They have a mindset that is conducive to winning as a trader. It's essential that you make sure you, too, have such a mindset.
Do you find yourself acting as if you don't deserve to win? Do you waiver between two opinions, declaring that you know how to take big gains out of the market one day, and doubting whether you can really do the same the next day?
Do you often make gains, and then give them back, plus a little more sometimes? How about a lot more?
Deep down inside, you may be suffering from the work ethic. You may not believe making money easily is honest work. Is it possible that these beliefs interfere with your making easy money without a lot of guilt?
There is a powerful human need to hang onto tradition. Everyone in your family worked hard, so you must work hard. Have you considered that working smart might be a better way to go? When we stray from certain social mores and traditions, we feel confused and uneasy. Therefore, it's essential that we learn who we really are, and identify which beliefs we hold that prevent us from working smart and not hard. We need a mindset that is conducive to trading.
Money is a means of exchange that provides us with circumstances and experiences we could not otherwise have. There is plenty for everyone. Let’s face it, the government can always print more money. When we acquire wealth, we are able to support our loved ones, others, and ourselves more fully. We can be an asset to family and society.
For a few minutes, think about how you feel about the profits you make. Do you believe you deserve wealth? Do you believe you are justified in accumulating more capital than you currently have? Do you believe that by winning you are taking money away from others? Such negative beliefs are not consistent with trading success, so if you hold such beliefs, you are going to have to get rid of them if you want to “win” as a trader.
by Master Trader Marco Mayer
Educator for Forex and Futures, Systematic Trader, and Creator of Ambush Trading Method
Marco provides a video on YouTube. He talks about why having a view on the direction of a market isn't enough. The reason is that just having a directional view doesn't make a trade...find out why!!
To view previous published Chart Scan newsletters, please log in or click on "Join Us,"
shown above, to subscribe to our free "Members Only" section.
A WEALTH OF INFORMATION & EDUCATION:
Joe Ross-Trading Educators' popular free Chart Scan Newsletter has been published since 2004.
Note: Unless otherwise noted, all charts used in Chart Scan commentary were created
by using Genesis Financial Technologies' Trade Navigator (with permission).
Legal Notice and Copyright 2016 Disclaimer - Published by Trading Educators, Inc.
Chart Scan is a complimentary educational newsletter.
We have added a new feature to our site. Please take a few minutes to check out our blog. The "blog button" is located on the top right hand corner of this page.
Law of Charts with Commentary
by Master Trader Joe Ross
Author, Trader, Trading Mentor, and Founder of Trading Educators, Inc.
Exchange Volatility Stop
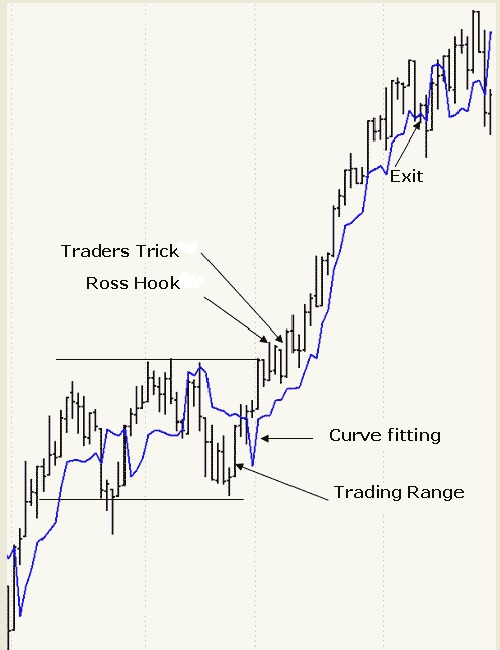
This week we are studying a 1-2-3 formation in combination with a Volatility Stop (VS). Volatility Stop can be used to track or contain a trend or a swing better than can a moving average. Since Genesis Trade Navigator has this study already programmed into it, I will use it to demonstrate how to go about setting it up.
When you see a trading range formation followed by a breakout from the consolidation area, and then a Ross Hook, you should immediately think "defined trend," and begin to also think "Volatility Stop."
What you want to do is to attempt to curve fit the Volatility Stop line around the formation including the breakout bar, so that you see containment of the formation. Then stay with the trade until prices move below the VS, or Stop Close Only below the VS, it’s your choice.
The VS has 3 parameters: a moving average, a multiplier, and an offset value. You can manipulate these three until you get containment.
by Master Trader Joe Ross
Author, Trader, Trading Mentor, and Founder of Trading Educators, Inc.
Trading is a challenging business. Not only is it tough to repeatedly pick one winning trade after another, it is also hard to control our emotions. Our emotions often get the better of us. Our expectations tend to influence how we feel as we trade, and when we doubt our abilities, we may have difficulty maintaining a winning attitude. One good approach to staying optimistic as we battle with the markets is to build up psychological momentum: start off ahead of the game, and build on that success. However, many traders set themselves up for failure. They start off making trading errors, and then dig themselves into an emotional hole from which they have trouble climbing out.
The expectations you have regarding a trade can dictate how you approach it. If you feel you are about to make a mistake, then you probably will make a trading error. As an example, you might have a perfectly good idea for a trade, but you may feel so on edge that you have trouble taking advantage of it. It often starts out innocently enough. You have a good trading plan, but you make a few little errors. Perhaps you trade under less than ideal market conditions, or you set your stop too close to your exit point and get stopped out. Maybe you don't put up enough capital to make your trading plan work.
Whatever it is, you may make a few poor decisions, end up with a losing trade, and feel disappointed. Making one bad trade isn't a big deal, but what happens when you make another losing trade, and then another losing trade, and so on? At that point, you may feel that it is hard to get out of the minor slump you are in.
How can you set yourself up to win? First, realize that trading can be much like a self-fulfilling prophecy: you secretly believe that your trading plan won't produce a profit, and then you subtly self-sabotage your plan by feeling uptight, overly exacting, and constrained. It is vital to feel relaxed and carefree when you start out the trading day. Think optimistically. Second, why not cheat a little? When you start the trading day, wait for an ideal trade, a trade you can afford to make, and which has a high probability of winning. If the first thing you do is to make a profitable trade, even a small one, you'll feel good on your first trade, and then you can start building on your solid start.
by Master Trader Andy Jordan
Educator for Spreads, Options, Swing/Day Trading, and Editor of Traders Notebook
Click on the video below for Andy's detailed explanation of how he would handle this multi-leg Soybean spread.
Profitable trades are attainable! To find out how to manage this and other trades, and also to receive our daily detailed trading newsletter, subscribe to Traders Notebook.
by Master Trader Marco Mayer
Educator for Forex and Futures, Systematic Trader, and Creator of Ambush Trading Method
Marco provides a follow-up video about stops in which he presents the concept of using smaller stops to risk less, and to achieve a better risk-reward ratio. While this is a popular concept, it unfortunately has its flaws if used in the wrong way. See for yourselves!
To view previous published Chart Scan newsletters, please log in or click on "Join Us,"
shown above, to subscribe to our free "Members Only" section.
A WEALTH OF INFORMATION & EDUCATION:
Joe Ross-Trading Educators' popular free Chart Scan Newsletter has been published since 2004.
Note: Unless otherwise noted, all charts used in Chart Scan commentary were created
by using Genesis Financial Technologies' Trade Navigator (with permission).
Legal Notice and Copyright 2016 Disclaimer - Published by Trading Educators, Inc.
Chart Scan is a complimentary educational newsletter.
We hope your January through February proves to be profitable. After one more month, March, you can evaluate your quarterly trades to make adjustments. If adjustments are necessary, make sure that they align with your trading plans.
Stop-Running
by Master Trader Joe Ross
Author, Trader, Trading Mentor, and Founder of Trading Educators, Inc.
Recently I showed a student how stop-running takes place in forex trading. Most forex traders are falling for the lie that, because liquidity is so great in forex, there is very little, if any, stop-running taking place. The truth is that that there is more stop-running taking place in forex than in futures.
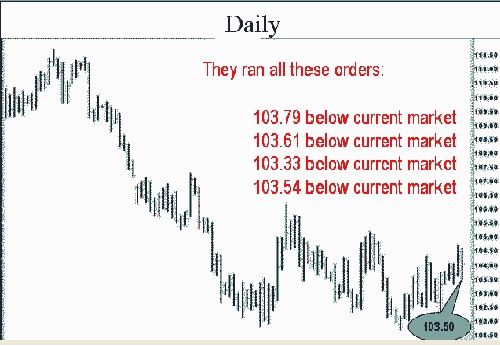
The chart below shows an example of stop-running in forex. Stops were located at the following levels the day before the last day you see on the chart. Our “Trading All Markets”, and “The Law of Charts In-Depth” recorded webinars will further explain this by teaching you how and where to place stops.
104.72 above current market
103.79 below current market
103.61 below current market
103.33 below current market
103.54 below current market
102.97 below current market
102.33 below current market
The last bar on the chart below shows The Law of Charts in action. One aspect of The Law of Charts is based on the fact that if there are stops in the market, the market movers will move prices to get as many of the stops as they possibly can.
In the case below, they were able to follow the line of least resistance, and took out the stops at the following levels:
103.79 below current market
103.61 below current market
103.33 below current market
103.54 below current market
by Master Trader Joe Ross
Author, Trader, Trading Mentor, and Founder of Trading Educators, Inc.
If you are like most people, you want to make a fortune, and you want to make it now. It is a reasonable wish. Who wouldn't want to make enough money to make all their dreams come true? But such a future-oriented focus is often the undoing of many traders. Making money in the markets takes time. You have to wait for ideal market conditions, and you have to build up the requisite trading skills to take home huge profits. And if you are like many traders, it will also take time to save up enough capital to trade on a scale that can make you wealthy. If you are serious about making it in the trading business, you will have to learn to be patient.
Many people can't wait to be rewarded. Depending on your style of trading, being unable to wait patiently can be a problem. For a long-term investor, for example, it is necessary to buy-and-hold long enough for a long-term strategy to play out. There may be minor fluctuations during the waiting period, but seasoned investors have learned to wait it out. Most novice investors, in contrast, impulsively sell as the masses panic, and buy the stock back at a top, which usually results in a losing trade. If you are a long-term investor, it is necessary to be able to control your impulse to take a profit and allow the price to rise over time. Even shorter-term traders, such as swing traders, must fight the urge to sell early. Although trades are held for much shorter windows, a swing trader must know how to wait patiently for the optimal time to sell.
Impatient traders tend to show a future-oriented focus. They dream of the profits they will make in the future, but at the same time, they desperately need them right now. Getting rid of impatience requires the trader to curb this future-oriented perspective, and focus on the near future. Traders can become more patient by following a set of specific steps.
First, it's necessary to admit that you are impatient. This can be difficult to do. It's hard to admit our limitations. One of the best ways is to make it impersonal. Pretend you are watching a television show about yourself. Pretend the character on television isn't you. Watch how impatient you are. See yourself as an objective observer would see you, and then think about how you might change. Second, imagine you have two "tuning" knobs in front of you. Pretend that one of the knobs controls your focus on the future. If you turn the knob to the right, you will focus years into the future.
Don't let impatience thwart your long-term economic plans. Impatience can dash traders' hopes for economic success. Without the proper discipline, you will make losing trades that will eat away at your account balance. By trading with patience, you can build up your account balance slowly and surely, and eventually reach your economic goals.
by Master Trader Andy Jordan
Educator for Spreads, Options, Swing/Day Trading, and Editor of Traders Notebook
Click on the video below to learn about a seasonal spread with a very good historical P&L statistic. Long October Sugar and short July Sugar is showing a nice seasonal up-move during the next few weeks.
Profitable trades are attainable! To find out how to manage this and other trades, and also to receive our daily detailed trading newsletter, subscribe to Traders Notebook.
by Master Trader Andy Jordan
Educator for Spreads, Options, Swing/Day Trading, and Editor of Traders Notebook
In order to succeed in trading, you will need a system or a plan. The usual way of attaining such a system is through many days of trading, hard-earned personal experience, not repeating mistakes you’ve made while analysing trades, knowledge of probability, observing other traders, trade simulation, book learning, seminars and mentoring, or any number of similar factors. Such a system will give you a correct mathematical and intuitive grasp, and once this hard-won system is in place, you should deviate from it only on rare occasions and for good reasons. Once you attain this system, it can operate almost by itself – you just do it, quite simply – almost naturally – without thought of opponents or outcome. If you don’t have a system yet, or feel unsure about the one you have, my mentoring program can help you to find the right system so that you can trade without hesitation or fear.
by Master Trader Marco Mayer
Educator for Forex and Futures, System Trader, and Creator of Ambush Trading Method
Marco talks about stop-losses in general, ways to decide on your stops that don't make much sense, and other pitfalls like using breakeven stops. Finally, he gives you some insights on his own systematic approach regarding exits, and how he likes to decide where to put a stop-loss.
To view previous published Chart Scan newsletters, please log in or click on "Join Us,"
shown above, to subscribe to our free "Members Only" section.
A WEALTH OF INFORMATION & EDUCATION:
Joe Ross-Trading Educators' popular free Chart Scan Newsletter has been published since 2004.
Note: Unless otherwise noted, all charts used in Chart Scan commentary were created
by using Genesis Financial Technologies' Trade Navigator (with permission).
Legal Notice and Copyright 2016 Disclaimer - Published by Trading Educators, Inc.
Chart Scan is a complimentary educational newsletter.
Our newest feature to Chart Scan is our trading videos. If you like what you see, feel free to send a quick email to the author with a topic that you'd like to see in a future publication. Happy Trading!
Consolidation to Ledge
by Master Trader Joe Ross
Author, Trader, Trading Mentor, and Founder of Trading Educators, Inc.
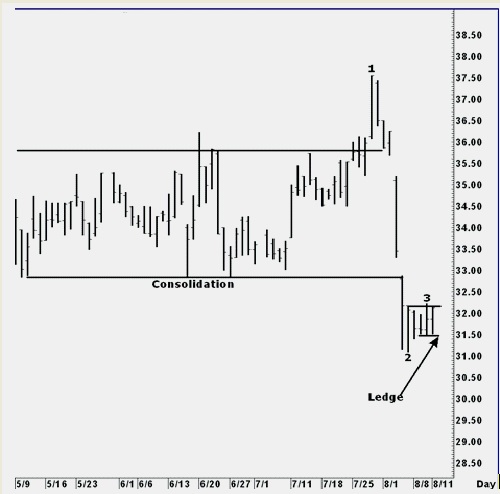
This week we are going to look at when a 1-2-3 formation cannot be taken seriously. It has to do with trading what you see.
It has been correctly stated that stocks are far more volatile than futures, and I agree 100% with that statement. You regularly see massive stop running in stocks. Stocks are one arena in which I try to avoid placing a physical stop in the market. If they see it, they will run it. Now, back to the 1-2-3 formation. By definition, we have a 1-2-3 high. But what else do we have? What else can you see?
I see that within the 2-3 portion of the formation there are two matching highs and two matching lows. Does that mean we have a ledge? The answer is no. Why? Because a ledge occurs only in a trend. This is not a downtrend we are looking at, it is a collapse--a stop-running meltdown. The chart is of a company that deals in water development and supply. Water is in short supply in much of the world. Ask yourself, is there suddenly more water around the globe?
What else can we see on this chart? It looks to me as though we are also looking at the downside breakout of a trading range that began in early May. If that is true, then the point I've marked #2 is really a Ross hook. A Ross hook is defined as the first failure for prices to move lower following the breakout of any type of consolidation area. And if this is a Ross hook, we have a Traders Trick Entry to go short on a breakout of 1 tick below the point labeled number 2. When you look at a chart, you have to decide which of what you see is actually the most truthful of what is really happening with prices.
by Master Trader Joe Ross
Author, Trader, Trading Mentor, and Founder of Trading Educators, Inc.
Many long-term traders and investors have trouble selling a losing position. It's hard to admit that you have made a mistake. There is a natural, human tendency to deny you've made a mistake, and thus, it is easier to leave losses on paper. When a loss is left on paper, unless it is part of your trading plan, you can tell yourself that circumstances will turn around. You can hope against hope that you'll end up profitable in the end. What usually happens, though, is that you hold the position and it loses even more money, and then the need to deny the loss and hold it is even stronger. Behavioral economists call this ailment the 'sunk cost effect.' When you sink enough money in a trade or an investment, you want to believe that it was worth it. Sunk costs effects happen in everyday life as well as in business.
First, become aware of the sunk cost effect. Acknowledge the very human tendency to deny making a mistake and the need to stick with a losing trade, even if it hurts you in the long run. It helps to be aware of the phenomenon and admit that it is a powerful effect. Second, remind yourself of the costs and benefits of holding the losing trade. Unless holding the loss is part of your trading plan, the benefit is usually that you don't have to admit you are wrong and face how much money you have lost. This benefit is relatively short-lived, however. While you hold a losing trade, you usually end up losing even more money, you feel guilty and worried about losing (and waste a lot of psychological energy trying not to feel guilty or worried), and you miss out on other investment opportunities as you obsess over your losses. Focusing on the disadvantages of holding a losing trade will help you close it. Third, focus on the future. People fall prey to the sunk cost effect because they focus on the past, 'I've already invested so much. I can't stop now.'
It is easy to feel paralyzed when in the midst of a losing trade. The worst thing you can do, however, is try to ignore the situation. You are human. You make mistakes. Everyone does. When you are in a losing trade, don't dig the hole deeper. Admit it, take action, and move on. The sooner you take action, the sooner you'll make up the loss. Don't get stuck; get moving, and take advantage of the endless investment opportunities available.
by Master Trader Andy Jordan
Educator for Spreads, Options, Swing/Day Trading, and Editor of Traders Notebook
Click on the video below to learn about the selling Canadian Dollar put options.
Profitable trades are attainable! To find out how to manage this and other trades, and also to receive our daily detailed trading newsletter, subscribe to Traders Notebook.
Backtesting a reader's day trading strategy for the e-minis
by Master Trader Marco Mayer
Educator for Forex and Futures, System Trader, and Creator of Ambush Trading Method
Marco highlights a readers question and backtests a day trading strategy for the e-minis. He also talks about such day trading strategies in general, and gives you some insights on trading costs, their impact on trading performance, and what kind of systems are more likely to work in the real markets.
To view previous published Chart Scan newsletters, please log in or click on "Join Us,"
shown above, to subscribe to our free "Members Only" section.
A WEALTH OF INFORMATION & EDUCATION:
Joe Ross-Trading Educators' popular free Chart Scan Newsletter has been published since 2004.
Note: Unless otherwise noted, all charts used in Chart Scan commentary were created
by using Genesis Financial Technologies' Trade Navigator (with permission).
Legal Notice and Copyright 2016 Disclaimer - Published by Trading Educators, Inc.
Chart Scan is a complimentary educational newsletter.
"Teach our students the truth in trading - teach them how to trade,"
and
"Give them a way to earn while they learn - realizing that it takes time to develop a successful trader."
Derivative transactions, including futures, are complex and carry a high degree of risk. They are intended for sophisticated investors and are not suitable for everyone.
There are numerous other factors related to the markets in general or to the implementation of any specific trading program which cannot be
fully accounted for in the preparation of hypothetical performance results, and all of which can adversely affect actual trading results.
For more information, see the Risk Disclosure Statement for Futures and Options.