Trades in Stock Options. Receive daily trade recommendations. Can you imagine discovering a way to trade that promises instant income? If you think such a method is impossible, think again. It is definitely achievable, and everything you need to know is available online for one low price that includes special three-part online webinars.
Ambush is a time-proven mean-reversion day trading System focused on a variety of Futures markets around the globe. With Ambush Signals you can now easily follow the Ambush System on a subscription basis for educational purposes.
If you didn't fail early in your trading business, then you have probably been around long enough to realize that many of the problems you encounter as a trader are those that derive from your own individuality. Such problems are common among traders and, in fact, common among all human beings. Seeking spiritual help from a power much greater than your own is the area I address in the "Spiritual Side of Trading".
He who asks a question is a fool for five minutes. He who does not ask a question remains a fool forever. - Chinese Proverb. Trading Educators invites you to join us and other traders in the forum in our free member area where you can ask questions and participate in discussions.
Euro FX
by Master Trader Joe Ross
Author, Trader, Trading Mentor, and Founder of Trading Educators, Inc.
In 2005, with the beginning of a dollar rally in effect there were certain things we should have noticed.
First, when everyone is short a currency the preponderance of traders left to buy are the shorts, who need to cover in order to take a profit. At that time, dollar bulls were virtually nowhere to be found and virtually no one wanted to hold dollars. We saw this situation reflected in the daily charts of both the Dollar Index and also in the forex daily charts of euro/dollar. Euro had moved to over 1.34 euros to the dollar. The Law of Charts™ accurately reflected this situation. However, it was a foregone conclusion that at some point in order to take profits, someone would have to begin buying dollars and selling euros in order to profit from both sides of the trade. When those dollar bears began to buy, they were joined by dollar bulls to the extent that buying had overcome selling.
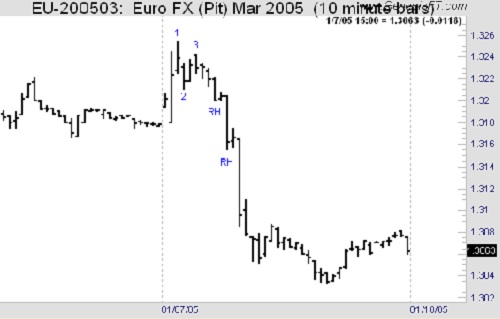
We see that reflected here on the 10 minute chart in classic Law of Charts formations. The Law of Charts can only, and does always reflect the truth about human action and reaction to events that underlie the markets.
There we three opportunities to join the euro selling: All three were Traders Tricks*: First was getting in ahead of a violation of the #2 point of a 1-2-3 high*; Second and third were getting in ahead of a violation of a Ross hook. Please note that the definition of a Ross hook includes the statement that:
Any failure by prices to continue in the direction of the move subsequent to a breakout of the #2 point of a 1-2-3 formation is a Ross hook.
*Descriptions for 123s and Traders Trick and are located in our free member area under TLOC and TTE tab.
by Master Trader Joe Ross
Author, Trader, Trading Mentor, and Founder of Trading Educators, Inc.
Hey Joe! As you trade, do you ever think, "It's all just random, why even bother trying at all?"
Markets are not random. If you passively think you have no control, you may end up making less money.
About 25% of wannabe traders tell us they have no strategy; they just see outcomes as random. Can it be that they actually believe that their actions would in no way influence the outcome of their trades?
Other traders tell us they have developed some sort of strategy or game plan. However, some of these strategies are based on the gambler's fallacy, the belief that after a string of losses, the odds should work in their favor or "even-out," since each trade is independent of every other trade. Of course, such a belief is irrational in that actual chances of success are not taken into account. A trader might believe that the chances of success are greater than they actually are. Nevertheless, it is better to use some sort of strategy, even if it is "irrational," than none at all.
Traders who come up with some sort of strategy, rational or not, believe that their actions have an impact on trading outcomes. Those traders made more trades than those who have no strategy, and make more money in the end. But, does this prove that markets are random?
During trading, it's easy to think that no matter what you do, you won't make a profit. The markets can be brutal at times, and it's tempting to fall prey to a victim mentality. Such beliefs may paralyze you. It's more productive to believe that if you take control, you'll make a profit. Even if you have no real control, it helps: You take action, you plan, and think of a some sort of strategy. When you take action, and make enough trades, the odds may work in your favor, and you'll end up with profits. So as you trade, take an action-oriented approach. As Mark Douglas suggests in "Trading in the Zone," the more you find excuses to avoid making trades, the less likely you'll be at actually taking home profits. But if you look for an edge, and use this edge to make numerous trades, you'll increase your chances of success. In trading, there are proven strategies that work under specific market conditions. If you look hard enough, you'll find them, and use them to your advantage. Always remember, markets are manipulated by those who have the power to move them.
by Master Trader Andy Jordan
Educator for Spreads, Options, Swing/Day Trading, and Editor of Traders Notebook
Click on the video below to learn about the selling Euro FX put options.
Profitable trades are attainable! To find out how to manage this and other trades, and also to receive our daily detailed trading newsletter, subscribe to Traders Notebook.
by Master Trader Andy Jordan
Educator for Spreads, Options, Swing/Day Trading, and Editor of Traders Notebook
No, trading is not a sin, but trading without knowing what you are doing can lead to a lot of problems. Trading, in and of itself, is not considered as gambling. The futures markets exist as a venue in which hedgers are able to “purchase” price insurance. The ability to hedge is the economic and social justification for the futures markets. However, gambling is considered to be foolish. Trading without adequate knowledge of the markets and self is foolish because, by doing so, you are gambling.
There is a certain amount of self-knowledge needed to choose the proper trading method. It has even been suggested that many small traders in the futures market, without knowing it, secretly want to lose. They jump in with high hopes - but feeling vaguely guilty. Guilty over 'gambling' with the family's money, guilty over trying to get 'something for nothing', or guilty over plunging in without really having done much research or analysis. Then they punish themselves, for these or other sins, by selling out, demoralized, at a loss.
To view previous published Chart Scan newsletters, please log in or click on "Join Us," shown above, to subscribe to our free "Members Only" section.
A WEALTH OF INFORMATION & EDUCATION:
Joe Ross-Trading Educators' popular free Chart Scan Newsletter has been published since 2004.
Note: Unless otherwise noted, all charts used in Chart Scan commentary were created
by using Genesis Financial Technologies' Trade Navigator (with permission).
Legal Notice and Copyright 2016 Disclaimer - Published by Trading Educators, Inc.
Chart Scan is a complimentary educational newsletter.
A famous quote by Winston Churchill should resonate with all of you during these volatile trading times: "To improve is to change; to be perfect is to change often." Trading Educators encourages you to improve in this way. Seek out those professionals who will guide you in the right direction. "False hope" products are all over the place, so beware, traders! We are here to answer your questions and to assist you in changing to following the right paths.
A special "Thank You" goes out to all of those who completed our survey. This information will be used to better serve our customers. Congratulations to Rik D., USA, who won a FREE one-hour mentoring session!
Hog Spread
by Master Trader Joe Ross
Author, Trader, Trading Mentor, and Founder of Trading Educators, Inc.
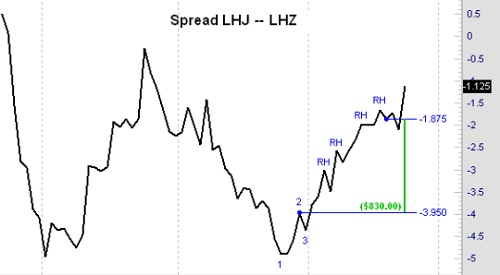
Spread trading can be fascinating. If you would have entered this spread at the breakout of the #2 of the 1-2-3 low, and exited the spread at -1.875, you could have made $830 per contract. The margin requirement of the spread at the time I did it was only $810, so it was possible to have made more than 100% on margin in less than three weeks.
Spread trading is one of the most profitable, yet safest ways, to trade stocks, ETFs, or futures. It offers many advantages, which makes it the perfect trading instrument for beginners and traders with small accounts (less than $10,000), and for professional traders who use spreads to optimize their trading profits.
While spreading is commonly done by the market "insiders," much effort is made to conceal this technique and all of its benefits from "outsiders," you and me. After all, why would the insiders want to give away their edge? By keeping us from knowing about spreading, they retain a distinct advantage.
We created a website with lots of free information about spread trading, follow this link: Spread-Trading.com. Andy Jordan, our expert spread trader, or myself, would be happy to give you training in spread trading.
by Master Trader Joe Ross
Author, Trader, Trading Mentor, and Founder of Trading Educators, Inc.
When navigating through the minefields of the trading day, it's crucial to stay calm and optimistic. There can be days when you have to overcome setback after setback, and unless you're mentally resilient, you can get beaten down to the point where you don't feel like getting back up. It's necessary to trade with the proper mindset. You must be ready to act effortlessly and skillfully. You must be in the right state of mind.
We can involuntarily and unexpectedly move back and forth between different states of mind.
Have you ever gotten into an emotional fight with a family member or friend? You may not know what came over you, but you may suddenly conjure up old memories. You may feel wronged, manipulated, or disrespected. The next thing you know, you're yelling at the top of your voice. In this angry and frustrated state of mind, you're likely to strike out in self-defense.
There are also positive states of mind. For example, you may fall in love with someone you just met, and believe that you've found the love of your life, a person who makes you feel safe and secure, and can do no wrong. At that point, you are consumed with thoughts and feelings that take over.
States of mind consist of thoughts, emotions, and expectations. They are powerful. When we are in a particular state of mind, we can lose control and act on impulse.
It's essential that you trade in the right state of mind. The proper state of mind for trading is that of a logical, calm, and objective thinker. But many times, we enter states of mind that aren't conducive to trading.
For example, it's easy to get yourself worked up by thoughts and images that create a sense of panic: "I'm losing too much money. If I keep making losing trade after losing trade, I'll wipe out my account. And worse yet, I won't be able to meet my future financial responsibilities. What will I do?"
When you start thinking negatively, you'll be consumed with self-doubt, and even a minor setback can cause extreme feelings of frustration and panic. If you let this negative state of mind take over, however, you'll start making trading errors. You'll stagnate, and become blind to new market opportunities.
You can also fall prey to positive states of mind. For example, when you let your fantasies of fame and glory take over, you may start to believe that you've found the perfect trade that will make all your dreams come true. Or you may think you are on an invincible winning streak. In this overconfident state of mind, you may take unnecessary risks and fail to look at the markets objectively.
Don't let overly positive or negative states of mind bias your ability to read the markets accurately. Be aware that your states of mind can change rapidly while under stress and uncertainty. And when you are in the grip of these thoughts and feelings, you can lose some of the psychological control you need to trade the markets objectively.
If you find yourself in a state of mind that interferes with your ability to stay objective, you might want to stand aside until it passes. In addition, it's also useful to identify which states of mind are likely to creep up while you trade, and script an "internal dialog" to counter it.
When you're overconfident, for example, you might think, "Don't get too excited. Stay objective and rational. Don't blow things out of proportion."
While frustrated with minor setbacks, you might think, "Look at the big picture. As long as I manage risk, I can get through this. I just need to keep my cool, and concentrate."
States of mind will overpower you only if you let them. If you can identify them quickly and counter them, you can cultivate the peak performance mindset you need to trade profitably.
by Master Trader Andy Jordan
Educator for Spreads, Options, Swing/Day Trading, and Editor of Traders Notebook
Click on the video below to learn about the Brent Crude traded on the CME Globex.
Profitable trades are attainable! To find out how to manage this and other trades, and also to receive our daily detailed trading newsletter, subscribe to Traders Notebook.
by Master Trader Andy Jordan
Educator for Spreads, Options, Swing/Day Trading, and Editor of Traders Notebook
Here are my five steps towards moving your trading up to the next level:
1. Focus on markets, trading vehicles (i.e. equities, futures, options, spreads), strategies, and time frames that are comfortable for you, and that suit your personality. The trades you make have to be "yours," not mine or those of anyone else.
2. Identify non-random price behavior, while recognizing that markets are random most of the time. Look for repetitive price patterns, but realize that once you begin trading them they may become short-lived.
3. Absolutely convince yourself that what you have found is statistically valid and tradable in the way you like to trade. Not all statistically valid situations will be comfortable for you, nor will they all fit your management style.
4. Set up trading rules, but remember that rules may have to change.
5. Follow the rules, but never to the point of destruction. You created the rule. If it stops working, change the rule, or throw it out entirely!
The bottom line: Personalize your trading (independence); and consistently do the right thing (discipline).
To view previous published Chart Scan newsletters, please log in or click on "Join Us," shown above, to subscribe to our free "Members Only" section.
A WEALTH OF INFORMATION & EDUCATION:
Joe Ross-Trading Educators' popular free Chart Scan Newsletter has been published since 2004.
Note: Unless otherwise noted, all charts used in Chart Scan commentary were created
by using Genesis Financial Technologies' Trade Navigator (with permission).
Legal Notice and Copyright 2016 Disclaimer - Published by Trading Educators, Inc.
Chart Scan is a complimentary educational newsletter.
Trader Survey deadline is today, February 5, 2016 and it expires at 11:30 p.m. US CST. Don't miss out! Click here to participate, it takes about five minutes, and receive a 30% off coupon and an entry into a drawing for one-hour mentoring. We thank all of you who have already completed it.
Simple Chart
by Master Trader Joe Ross
Author, Trader, Trading Mentor, and Founder of Trading Educators, Inc.
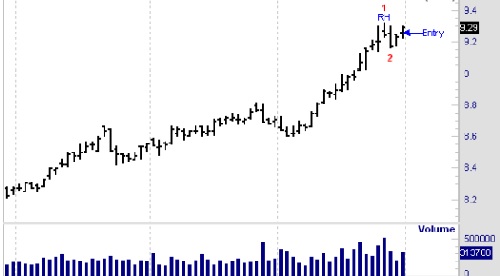
There are some things I want to point out on this simple chart. I entered long at the price where you see the arrow ($9.26), one tick above a Thursday high. I made this entry based on a Traders Trick, which called for entry at that price due to the fact that Thursday’s high was only the second bar of correction to the Ross hook (three or four correcting bars are allowed), and prices were moving strongly in an uptrend.
My thought was to take some profits on Monday, and move my position to breakeven as soon as possible. But notice also that every Ross hook is also the potential #1 point of a 1-2-3 formation in the opposite direction. In this case, the #1 and #2 points of a 1-2-3 high are made evident through Friday’s prices making a higher high. Notice also that Thursday’s prices made the necessary higher low that defines the formation.
Now, let’s look at some other factors to consider with regard to this trade. The Law of Charts teaches that when prices move from trending in a straight line to becoming parabolic, a correction is near. We don’t know exactly when it will occur, but we know that nothing goes up steeply for an indefinite amount of time. So, caution must be taken with this trade, and profits in some amount must be taken quickly at the first opportunity.
A second thing to look at is the fact that prices have already made the #1 and #2 points of what could well turn out to be a 1-2-3 high formation. The Law of Charts teaches that if this were to happen, the #2 point would then become a reverse Ross hook (RRh). RRhs and how to trade them are covered in my book Trading the Ross Hook. There is a way to filter RRhs so that most of the time you will trade them profitably.
Trading is, in large part, management. Anyone can get into a trade, but not everyone gets out profitably. I entered this trade with two possible strikes against me: the parabolic trend line and the potential 1-2-3 high. But with proper management and taking some money off the table quickly, there was no need to fear what lay ahead. I was able to take the Traders Trick boldly, knowing that if I managed the trade properly, I would come out ahead.
Start trading profitably today! Learn more about "The Law of Charts" to receive many tips and tricks that make it easy for you to use it in your trading.
by Master Trader Andy Jordan
Educator for Spreads, Options, Swing/Day Trading, and Editor of Traders Notebook
Click on the video below to learn about the September – May 2016 Coffee calendar spread (KCU16-KCK16).
Profitable trades are attainable! To find out how to manage this and other trades, and also to receive our daily detailed trading newsletter, subscribe to Traders Notebook.
by Master Trader Andy Jordan
Educator for Spreads, Options, Swing/Day Trading, and Editor of Traders Notebook
No one likes to think about the worst-case scenario, or to make a detailed plan to recover should it happen. It's just one strategy for learning how to trade in a relaxed but focused way so that should you ever face a severe financial setback, you can recover from it. Trading requires intense concentration and focus, and it's difficult to maintain this posture when the pressure to perform is on you. Therefore, you have to do whatever you can to minimize any expected psychological pressure.
The most obvious ways to relieve such pressure is to think in terms of probabilities, and carefully manage risk. By that I mean avoid overtrading, fast markets, exceptional tick size, and be careful just ahead of reports that might drastically affect price movement. Avoid illiquid markets, and avoid adding new risk when it appears a trend might be nearing its end.
It's useful to remember that you may not win on any single trade, but after a series of trades you will have enough winners to make a profit in the long run. It's also important to manage your risk. Determine your risk up-front, and risk only a small amount of trading capital on a single trade. By doing that you will ease a lot of the pressure, allowing you to be more open to see the opportunities that the market offers. Don't break under the pressure of a potentially fatal loss. Think about the possibility, and be ready to recover from it.
by Master Trader Marco Mayer
Educator for Forex and Futures, System Trader, and Creator of Ambush Trading Method
To refresh your memory, we reviewed the Australian Dollar Futures (6A, AUD/USD Spot Forex) in December, 2015. This market had been trading above a significant support level.
Because it has failed to trade through that support level, it is now trading below it. This makes for an interesting chart, while giving me an opportunity to also give you an update on Ambush in that market, so let’s have a look!
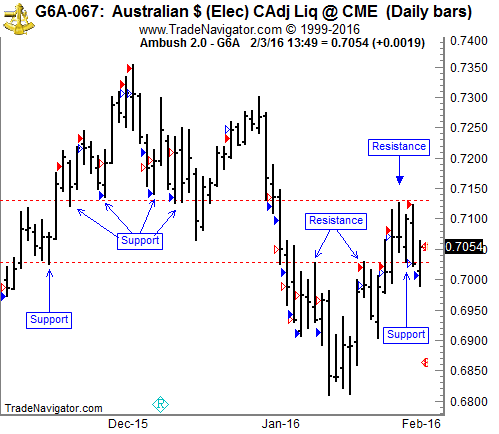
Right now the Aussie is trading between two interesting price levels, 0.7030 and 0.7130. As usual with these levels, they’re more to be seen as price-zones than exact price levels, but I guess you can get the idea by looking at the chart. The question is to which side the market might finally break out, and to be honest, I have no idea.
The good news is that I really don’t need to know, and I don’t even care about it. We’re not fortune tellers, we’re traders, right?! As traders, we make money by trading an edge, not by making guesses about the future.
As I’m writing this (Wednesday afternoon) we’re long the Aussie, trading Ambush, with an entry at 0.7006 (LIMIT Entry that we put in yesterday, no need to watch the markets during the day). Right now the market is trading at 0.7054 and we’re up about $500 on the trade, so it looks as if that support did hold again, and we’ve seen a "false breakout" tonight. But, of course, there are still about 8 hours of trading left…
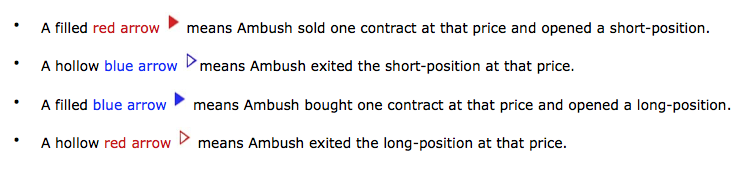
On the chart above are four different kinds of arrows:
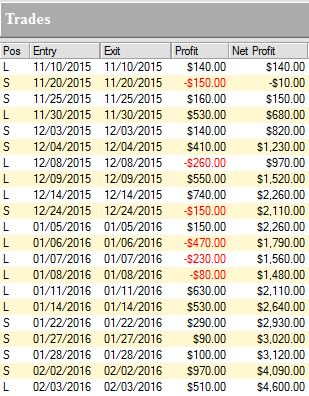
Let's examine the results of those trades (including $10 for commissions and slippage round-turn) trading just one Australian Dollar Futures (6A) contract:
As you can see, Ambush managed to make a total of $4,600 profit (including $10 for commissions and slippage round-turn) trading just one contract, without keeping any positions overnight!
Click on the link below and look at the menu on the right to see the long-term performance of the Australian Dollar Futures (6A) and all other markets supported by Ambush: View The Reports Now
Survey expires tonight, February 5, 2016 at 11:30 p.m. US CST!
Receive a 30% off coupon and an entry into a drawing for one-hour mentoring.
To view previous published Chart Scan newsletters, please log in or click on "Join Us," shown above, to subscribe to our free "Members Only" section.
A WEALTH OF INFORMATION & EDUCATION:
Joe Ross-Trading Educators' popular free Chart Scan Newsletter has been published since 2004.
Note: Unless otherwise noted, all charts used in Chart Scan commentary were created
by using Genesis Financial Technologies' Trade Navigator (with permission).
Legal Notice and Copyright 2016 Disclaimer - Published by Trading Educators, Inc.
Chart Scan is a complimentary educational newsletter.
The first month of the new year has almost ended, with hopes of trading successes during this volatile market coming to fruition. Trading Educators is here to help plant information which ensures deep roots for solid and steady growth.
A reminder that our Trader Survey is still available until February 5, 2016. The link is located at the top of our newsletter. Feel free to participate - we value your input. Thank you. Click here to participate, it takes about five minutes, and receive a 30% off coupon and an entry into a drawing for one-hour mentoring.
Aggressive/Conservative
by Master Trader Joe Ross
Author, Trader, Trading Mentor, and Founder of Trading Educators, Inc.
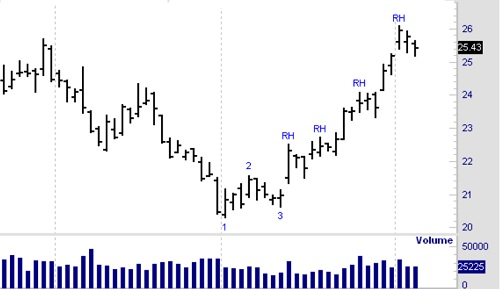
Prices were moving down. We see an end to selling, which was the low at point 1. As prices started to rise, shorts began to cover in order to take profits. Their buying, aided and abetted by the entry of longs who thought this was the bottom, caused prices to rise to the number 2 point. Some longs, looking for a quick profit, began to sell. They were joined by traders who felt that what they were seeing was a minor market rally. Prices headed back down to the number 3 point.
However, there was not enough supply at those low prices to warrant continued selling, so demand took the market higher. As prices rose, selling came into the market as longs liquidated all or part of their position, creating a Ross Hook (RH). Prices then violated the high of the Ross Hook, and a new uptrend was established.
Prices were moving up, and several corrections took place. These corrections were caused by longs taking profits. They sold in order to cover their positions, thereby causing the market to correct. The corrections left behind a minor or intermediate high which we call the point of the Ross Hook.
by Master Trader Andy Jordan
Educator for Spreads, Options, Swing/Day Trading, and Editor of Traders Notebook
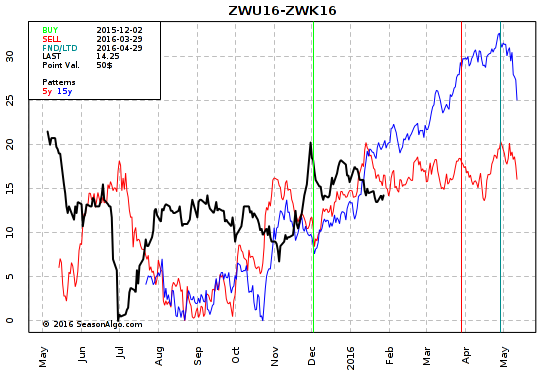
We are looking into a Wheat calendar spread ZWU16-ZWK16: long the September 2016 and short the May 2016 Chicago Wheat. Andy, in his video, explains precisely how he would manage the entry and the risk.
As an added value for our customers, Andy Jordan has provided a 3-minute video that delves deeper into understanding what is on the chart above.
Profitable trades are attainable! To find out how to manage this and other trades, and also to receive our daily detailed trading newsletter, subscribe to Traders Notebook.
by Master Trader Marco Mayer
Educator for Forex and Futures, System Trader, and Creator of Ambush Trading Method
Hi Marco, I’ve read that what really matters in trading are exits, not entries. The book stated that even random entries can make money with the right exits. Is this true?
Ah, another often-repeated misconception in the world of trading! I really like to get these questions from traders in order to correct their misinformation. In past articles I’ve answered questions from traders such as "is the right psychology/mindset all I need to be successful?" and "is careful money-management all I need to succeed?" Now there’s usually some truth in those statements, but they always go a bit too far in the other direction. Balance and common sense are ultimately what’s going to make things work. Traders have found my writings to be helpful in becoming a successful trader, so including this question, at some point I’ll have enough of these to publish a book.
Let’s get back to the question at hand. Which one is more important, how to enter or how to exit a trade? In my experience, both are equally important, and actually impossible to separate. There are good and bad exits for different kinds of entries.
Just think about it logically. Let’s say we have three strategies.
A long-term trend-following strategy in which we try to capture moves that last weeks to months. Naturally, we don’t want to set profit targets here, since we know it’s the huge winners who will make this work long-term. For that, we’re willing to give back huge parts of open profits.
A short-term breakout strategy in which we want to capture a possible breakout lasting for a few days, trying to not give too much back.
A short-term mean-reversion strategy in which we’re unsure as to when the market will reverse. We want to give it some room, but as soon as it does bounce, we want to take profits quickly.
Could we use the same exit for each of these strategies? Will a trailing-stop exit be helpful with the mean-reversion strategy? Is a profit target going to help us with the trend-following strategy? Does it make sense to give the breakout-trades a lot of room to develop, and use a very wide stop-loss?
To all of these questions the answer is no. There are exit strategies that make sense for each of these strategies, but if you mix them up, they’ll no longer work. Which to me proves my point, that both entries and exits need to be compatible with each other, and are therefore equally important.
And no, you probably won’t make money with random entries. Well, in the short run maybe you do if you’re lucky, but in the long run, reality will prove you wrong. I’ve seen some articles that state otherwise, showing pseudo-random entries that haven’t been random at all (that for example enter at a specific time each day) or where the exit-strategy was actually part of the entry (for example using stop and reverse exits/entries).
Now, should you find a exit strategy that’s not curve-fit for a specific market and timespan, that does provide an edge with really random entries, please send me an email. I’d be very happy to hear about it, since so far I’ve failed to discover such a thing.
Complete it on or before February 5, 2016 to receive a 30% off coupon
and an entry into a drawing for one-hour mentoring.
To view previous published Chart Scan newsletters, please log in or click on "Join Us," shown above, to subscribe to our free "Members Only" section.
A WEALTH OF INFORMATION & EDUCATION:
Joe Ross-Trading Educators' popular free Chart Scan Newsletter has been published since 2004.
Note: Unless otherwise noted, all charts used in Chart Scan commentary were created
by using Genesis Financial Technologies' Trade Navigator (with permission).
Legal Notice and Copyright 2016 Disclaimer - Published by Trading Educators, Inc.
Chart Scan is a complimentary educational newsletter.
The new year has ignited us to create new ways to reach out to our traders to meet your needs. We don't specialize in just one market, we are able to cover the majority of them because of our experienced traders who make up Trading Educators. In order to continue the highest standard of teaching, we have created a trader survey in which we would appreciate your participation. Thank you to those who have already submitted their valuable input. Click here to participate, it takes about five minutes, and receive a 30% off coupon and an entry into a drawing for one-hour mentoring.
Strategy
by Master Trader Joe Ross
Author, Trader, Trading Mentor, and Founder of Trading Educators, Inc.
Trading Educators suggests trading with at least two contracts, and preferably three. The reason for this, except when we are scalping all contracts at once, is to use one contract to cover costs and take a small profit, and then allow the others to ride to a reasonable profit level. We believe in never trying to "take" or force the market, only "accept" what it gives you.
This differs considerably from the mind-set of most traders who are driven by greed to seek to squeeze every last penny from each and every trade.
We use a three contract concept: One contract is cashed as soon as possible to cover costs, with at least a small profit. The stops for two contracts are then pulled up to breakeven as soon as is practical.
When the market yields a few more ticks, the second contract is cashed, thereby locking in a greater profit for the trading effort. The third contract stop is held back at breakeven for as long as possible, to allow the trade to earn the most profit.
As profits are earned, a stop is trailed according to any one of a number of acceptable methods. The stop is never allowed to do any worse than breakeven.
This management technique derives from a different attitude towards the markets than is commonly taught and practiced by the majority.
You probably have heard and read that a trader should learn to “love small losses.” Such an attitude is pure nonsense. My philosophy of trading is to learn to hate losses, and reluctantly settle for break-even. It yields a totally different result from learning to love losses. The trader who learns to love small losses expects to have them, and so he does.
Conversely, the trader who learns to love to win, and at worst to break even, begins to manage his trades, risk, and money in such a manner as to not lose.
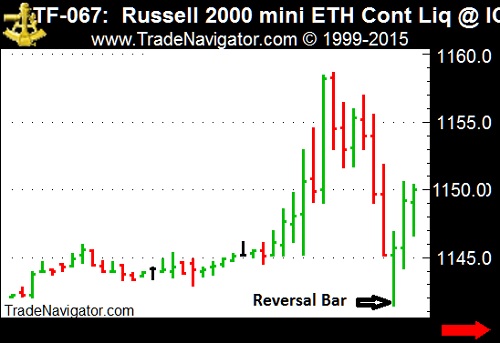
Let's now take a look at a day trade. Above you see the 30-minute chart of the e-mini Russell 2000. I went long at 1147.0 using a reversal bar technique that is taught during private tutoring. My risk was $300. I cashed first profits, 1 contract at +$100, and moved my stop to breakeven. Next profit was 1 contract at $200. The final contract was cashed for a $400 profit, making a total of $700 in profits. I realized enough profits to cover costs for all contracts, and to enjoy a satisfactory win.
This concept is described in my book "Day Trading."
by Master Trader Joe Ross Author, Trader, Trading Mentor, and Founder of Trading Educators, Inc.
If there are people in your life who do not support your efforts to become a successful trader, avoid them. Avoid those who express negative energy on a regular basis, and vent their hostilities towards you. Wherever possible, terminate unhealthy emotional relationships that cannot be repaired, and if necessary, do it immediately.
Negative energy has a cumulative effect that eventually wears down your positive attitude and energy to be successful. Life is too short to be with those who do not believe in you or your abilities to achieve success. A loving partner takes an interest in your work, encourages your efforts, expresses compassion during difficult times, and always tries to help you grow.
Sometimes it helps to find a trading office where, instead of getting a bunch of flack from those around you, you can find support, encouragement, and perhaps learn a few tricks from successful traders. I did say a trading office, not a newsgroup or chat room. All you will find in those places is a lot of negative energy, gossip, rumors, and most people who are so confused they can’t see the forest for the trees. For the most part, people who frequent those places are no better off than you are, and in many instances are a lot worse off. You cannot believe much of anything you hear in chat rooms. Sorry about that, but it’s true.
by Master Trader Andy Jordan
Educator for Spreads, Options, Swing/Day Trading, and Editor of Traders Notebook
This week we're looking at the 30-Yr US Treasury Bonds in order to develop an idea of how to trade them.
The bonds have been trading in a wide range for a long time, as you can see on the weekly chart above. Right now we are almost reaching the August 2015 high, and after that we might even go for the high of March 2015. We like the idea of going counter-trend by selling far out-of-the-money March calls, with a strike around 169 or 170. The March 2016 options expire in less than a month on 02/19.
As an added value for our customers, Andy Jordan has provided a 3-minute video that delves deeper into understanding what is on the chart above.
Profitable trades are attainable! To find out how to manage this and other trades, and also to receive our daily detailed trading newsletter, subscribe to Traders Notebook.
by Master Trader Marco Mayer
Educator for Forex and Futures, System Trader, and Creator of Ambush Trading Method
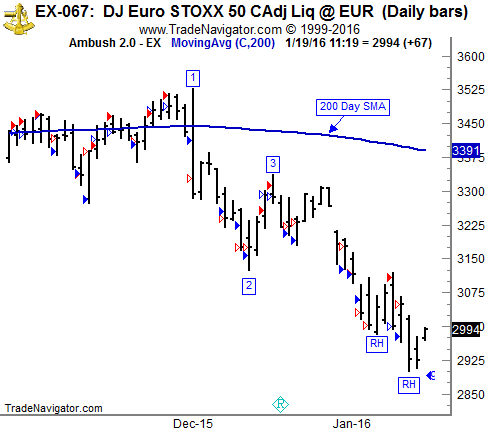
A lot has happened since November, the last time we looked at the EuroSTOXX 50 traded at Eurex. We are now looking at a completely different picture.
On the last update, we were close to reaching the point that is marked on the chart with [1]. Then there was a sideways market within a battered bull market, but since then the picture has cleared up significantly.
We’ve seen a strong price drop within a single day [1], which also marked a medium term high, and point 1 of a 1-2-3 high. From there, the price went straight down to create a significant point [2]. After a brief rally to point [3], the market continued to move lower, completing our 1-2-3 high pattern. Around the same time, the 200-day moving average started to decline, which is often a signal for a longer term trend change for which many traders are watching.
Since then, price is trading in a clear downtrend, giving us trading opportunities with Ross Hooks (RHs). On a larger picture though, we’re now trading around the lows of August/September 2015, which could give some support to the market.
As you can see, Ambush performed very well during all of these market phases by taking trades in both directions at extreme price levels.
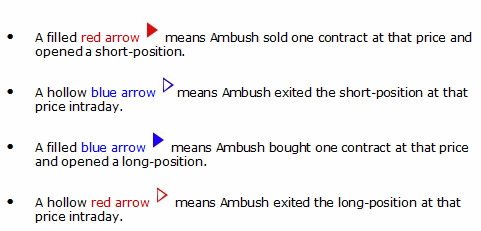
On the chart above are four different kinds of arrows:
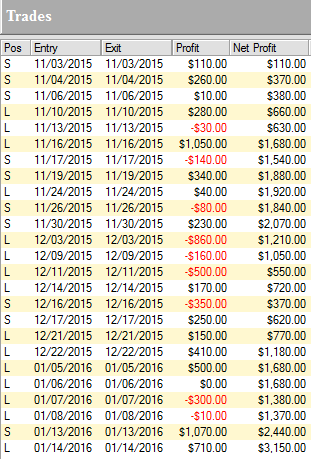
Let's examine the results of those trades (including $10 for commissions and slippage round-turn) trading just one EuroSTOXX 50 Futures (FESX) contract:
As you can see, Ambush managed to make a total of $3,150 profit (including $10 for commissions and slippage round-turn) trading just one contract, without keeping any positions overnight!
Click on the link below and look at the menu on the right to see the long-term performance of the EuroSTOXX 50 Futures (FESX) and all other markets supported by Ambush: View The Reports Now
Complete it on or before February 5, 2016 to receive a 30% off coupon
and an entry into a drawing for one-hour mentoring.
To view previous published Chart Scan newsletters, please log in or click on "Join Us," shown above, to subscribe to our free "Members Only" section.
A WEALTH OF INFORMATION & EDUCATION:
Joe Ross-Trading Educators' popular free Chart Scan Newsletter has been published since 2004.
Note: Unless otherwise noted, all charts used in Chart Scan commentary were created
by using Genesis Financial Technologies' Trade Navigator (with permission).
Legal Notice and Copyright 2016 Disclaimer - Published by Trading Educators, Inc.
Chart Scan is a complimentary educational newsletter.
"Teach our students the truth in trading - teach them how to trade,"
and
"Give them a way to earn while they learn - realizing that it takes time to develop a successful trader."
Derivative transactions, including futures, are complex and carry a high degree of risk. They are intended for sophisticated investors and are not suitable for everyone.
There are numerous other factors related to the markets in general or to the implementation of any specific trading program which cannot be
fully accounted for in the preparation of hypothetical performance results, and all of which can adversely affect actual trading results.
For more information, see the Risk Disclosure Statement for Futures and Options.










.png?i=620 "andy-606")