Trades in Stock Options. Receive daily trade recommendations. Can you imagine discovering a way to trade that promises instant income? If you think such a method is impossible, think again. It is definitely achievable, and everything you need to know is available online for one low price that includes special three-part online webinars.
Ambush is a time-proven mean-reversion day trading System focused on a variety of Futures markets around the globe. With Ambush Signals you can now easily follow the Ambush System on a subscription basis for educational purposes.
If you didn't fail early in your trading business, then you have probably been around long enough to realize that many of the problems you encounter as a trader are those that derive from your own individuality. Such problems are common among traders and, in fact, common among all human beings. Seeking spiritual help from a power much greater than your own is the area I address in the "Spiritual Side of Trading".
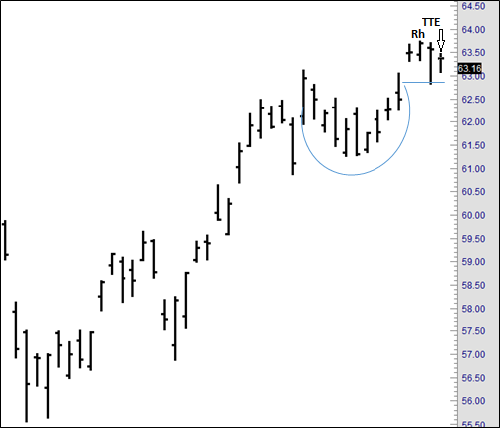
In one of my books I discuss the formation called "Cup with Handle." It is a formation that has been known about for a long time, and was first mentioned by that name by the publisher of "Investor's Business Daily." Actually the cup with handle is often nothing more than a head with a right shoulder. Lots of times the left shoulder is missing or, as in the case of the daily chart below, the left shoulder is there but very small and shallow. Notice this is an upside down head with a right shoulder to go long.
If you look closely you will see that the high of the cup "handle" is also a Ross Hook. Two days after the Ross Hook there was a Traders Trick Entry to go long at 63.40.
Over the years, I've had the most profitable results by always making an attempt to receive pay for the risk I am taking. I want to be paid to trade. Being "paid to trade" has become a slogan at Trading Educators. The moment you can realize some profit from a trade, the sooner the pressure is off. You sleep well during nights where you have taken some money out of the trade during the day. You make fewer mistakes. Your growth in your confidence and faith in what you are doing, and seeing that what you are doing is succeeding, do wonders for your feeling of well-being.
If a trade gives you $1000 from a risk you have assumed in the market, never give them back more than $500. If someone gives you $2000, keep $1200; $3000, keep $2100; $4000, keep $3200; $5000, keep $4500. Remember the Point of Diminishing Returns as applied to trading. Never allow a $1000 per contract open equity profit to become a loss. As the market moves further beyond the Point of Diminishing Returns, the probability of a short-term trend reversal increases exponentially. The best market moves make the majority of their initial profits in 2 to 6 days. Therefore, a higher percentage of profits needs to be protected as the market moves higher and you approach at least a temporary end to the current move. Traders feel good about themselves to the degree they control trade profits and losses. This is the psychological Law of Control applied to the trade decision-making process.
Philippe Gautier: Administration and New Developments
Developer: Joe Ross
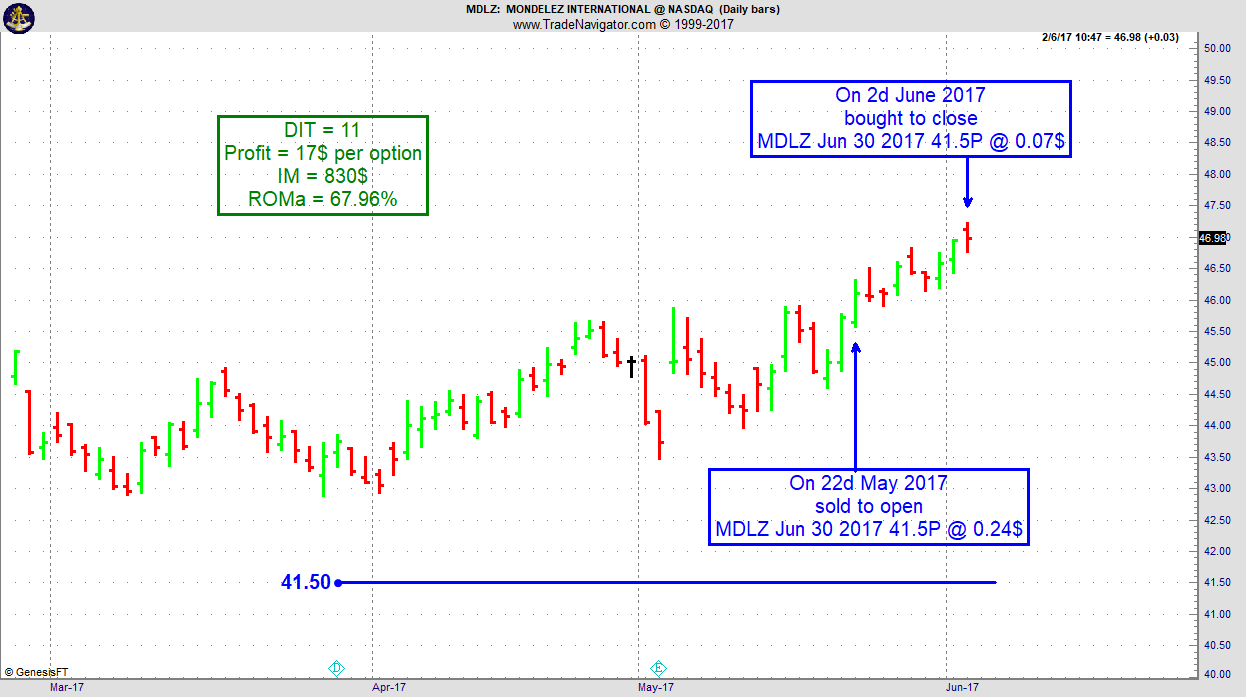
On 21st May 2017 we gave our IIG subscribers the following trade on Mondelez International (MDLZ). We decided to sell price insurance as follows:
On 22d May 2017, we sold to open MDLZ Jun 30 2017 41.5P @ $0.24, with 38 days until expiration and our short strike 9% below price action.
On 2nd June 2017, we bought to close MDLZ Jun 30, 2017 41.5P @ $0.07, after 11 days in the trade, for quick premium compounding..
Profit: $17 per option
Margin: $830
Return on Margin Annualized: 67.96%
We have also added new types of trades for our IIG daily guidance since 2016, "no loss" propositions with unlimited upside potential, still using other people's money to trade.
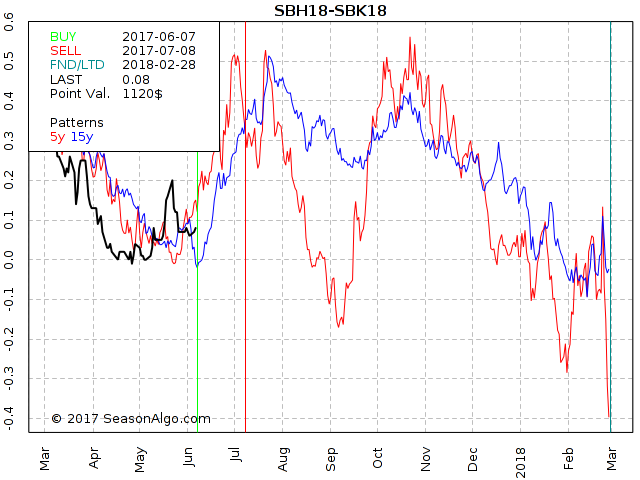
Sugar is one of the markets I use mainly for spreads. In general, the Soft markets are not easy to trade and, because of exchange data fee costs of about $110, expensive. The calendar spread catches my interest because we are right at the beginning of the seasonal time window (06/07-07/08), the statistic regarding seasonality looks promising with very small draw-downs in the past and also the chart looks like the spread might turn to the up-side soon.
Do you want to know how we trade this spread in Traders Notebook?
Did you know Traders Notebook Complete had its most profitable year in 2016?
Learn how to manage this trade by getting daily detailed trading instructions, learn more!
Day trading has always been a tough game, requiring a very strong psyche, discipline and a high level of trading skills to succeed in.
Nowadays though it's even harder due to the stronger competition, not only by humans but especially by computers trading at a speed a human trader simply can not match up to. High-Frequency Trading is happening in literally all of the popular markets out there and like Chess, scalping has become a game where humans cannot win against the AIs anymore. Add to that the speed/location advantage of the HFT shops and the odds of success decrease even more.
My advice is to forget about scalping. Even without the trading bots, odds of success to make money scalping are very low as the trading costs involved are incredibly hard to overcome. To not get completely killed by trading costs you need to trade in very liquid markets. But that's exactly where the robots are.
But not everything is lost, maybe all you have to do is to slightly adapt as a day trader. Here are some of the things you can do:
The longer your trades last, the higher your profits (and losses) will be on average. It's a simple fact, if your trades last 4 hours on average, you'll be much more likely to catch a big move than if you average trade lasts 5 minutes. This way the HFTs can't hurt you as much anymore and also trading costs will have much less of an impact.
You don't have to do 20 trades per day to be a successful day trader, quite the opposite! The more you trade, the higher your trading costs and believe me these trading costs will kill you in the long run.
Don't get married to a specific market, instead, diversify your day trading over different, uncorrelated markets. This will strongly increase your chances of success as you'll stop seeing opportunities in a market where there aren't any.
Day trade only markets that provide a good bang for the buck. I do this by looking at the average daily range of a market in relation to the average trading costs.
Trade the news. I know you often hear the opposite advice but if you learn how to do this right, trading the news is one of the best ways to day trade. Just look at the markets, especially currencies. Isn't it true that most big moves happen right when some economic report is coming out? Sure, volatility explodes and liquidity often isn't that great. But hey, isn't high volatility exactly what you're looking for as a day trader? Now first you need to do your homework of course and have a plan ready on how to trade each of the specific news events.
To view previous published Chart Scan newsletters, please log in or click on "Join Us,"
shown above, to subscribe to our free "Members Only" section.
A WEALTH OF INFORMATION & EDUCATION:
Joe Ross-Trading Educators' popular free Chart Scan Newsletter has been published since 2004.
Note: Unless otherwise noted, all charts used in Chart Scan commentary were created
by using Genesis Financial Technologies' Trade Navigator (with permission).
Legal Notice and Copyright 2017 Disclaimer - Published by Trading Educators, Inc.
Chart Scan is a complimentary educational newsletter.
On 23 June 2016, the United Kingdom EU Referendum (“Brexit” vote) will take place, creating potential for heightened market movements, including the real possibility of significant price gaps and periods of exaggerated illiquidity.
It is important that you be aware of the potential risk of this upcoming event, so that you can be both prepared and positioned properly as the date approaches. We encourage you not to over-leverage yourself, and to exercise extra care, diligence and discipline in your investment and trading.
by Master Trader Joe Ross
Author, Trader, Trading Mentor, and Founder of Trading Educators, Inc.
Tradable Markets
Regardless of what you trade, or where you live, the price of crude oil is going to affect your life. We are receiving many emails asking us about crude oil prices. Will they go higher? Will they go lower? Will the release of export restrictions bring down the price of crude oil and thus the price of gasoline?
My friends, I do not have the answers. When they passed out crystal balls, they somehow overlooked me. However, I think this might be a good opportunity to see what the daily chart was telling us some years ago. While we discuss the daily chart, please realize that as I wrote this the weekly and monthly charts show crude still in an uptrend, with the monthly chart indicating that the rise may have been be a bit too steep. On my charts oil prices had become increasingly parabolic.
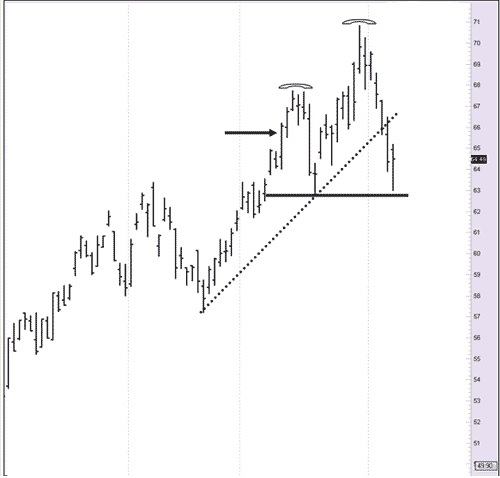
Now to the daily October crude oil futures chart, on which I will show only prices since June in order to conserve space.
Clearly, the dotted uptrend line had been broken. I drew a solid horizontal line at the base of what was officially a trading range in accordance with The Law of Charts. The arrow points to a price bar which typifies the vertical midpoint of the trading range. Inclusive of that bar, prices had been consolidating for 21 days. The Law of Charts states a probability of a breakout of the trading range is most likely to occur on days 21-29.
We can also see the left shoulder and head of what might have become a classical "Head and Shoulders" formation.
What does all this mean? I can tell you only what it meant to me - you are, of course, entitled to your own opinion. Keeping in mind that I have trained myself to trade only what I see and not what I think, I extracted myself from anything to do with short-term crude oil futures, and was standing aside at the time. Short-term conclusion was: get out of any short-term long crude oil positions. Prepare for the eventuality that a right shoulder may form. Prepare for further consolidation. Wait to see what develops.
What did I think? I thought crude oil had a very good chance of going much higher - perhaps even hitting the $100/bbl mark, which it eventually did. But obviously, not just yet. So for long-term stock holdings, I was willing to run my trend line along the weekly chart, but quite frankly, the monthly chart seemed to be a bit overdone. Long-term conclusion? Crude oil price will consolidate here for awhile, perhaps go a bit lower. This was a good opportunity for getting long and holding on for higher prices.
by Master Trader Joe Ross
Author, Trader, Trading Mentor, and Founder of Trading Educators, Inc.
After months of trading in a slump, Jake tells his best friend, "I think I want to quit the trading business. Why am I doing it? There must be a better way to make a living."
Have you ever felt like Jake? Trading is stressful and demanding. It's understandable to feel like “throwing in the towel” at times. If you are ready to find a new job, or if you just don't seem to have the same passion for trading that you used to, there is a lot you can do to reignite your desire to trade the markets.
Trading is a tough business. If you lose your passion for trading, all it means is that you are human. Here's an obvious cure. Why not take the rest of the month off? Maybe you're just stressed out. A little rest will help put things back in perspective. Once you are rested, relaxed, and re-energized, you'll be ready to tackle the markets with zeal.
Here's another strategy. Remind yourself of how great trading really is. You work for yourself (unless you are an institutional trader). You can work at your own pace, and feel that you have freedom. Remember what it was like to work a 9-to-5 job?
"Absence makes the heart grow fonder." Maybe you could arrange to visit a friend for a day at a regular 9-to-5 job. Or, when it is the holiday season, you could take time off from trading and find a part-time holiday job. It's not forever. It's just a way to rebuild your passion. Sometimes we forget why we trade. It’s like having a thrilling sports car, we start to see the “thrilling” job of trading as mundane. Drive a compact car for a week and you'll see how great your sports car drives. Work at a regular 9-to-5 job for a few weeks, and you will quickly rediscover your passion for trading. It may sound extreme, but it works. Maybe even after the first day, you'll think, "Oh, now I remember why I became a trader."
It's hard to trade successfully day in and day out. Some traders never lose their passion, but many forget just how exciting the markets can be. If you lose your passion, don't sit around sulking about how boring life can be. Go out to see how the other-half lives. You'll remember why trading is a great profession. And you will trade with renewed passion.
Winning traders cannot afford to be influenced by their emotions. The nature of trading demands an objective, logical approach. If you experience extreme excitement after a win and extreme disappointment after a loss, you will be living on an emotional roller coaster: up and down, up and down. Read more.
In this week's video, Marco talks about another very common trading mistake: trading your P&L instead of the actual market action. If you're struggling to become a winning trader, this might be an eye-opener, especially if you're a breakeven trader right now. If you have any questions, feel free to This email address is being protected from spambots. You need JavaScript enabled to view it., or post it in our Blog or Forum.
To view previous published Chart Scan newsletters, please log in or click on "Join Us,"
shown above, to subscribe to our free "Members Only" section.
A WEALTH OF INFORMATION & EDUCATION:
Joe Ross-Trading Educators' popular free Chart Scan Newsletter has been published since 2004.
Note: Unless otherwise noted, all charts used in Chart Scan commentary were created
by using Genesis Financial Technologies' Trade Navigator (with permission).
Legal Notice and Copyright 2016 Disclaimer - Published by Trading Educators, Inc.
Chart Scan is a complimentary educational newsletter.
Don't miss out! Sale ends this Sunday for Andy Jordan's Traders Notebook. Click Here for more details, and watch Andy's video that gives you a sneak peek to the Traders Notebook Campus.
The Law of Charts with Commentary
by Master Trader Joe Ross
Author, Trader, Trading Mentor, and Founder of Trading Educators, Inc.
Forex Trade
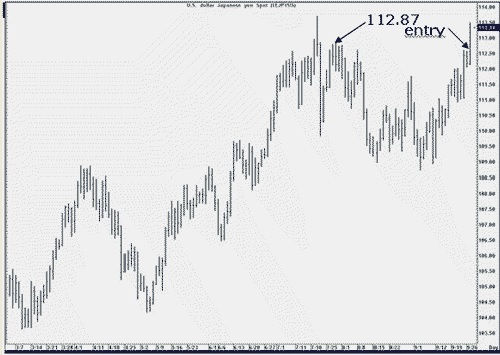
We’re referencing an older dollar-yen forex pair at a time that the Yen was making strong moves. There is a lesson to be learned from this older chart.
The move began with a 1-2-3 low formation. The number 2 point was violated, and then followed by three Ross hooks - two of them being the double-high kind. The Law of Charts states that following the breakout of the #2 point of a 1-2-3 low, every failure by prices to move higher constitutes a Ross hook.
On Monday, the 26th of September, prices failed to move higher, thereby giving us a Ross hook. The question then was: should we take a Traders Trick Entry with only a 2-tick difference between the highs of Friday the 23rd and Monday the 26th? I can only tell you what my own decision was, and why I decided to take the Traders Trick with only 2-tick’s clearance between Friday's high and Monday's high.
As I looked to the left of the chart, I saw that traders probably have stops just above 112.87. Contrary to the popular belief that there is no stop-running in forex, the truth is exactly the opposite: there is plenty of stop-running - but that's a story for another day. I figured if they took out Monday's high of 112.59, there was a good chance they would take a shot at 112.87, giving me enough pips on a day trade to take in the money I wanted to achieve from the trade. As you can see, they more than met my expectations, taking prices all the way to 113.51. I have often said that every trader needs to have rules, but there are times when common sense tells you to break those rules. That's what I did on Tuesday, September 27.
Can exchanges change the rules any time they want to?
by Master Trader Joe Ross
Author, Trader, Trading Mentor, and Founder of Trading Educators, Inc.
Yes, they certainly can, and do. In 2015-16 NASDAQ eliminated all types of orders other than limit orders. Following shortly after, NYSE did the same thing. The thought of not being able to place a stop-loss order in the market was mentally devastating to many traders. The same was true for eliminating “Good 'til Canceled” orders (GTC). This action by the exchanges threatened to seriously reduce trading volume, and to force traders into becoming day traders, having to sit in front of a screen all day long simply to monitor their positions. The only other choice would have been to trade stocks only through mutual funds and exchange-traded funds.
Fortunately, most, if not all, stock brokers changed their software to handle these, and even more kinds of orders than the exchanges had ever allowed.
In 1980, few who were trading at the COMEX at the time the Hunt brothers tried to corner the silver market, will ever forget that the exchange forbid the Hunt's from buying silver futures.
Federal commodities regulators introduced special rules to prevent any more long-position contracts from being written or sold for silver futures. This stopped the Hunts from increasing their positions by temporarily suspending the fundamental rules of the commodities markets.
Marco talks about one of the most common mistakes traders do: stopping following their strategy just at the worst time possible. He also gives you some insights on why that is, and why methods have drawdowns at all. With this understanding you can learn to better deal with drawdowns which are simply part of the trading business. If you have any questions, feel free to This email address is being protected from spambots. You need JavaScript enabled to view it., post it in our Blog or Forum.
( Stay tuned while Mayer Marco puts on the finishing touches to: AlgoStrats.com. )
Don't miss out! Sale ends this Sunday for Andy Jordan's Traders Notebook. Click Here for more details, and watch Andy's video that gives you a sneak peek to the Traders Notebook Campus.
To view previous published Chart Scan newsletters, please log in or click on "Join Us,"
shown above, to subscribe to our free "Members Only" section.
A WEALTH OF INFORMATION & EDUCATION:
Joe Ross-Trading Educators' popular free Chart Scan Newsletter has been published since 2004.
Note: Unless otherwise noted, all charts used in Chart Scan commentary were created
by using Genesis Financial Technologies' Trade Navigator (with permission).
Legal Notice and Copyright 2016 Disclaimer - Published by Trading Educators, Inc.
Chart Scan is a complimentary educational newsletter.
Andy Jordan's Traders Notebook has a very special offer just for you. Click Here for more details, and watch Andy's video that gives you a sneak peek to the Traders Notebook Campus.
We're announcing something new very soon, and we think that you'll be as excited about it as we are!
Stay tuned while Mayer Marco puts on the finishing touches to: AlgoStrats.com.
The Law of Charts with Commentary
by Master Trader Joe Ross
Author, Trader, Trading Mentor, and Founder of Trading Educators, Inc.
Trading Concept
One of the concepts we teach at Trading Educators is that at times, it is worth taking entry signals from the larger time frame chart and then, once in the trade, managing from a lesser time frame. For example: taking an entry signal from a 60-minute chart, then managing on a 30-minute chart once you get a fill. Or taking entry from a weekly chart, and managing on the daily chart. The reason for doing this is to enable you to micro-manage the trade.
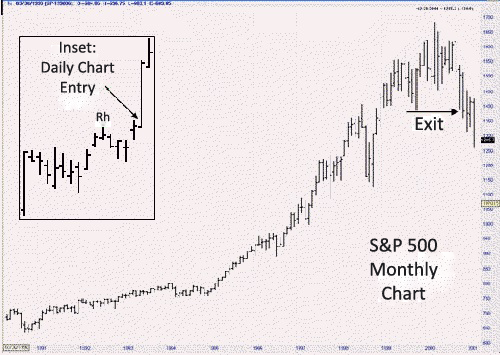
However, in the case of the greatest trade I have ever personally seen, the management was done in just the opposite manner. It was done by a long-term trader, and the trade lasted from 1991 to 2000.
The trader entered the S&P 500 in early December, 1991, and exited in 2000, by first entering from a daily chart, using a trailing stop for protection. When he felt he had accumulated sufficient profits, he began trailing his stop on the weekly chart, and then finally on the monthly chart, where he kept his stop two support levels (below two retracements) back. The trade ended up making $16 million.
Going from "micro" managing to "macro" managing is a perfectly logical way in which to stay longer in a trade. There was a Ross hook on the daily chart following a breakout from congestion. However, because of the gap opening on the bar prior to the one where I showed the entry, he chose to enter the following day. This is not exactly how I would have preferred to enter, but who am I to argue with $16 million?
by Master Trader Joe Ross
Author, Trader, Trading Mentor, and Founder of Trading Educators, Inc.
Do you ever dream about winning the lottery? There are actually people who have such good luck that they repeatedly enter contests and win. They win so often that if they wanted, they could count on winning, even though they are essentially trying to capitalize on chance. They develop a "lottery mindset" in that they approach life by counting on rare chance events. The rest of us aren't so lucky, and we don't live our lives counting on a fluke like winning the lottery. We work hard, master a profession, and work steadily to make a living. In many ways, top-notch traders approach their profession in the same diligent way. They don't view trading as recreational gambling, counting on a fluke to make a profit.
That said, many people do experience key life-changing events. We have all heard of people who needed a lucky break and got it. You often hear of actors who, with their last 50 bucks went for an audition, landed a job, and ended up as a star of a hit sit-com.
You probably know of friends who were desperately searching for a job for months, and needed a job fast! With only a week's worth of resources left, they found a job. It can also happen in sports. Olympic athletes may practice their entire life for "one moment in time" when they can perform at their best. But there is some luck involved. A family member may pass away, or they may become ill, and it may throw them off their game. Sure, they have rare talents, but the Gold Medal winners are also lucky enough to have everything go their way. There are times when life can come down to a few key moments. It's a little like playing Lotto, and hoping that you'll win.
Even though profitable traders don't approach trading as if they were playing the lottery, they almost all have at least one big winning trade in their careers. In a series of exclusive interviews, we asked traders to describe their biggest winning trades. Jesse described how he invested in Juno Online: "I bought about 3000 shares, and the stock went up 20 points in two days. It went up fast, and there was really no reason for it. I had a feeling it was just hype and euphoria, so I sold out and made $60,000." Andy described how he used to trade currencies: "One day I was trading Yen, and made around $18,000 in just that day." Don's biggest trade was in the heyday of the dot-com boom. "A European auction company was upgraded one morning. It was touted as the next eBay. CNBC was playing it up. The stock had just split, and they got the price target a little bit wrong. They quoted an ungodly high amount. This was merely a single digit stock. That morning it had traded up over 100. I shorted it as it fell.”
Do people make huge profits capitalizing on a once-in-a-lifetime trade? Sure they do, but the question you need to ask yourself is, "Do I want to trade hoping to make all my profits on a fluke?" Do you want to approach trading with a lottery mindset? If you do, you'll always be on edge, and you will have difficulty trading with discipline. You'll tend to take big chances, and you may end up losing big. It's better to trade more prudently. That doesn't mean never taking a risk or pushing yourself to invest a little more capital when you hit upon a winning streak. What it does mean, though, is controlling over-confidence. Don't seek out those one or two trades a year that will make up for all you've lost. There's an advantage to using a more methodical approach: continue to search for solid, high probability trade setups, outline detailed trading plans, and trade prudently with unwavering discipline.
In the first part of the Position Sizing series, Marco explains the basic indicators that are useful for position sizing. In Part II, Marco gives you a simple approach to determine your position size based on market volatility.
If you have any questions, feel free to This email address is being protected from spambots. You need JavaScript enabled to view it., post it in our Blog or Forum.
Andy Jordan's Traders Notebook has a very special offer just for you. Click Here or on the "SALE" sign below for more details, and watch Andy's video that gives you a sneak peek to the Traders Notebook Campus.
To view previous published Chart Scan newsletters, please log in or click on "Join Us,"
shown above, to subscribe to our free "Members Only" section.
A WEALTH OF INFORMATION & EDUCATION:
Joe Ross-Trading Educators' popular free Chart Scan Newsletter has been published since 2004.
Note: Unless otherwise noted, all charts used in Chart Scan commentary were created
by using Genesis Financial Technologies' Trade Navigator (with permission).
Legal Notice and Copyright 2016 Disclaimer - Published by Trading Educators, Inc.
Chart Scan is a complimentary educational newsletter.
Sometimes all you need is a good quote from Joe Ross: "A Trader who loves instruction loves knowledge, but a Trader who hates correction is stupid."
The Law of Charts with Commentary
by Master Trader Joe Ross
Author, Trader, Trading Mentor, and Founder of Trading Educators, Inc.
Long Term Trading
Some years ago I was tutoring a trader who would be trading a $1 billion managed money account, moving up from trading a $15 million account. He had been trading in a single market, but found that the amount of money being managed was simply too big for a single market, which he traded in his own country. The need to diversify brought him to the U.S. to learn about the U.S. markets.
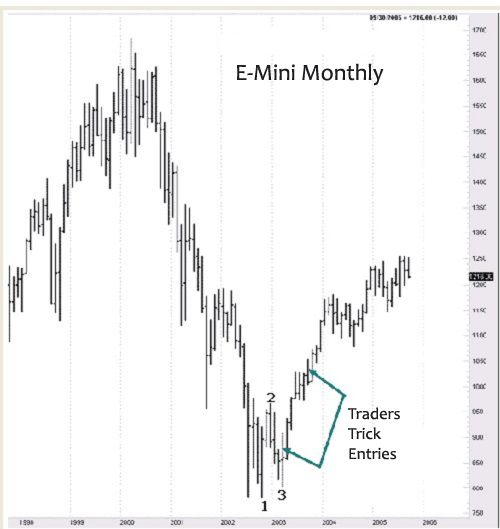
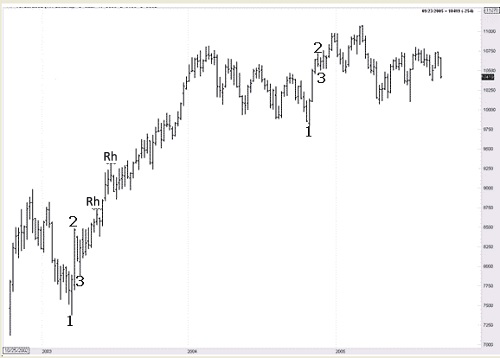
With a trading account of that size, he feels there is no way to engage in short-term day trading, and I agree. It's pretty hard to diversify when your entire focus is on a 5-minute E-mini chart. So this week, I want to show you something about the long-lost art of position trading long-term charts using monthly and weekly charts in markets with which most of you are already familiar - the E-mini S&P 500 and the Mini Dow.
It seems that these days few traders are interested in trading long-term. The monthly and weekly charts remain relatively unnoticed. Traders are so busy looking at anything and everything from 60 minutes down to 1 minute, that they let beautiful trades slip right by them in the very markets where they are trying so desperately to make a buck. Since monthly and weekly charts of the E-mini S&P and Mini DJ show only a few bars, I am going to have to use a continuous chart to show you what I mean. The prices may not be correct historically, but the relationship between bars will be exactly as they happened, so don't despair about the fact of continuity. Please keep in mind that the moves you will be seeing are huge on the monthly and weekly charts; and if they last for only a few bars, that is many times better than the moves you are getting on intraday charts.
The weekly chart of the Mini Dow below is loaded with Ross Hooks (Rh), too many for me to mark them all. Each one has a Traders Trick. Please examine these charts on your own, and remember the moves are big. A Ross hook is the first and subsequent failures of prices to continue in the direction they were moving after the breakout of a 1-2-3 formation, a ledge, or any form of consolidation. If you need more help, please study "The Law of Charts" which was a free EBook sent to you via email. If you need another copy, please This email address is being protected from spambots. You need JavaScript enabled to view it. to request it.
by Master Trader Joe Ross
Author, Trader, Trading Mentor, and Founder of Trading Educators, Inc.
Traders and investors have difficulty "letting their profits run." When you see your position increase in value, it's hard to avoid selling early to lock in profits. But not every trade goes your way, so when you come upon a trade that does produce a profit, it's vital for your long-term success to maximize the profits for that particular trade. You must make more profits on your winning trades than you lose on your losing trades, but this is difficult to do if you consistently sell prematurely. Waiting for your price objective takes self-control. You must fight the urge to sell early if it fits in with your testing and trading experience.
A thinking strategy that may help you increase your ability to maintain self-control when you need to consists of viewing trading decisions as "linked" in that the decisions you make on earlier trading choices influence the decisions you make on later trading choices.
How do you approach discipline when you trade? Do you think, "I'll sell early on this trade, but on future trades, I'll let my profits run. What's the harm?" It may set a bad precedent. What you do early on may influence what you do later: If you sell early on some trades, you may tend to sell early on other trades. The truth is that initial choices are good predictors of future choices. The choices you make deciding on a smaller reward upfront, or waiting for a larger reward later, are important. For example, a person might decide between one piece of pizza now and two pieces of pizza in a week. It's quite similar to taking a smaller profit early rather than patiently waiting to take a larger profit later. Nevertheless, you must make such decisions based on experience and testing. If you are more comfortable taking smaller profits at both ends of the trade, then doing so becomes your trading style. If that is how you trade profitably, then stick with it.
If you want to trade with discipline, it is essential that you maintain discipline at all times. Don't sell early, and think, "I'll hold on next time." The mind doesn't seem to work that way. You must show self-control early, and on all decisions. So when you are about to sell early, stop! Remind yourself that the long term consequence of taking profits prematurely is that it might set a bad precedent. You won't be able to show self-control and restraint when you really need to. And in the long run, it will severely cut into your overall profits.
In my new Q&A Episode, I'll answer questions about the usefulness of demo-trading, trading 123 formations, and why I developed my own python-based backtesting platform.. If you have any questions, feel free to This email address is being protected from spambots. You need JavaScript enabled to view it., post it in our Blog or Forum.
To view previous published Chart Scan newsletters, please log in or click on "Join Us,"
shown above, to subscribe to our free "Members Only" section.
A WEALTH OF INFORMATION & EDUCATION:
Joe Ross-Trading Educators' popular free Chart Scan Newsletter has been published since 2004.
Note: Unless otherwise noted, all charts used in Chart Scan commentary were created
by using Genesis Financial Technologies' Trade Navigator (with permission).
Legal Notice and Copyright 2016 Disclaimer - Published by Trading Educators, Inc.
Chart Scan is a complimentary educational newsletter.
"Teach our students the truth in trading - teach them how to trade,"
and
"Give them a way to earn while they learn - realizing that it takes time to develop a successful trader."
Derivative transactions, including futures, are complex and carry a high degree of risk. They are intended for sophisticated investors and are not suitable for everyone.
There are numerous other factors related to the markets in general or to the implementation of any specific trading program which cannot be
fully accounted for in the preparation of hypothetical performance results, and all of which can adversely affect actual trading results.
For more information, see the Risk Disclosure Statement for Futures and Options.