Trades in Stock Options. Receive daily trade recommendations. Can you imagine discovering a way to trade that promises instant income? If you think such a method is impossible, think again. It is definitely achievable, and everything you need to know is available online for one low price that includes special three-part online webinars.
Ambush is a time-proven mean-reversion day trading System focused on a variety of Futures markets around the globe. With Ambush Signals you can now easily follow the Ambush System on a subscription basis for educational purposes.
If you didn't fail early in your trading business, then you have probably been around long enough to realize that many of the problems you encounter as a trader are those that derive from your own individuality. Such problems are common among traders and, in fact, common among all human beings. Seeking spiritual help from a power much greater than your own is the area I address in the "Spiritual Side of Trading".
This is the final day before the Ambush Trading Method goes up in price. Grab a copy at the low current price while you still can!
The Law of Charts with Commentary
by Master Trader Joe Ross
Author, Trader, Trading Mentor, and Founder of Trading Educators, Inc.
TRADABLE MARKETS
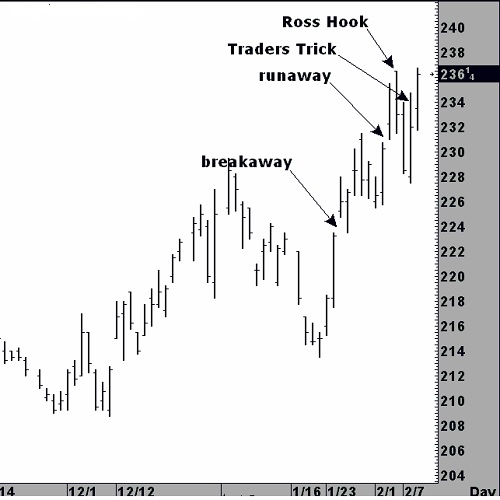
"Joe, would you analyze the attached futures for me?" So, here goes. This chart is easy to analyze using a combination of old-time, classical charting techniques, along with The Law of Charts and the Traders Trick Entry.
I've marked two gaps on the chart: a "breakaway gap" and a "runaway gap." The next gap up on the daily chart will bear the title "exhaustion gap," and should be the beginning of a correction or sideways area of distribution. Taking the Traders Trick Entry ahead of a breakout of the Ross hook is already showing a profit. 2 to 2.5 points should be taken so that you are paid to trade. Using that kind of management takes the pressure off the trade and off yourself as well. Then it is just a matter of where you now want to place your protection. Certainly you should not allow yourself to do any worse than breakeven on the remainder of your position. If I were trading a 10-lot in this situation, I would take 6 lots off at the point of the Ross hook, and move 4 lots to breakeven. However, that's me. You have to come up with your own management within your own financial, mental, and emotional level of comfort.
by Master Trader Joe Ross
Author, Trader, Trading Mentor, and Founder of Trading Educators, Inc.
Trading is a challenging business. Not only is it tough to repeatedly pick one winning trade after another, it is also hard to control our emotions. Our emotions often get the better of us. Our expectations tend to influence how we feel as we trade, and when we doubt our abilities, we may have difficulty maintaining a winning attitude. One good approach to staying optimistic as you battle with the markets is to build up psychological momentum: start off ahead of the game, and build on that success. However, many traders set themselves up for failure. They start off making trading errors, and dig themselves into an emotional hole from which they have trouble climbing out.
The expectations you have regarding a trade can dictate how you approach it. If you feel you are about to make a mistake, then you probably will make a trading error. You might have a perfectly good idea for a trade, for example, but you may feel so on edge that you have trouble taking advantage of it. It often starts out innocently enough. You have a good trading plan, but you make a few little errors. Perhaps you trade under less than ideal market conditions, or you set your stop too close to your exit point and get stopped out. Maybe you don't put up enough capital to make your trading plan work.
Whatever it is, you may make a few poor decisions, end up with a losing trade, and feel disappointed. Making one bad trade isn't a big deal, but what happens when you make another losing trade, and then another losing trade, and so on? At that point, you may feel that it is hard to get out of the minor slump you are in.
How can you set yourself up to win? First, realize that trading can be much like a self-fulfilling prophecy: you secretly believe that your trading plan won't produce a profit, and then you subtly self-sabotage your plan by feeling uptight, overly exacting, and constrained. It is vital to feel relaxed and carefree when you start out the trading day. Think optimistically.
Second, why not cheat a little? When you start the trading day, wait for an ideal trade, a trade you can afford to make which has a high probability of winning. If the first thing you do is make a profitable trade, even a small one, you'll feel good on your first trade, and then you can start building on your solid start.
When you set yourself up to win, you feel good, and this good feeling can help you trade more creatively. Instead of feeling uptight, you will trust your instincts and be more willing to risk capital. You won't make minor mistakes like risking too little capital, or placing your protective stop too tight and getting repeatedly stopped out. If you trade with wavering confidence, these minor errors can happen below your level of awareness, and at that point you may start mounting losses. Why set yourself up for a series of losers? Start off strong. Set yourself up for success, and build up the psychological momentum you need to trade with a winning mental edge.
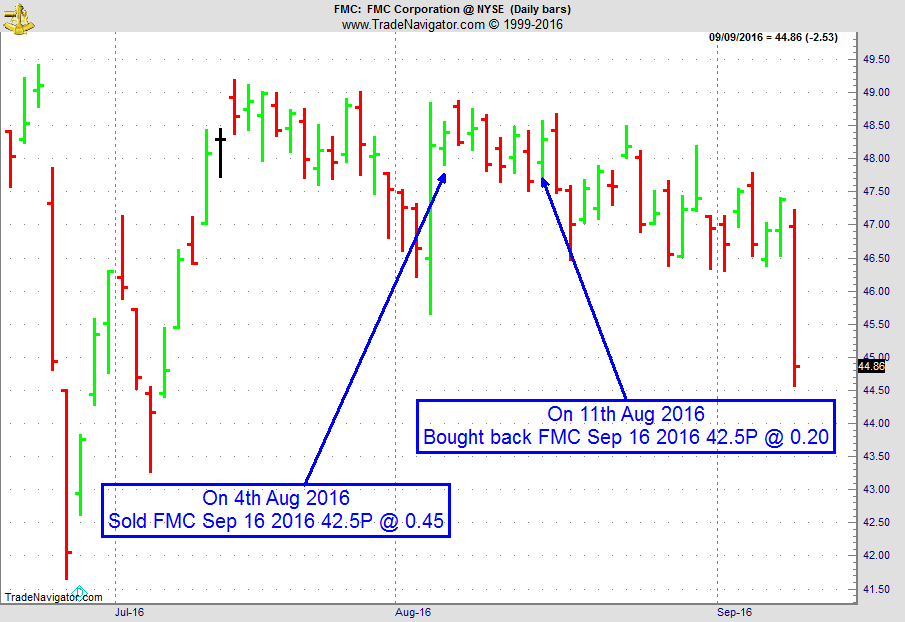
On 3rd August 2016, we gave our IIG subscribers the following trade on FMC, right after a strong move up on earnings. With strong support around $44, we decided to sell price insurance as follows the following day:
On 4th August 2016, we sold FMC September 16 2016 42.5P @ $0.45, i.e. $45 per option sold, with 42 days to expiration.
On 11th August 2016, we bought back FMC September 16 2016 42.5P @ $0.20, after 8 days in the trade, for quick premium compounding.
Profit: $25
Margin: $850
Return on Margin Annualized: 134.19%
We have also added new types of trades for our IIG daily guidance, "no loss" propositions with unlimited upside potential, still using other people's money to trade.
This includes a daily 80+ page report along with a daily podcast!
We review and supply the following:
our daily fills (entries, exits)
full real-time statistics of our weekly trades, closed trades for the current month, monthly statistics (detail and summary) since the beginning of IIG
daily market commentary (indices/sectors, volatility indices, main commodities related to our trade)
new trades for the following day
comments on our open trades, with all relevant news
updated earnings dates for our open positions
full details (days in trade, days to expiration, underlying close and price change, etc.) on our open trades (classic trades, complex positions, remaining rolled trades and covered calls)
active good till cancelled orders
dividends for the stocks owned
We also supply quite a number of extra "slides" in the appendix which are quite useful for new subscribers: recommendations, answers and explanations on the most frequent questions, techniques for entering trades, historical trades and real life examples, broker information, etc.
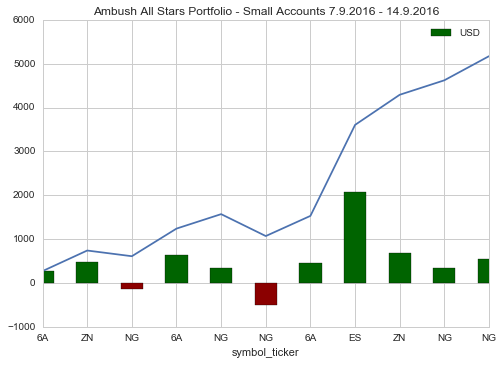
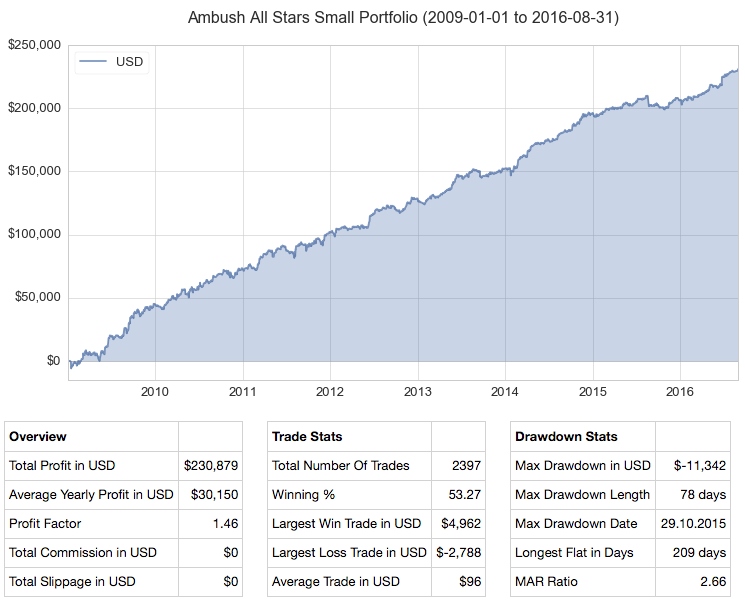
Here's an important update with Ambush Trading Method using the All-Stars Portfolio for small accounts E-Mini S&P 500 (ES), Australian Dollar (6A), Natural Gas (NG), 10 Year US T-Note (ZN)) trading one contract per market, except ZN where we use two contracts. For more information regarding the portfolio and long-term performance, see the Ambush Performance Page.
Last week was a difficult one for many traders, and as Ambush just made new equity highs at the end of August, how did it continue to perform? Here's the answer, play by play, Ambush had another crazy week making almost $5,000 performance in the small portfolio, making new all time equity highs across the board again:
As you can see Ambush killed it again in the markets, in the E-Mini S&P 500 alone there was one trade with a profit of about $2,000. That's also the answer to the question why we're raising the price of Ambush. The old price simply is in no relation to the crazy performance Ambush delivers anymore. This week alone, buying Ambush at the old price, it generated more than 5 times the profits of its costs trading the small Ambush All-Stars portfolio!
So don't miss your chance to get Ambush still at a bargain. Odds are price will increase further in the future and you will never be able to get on board at such a low price again.
The price of Ambush will rise significantly on September 17th, this is your chance to get it at a bargain price!
I am having a great vacation traveling in South Germany to enjoy the last days of the summer and to visit family and friends. We started in Munich for a weekend, then to Heidelberg, and are now enjoying the last week in Black Forest hiking and mountain biking! Fortunately, we had two weeks of nothing but sunshine! Here's a few of my favorite pictures while on vacation.
Learn all you need to know about AlgoStrats:FX during this presentation by Marco Mayer. What is it, what's the idea behind it, why it is different from other services and how you'd profit from AlgoStrats:FX as a subscriber!
Feel free to email questions to This email address is being protected from spambots. You need JavaScript enabled to view it., or post it in our Blog or Forum. Follow me on Facebook and Twitter!
To view previous published Chart Scan newsletters, please log in or click on "Join Us,"
shown above, to subscribe to our free "Members Only" section.
A WEALTH OF INFORMATION & EDUCATION:
Joe Ross-Trading Educators' popular free Chart Scan Newsletter has been published since 2004.
Note: Unless otherwise noted, all charts used in Chart Scan commentary were created
by using Genesis Financial Technologies' Trade Navigator (with permission).
Legal Notice and Copyright 2016 Disclaimer - Published by Trading Educators, Inc.
Chart Scan is a complimentary educational newsletter.
"Wisdom is found on the lips of a Trader who has understanding, but a rod is for the back of a Trader who is devoid of understanding." Master Trader Joe Ross
The Law of Charts with Commentary
by Master Trader Joe Ross
Author, Trader, Trading Mentor, and Founder of Trading Educators, Inc.
MARKET CONDITIONS
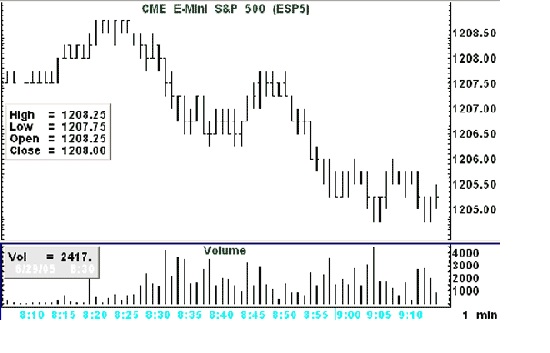
Quite often I am asked about what condition a market has to be in to be tradable. Sometimes it is easier to show with a picture when a market is not tradable other than to be a very short-term scalper.
When prices have a "boxy look to them, the market becomes very difficult to trade. What causes a boxy look? If you look closely at the chart, I will attempt to explain.
Notice the following:
Volume at 8:30, the opening minute is only 2,417. 3 minutes later the per minute volume is 4,193, an acceptable amount it would seem. But is it? Volume does not take into consideration liquidity. Liquidity consists of both decent volume and good participation, meaning buyers are hitting the offer and sellers are hitting the bid. The volume of 4,193 might have involved as few as two traders.
Prices tend to make multiple exact highs and lows, giving the chart a boxy look.
Opens and Closes tend to cluster at the same level.
Prices do not look much different from the way they looked in the early morning Globex trading.
If we go to a 5-minute chart things do not look a whole lot better.
Volume in the first 5 minutes of trading was 11,580, which amounts to an average of only 2,316 contract/minute. Not a very healthy volume for doing much of anything. The 5 minute chart displays the same type of problems we saw on the 1 minute chart. Double highs and lows, and clusters of Opens and Closes. The "boxiness" of the 5 minute chart is a sign of lack of liquidity. All this means that traders are not trading. The action that is going on is limited to a few traders who are literally picking each others´ pockets.
The e-mini S&P 500 has often been as you see it on the charts above. The situation goes back on and off for at least 10 years. Is it any wonder that 90% or more of newbies are getting their heads handed to them in this market? Unless you go out to the larger time frames you are facing a very difficult situation.
by Master Trader Joe Ross
Author, Trader, Trading Mentor, and Founder of Trading Educators, Inc.
Winning traders are eternal optimists. They must be to survive. Markets are constantly changing. What works in one market doesn't necessarily work in another. You can't complacently expect to perfect a trading strategy or method at a particular point in time and expect it to work forever. But many traders hold these unrealistic expectations. It's common to hear even a seasoned trader complain, "It's all a sham. There's no way to make money in trading anymore. The amateurs have left and there's no way to take profits from professionals." It can shake your confidence to hear such a bleak outlook. It can make you feel as if you might as well just throw in the towel and put your money in a mutual fund. But if you want to master the markets and take home huge profits, you can't let pessimists sway you. Don't catch their bad mood. Stay optimistic, sharpen your skills, and remain ahead of the crowd.
Seasoned traders have seen markets change over and over. They'll warn you that to stay profitable, it's necessary to continually search for new ways to trade profitably. This fact of trading can provide comfort when you hear your friends complain about how "it's all changed" and there's no longer a viable way to make a profit.
Sure, it's not going to be easy, but it's always possible. Acknowledging that trading is hard can actually soothe you. If you know that it's not your fault that market conditions change, then there's no reason to feel pessimistic and beat yourself up. It's not your fault. You didn't do anything wrong. Change is merely the nature of the beast. Your job is to avoid giving into pessimism. Instead, you must continually pick yourself up after being thrown down and courageously face market challenges with a fighting spirit.
An optimistic attitude alone isn't going to guarantee success, but it's an essential prerequisite for continuing to stay profitable. To stay on top, you're going to have to think creatively and you might have to change the way you've been doing things. Maybe you can't make as much profit as you were used to making on merely a few trades. Perhaps, you have to make more trades or just expect less per trade. Maybe you have to move into new sectors or into trading commodities or bonds. Again, it's not going to be simple, but with effort and practice, you can learn to adapt your trading style to new circumstances, instead of catching the pessimism that is rampant when the majority of traders are losing.
So when you hear a novice or old-timer complain, "it's impossible to make a profit," don't let it shake your resolve. Don't catch a bad mood. Everyone is different. You're different from other traders. You have your own resources and your own style. Maybe your friend with a bad attitude is right. Maybe he or she can't trade the markets anymore. Maybe his or her account is too big or too small. Whatever the issue is, don't make it your problem. Just go your own merry way and keep searching for a new set of tools that will make you profitable. They are out there. All you have to do is persistently search until you find them.
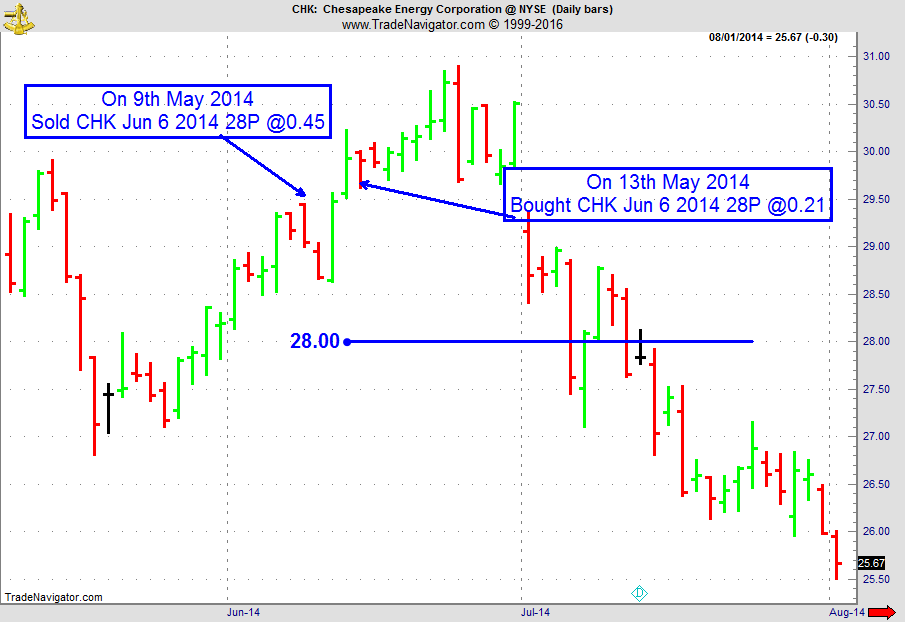
On 8th May 2014, we gave our IIG subscribers the following trade on CHK, which was in an established uptrend. We decided to sell price insurance as follows the following day:
On 9th May 2014, we sold CHK June 06 2014 28P @ $0.45, i.e. $45 per option sold; the short strike was slightly below price action (4% away) but below the last support level, with only 27 days to expiration.
On 13th May 2014, we bought back CHK June 06 2014 28P @ $0.21, after 4 days in the trade.
Profit: $24
Margin: $560
Return on Margin Annualized: 391.07%
We have also added new types of trades for our IIG daily guidance, "no loss" propositions with unlimited upside potential, still using other people's money to trade.
This includes a daily 80+ page report along with a daily podcast!
We review and supply the following:
our daily fills (entries, exits)
full real-time statistics of our weekly trades, closed trades for the current month, monthly statistics (detail and summary) since the beginning of IIG
daily market commentary (indices/sectors, volatility indices, main commodities related to our trade)
new trades for the following day
comments on our open trades, with all relevant news
updated earnings dates for our open positions
full details (days in trade, days to expiration, underlying close and price change, etc.) on our open trades (classic trades, complex positions, remaining rolled trades and covered calls)
active good till cancelled orders
dividends for the stocks owned
We also supply quite a number of extra "slides" in the appendix which are quite useful for new subscribers: recommendations, answers and explanations on the most frequent questions, techniques for entering trades, historical trades and real life examples, broker information, etc.
The price of Ambush Trading Method will increase to $1,299 on September 17, 2016.
Use coupon code "ambush10" to get an additional 10% off the current price.
Coupon is valid only through September 16, 2016 on the current price. No exceptions.
Coupon is valid for the Ambush only. It is not valid for the Ambush/Stealth combo.
Grab a copy at the current price while you still can!
As Ambush continues this years gold rush across many markets, we did another update of our Futures Performance Page.
Additionally to up-to-date reports for each single market, there's three sample baskets of portfolios showing you the power of diversification trading Ambush in multiple markets!
Here's one of them for small account ($25k+) trading ES, 6A, NG and ZN:
The price of Ambush will rise significantly on September 17th, this is your chance to get it at a bargain price!
Learn all you need to know about AlgoStrats:FX during this presentation by Marco Mayer. What is it, what's the idea behind it, why it is different from other services and how you'd profit from AlgoStrats:FX as a subscriber!
Feel free to email questions to This email address is being protected from spambots. You need JavaScript enabled to view it., or post it in our Blog or Forum. Follow me on Facebook and Twitter!
To view previous published Chart Scan newsletters, please log in or click on "Join Us,"
shown above, to subscribe to our free "Members Only" section.
A WEALTH OF INFORMATION & EDUCATION:
Joe Ross-Trading Educators' popular free Chart Scan Newsletter has been published since 2004.
Note: Unless otherwise noted, all charts used in Chart Scan commentary were created
by using Genesis Financial Technologies' Trade Navigator (with permission).
Legal Notice and Copyright 2016 Disclaimer - Published by Trading Educators, Inc.
Chart Scan is a complimentary educational newsletter.
Grab a copy at the current price while you still can. The price of Ambush Trading Method will increase to $1,299 of September 17, 2016. Use coupon code "ambush10" to get an additional 10% off the current price. Coupon is valid only through September 16, 2016 on the current price. No exceptions. Coupon is valid for the Ambush only. It is not valid for the Ambush/Stealth combo.
The Law of Charts with Commentary
by Master Trader Joe Ross
Author, Trader, Trading Mentor, and Founder of Trading Educators, Inc.
CCI
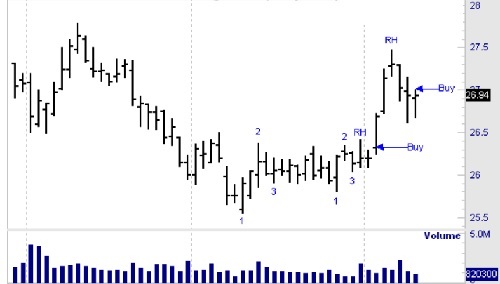
The lesson we want to gain from the chart below is how to anticipate the direction of a breakout from an area of consolidation – in this case a rather sloppy-looking congestion.
Notice that shortly after prices began to move sideways, at the end of the trend there was a 1-2-3 formation. However prices failed to violate the #2 point. Instead they moved into a tight consolidation containing too many price bars to be considered a ledge (10 bars limit). Within the congested area, a second 1-2-3 formed. This was followed by a Ross hook (Rh).
In anticipation of a breakout to the upside, a buy stop could have been placed as shown. The second 1-2-3 formation defined a trend. The Rh established the trend. A few days later, a second Ross hook formed. The last "buy" involves an ideal Traders Trick Entry, the kind we show people in our recorded Traders Trick webinar. Over the years there have been several refinements to the Traders Trick. In the recorded webinar, we show you how to receive a very high percentage of wins using the Traders Trick with the various refinements.
by Master Trader Joe Ross
Author, Trader, Trading Mentor, and Founder of Trading Educators, Inc.
It didn’t in the past because volume figures, when trading the daily charts, were a day late and a dollar short. But these days, where volume is live, it does count.
At Trading Educators we use both contract volume and tick volume as a guideline and filter for our trading.
Here’s a simple idea that works well for indexes. Most people ignore volume as an indicator. I think it’s overlooked and I will show you here how to use it to figure out possible turns in the market. The concept is that of a volume spike. If you will look at just about any weekly chart of the E-mini S&P 500, you will see what I'm talking about. Note the volume spikes that occur at the turning points in the market. This occurs when large numbers of contracts change hands. Usually it happens when the smaller trader gives up and sells his contracts. If enough traders do this at once and the price is right the professionals will come in and snatch up those contracts.
Therefore you have a large volume that occurs right at the bottom of a decline as the market is churning. The contracts move from the weak hands (the man on the street) to the strong hands (professionals).You need to look for volume that is larger than the last 10 bars´ volume. This is not cast in stone but is generally a good average to go by. You might decide that 8 bars are enough, it´s up to you. It also helps if the volume is substantially larger than the previous volume and is accompanied by a large downward move in price. I wouldn’t necessarily trade this as a standalone indicator but use it as a general warning of a possible change in Market direction. Does this work with intraday charts?
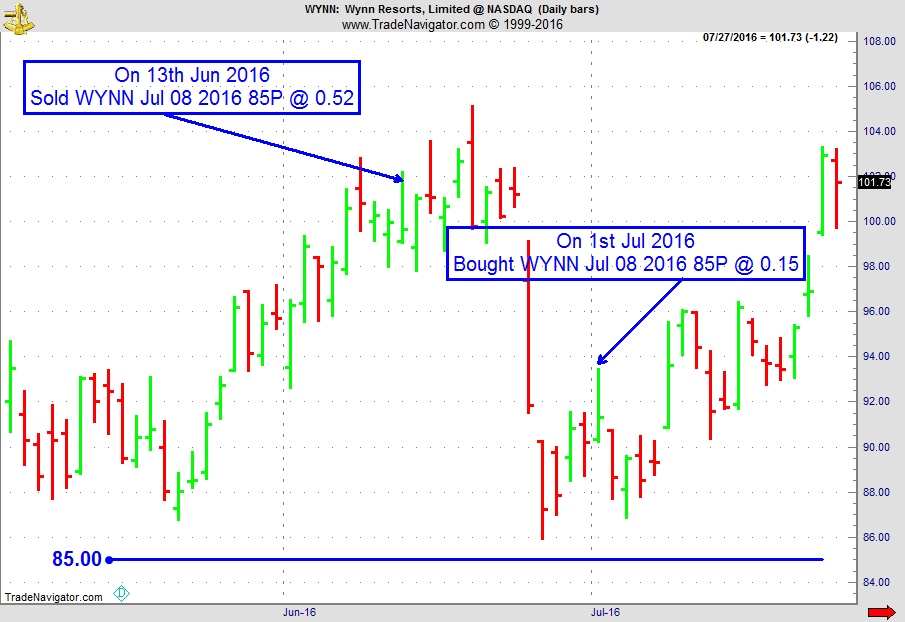
On 12th June 2016, we gave our IIG subscribers the following trade on WYNN, which was in an established uptrend, and was still under accumulation. We decided to sell price insurance as follows the following day:
On 13th June 2016, we sold WYNN July 08 2016 85P @ $0.52, i.e. $52 per option sold; the short strike was well below price action (15% away) and below a major support level, so that the trade was safe, with only 25 days to expiration.
On 1st July 2016, we bought back WYNN July 08 2016 85P @ $0.15, after 18 days in the trade; we easily "survived" the strong down move which happened 9 trading days after our entry, thanks to quick the time decay and our safely placed short strike.
Profit: $37
Margin: $1,700
Return on Margin Annualized: 44.13%
We have also added new types of trades for our IIG daily guidance, "no loss" propositions with unlimited upside potential, still using other people's money to trade.
This includes a daily 80+ page report along with a daily podcast!
We review and supply the following:
our daily fills (entries, exits)
full real-time statistics of our weekly trades, closed trades for the current month, monthly statistics (detail and summary) since the beginning of IIG
daily market commentary (indices/sectors, volatility indices, main commodities related to our trade)
new trades for the following day
comments on our open trades, with all relevant news
updated earnings dates for our open positions
full details (days in trade, days to expiration, underlying close and price change, etc.) on our open trades (classic trades, complex positions, remaining rolled trades and covered calls)
active good till cancelled orders
dividends for the stocks owned
We also supply quite a number of extra "slides" in the appendix which are quite useful for new subscribers: recommendations, answers and explanations on the most frequent questions, techniques for entering trades, historical trades and real life examples, broker information, etc.
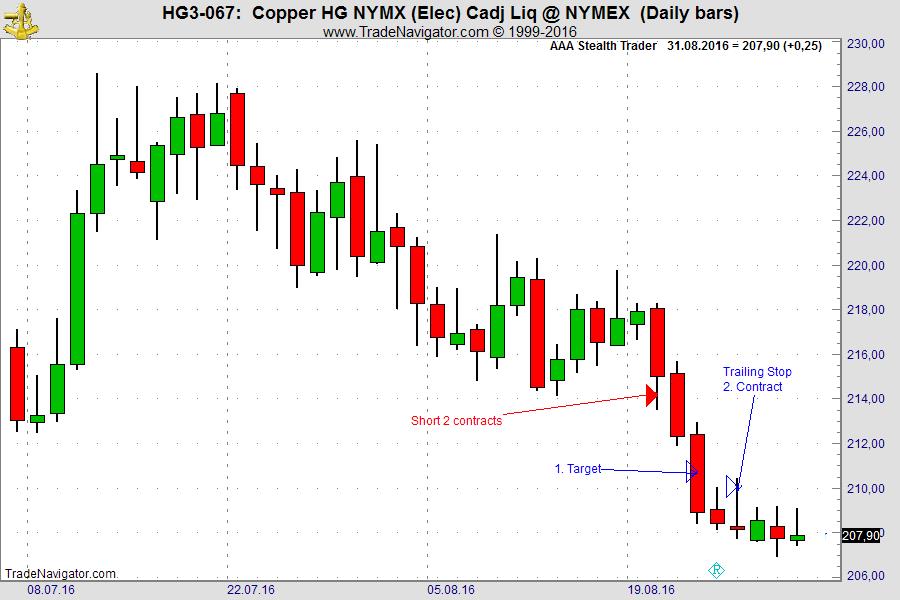
On August 22nd our method “Stealth Trader” generated an entry signal for the next trading day. We got short with 2 contracts: September Copper (first red arrow), and we reached our first target on the third day (first blue arrow). We trailed the stop for the second lot at the high of each daily bar, and got stopped out on August 26th with a nice profit (second blue arrow).
With an initial risk of approx. $840 per contract, the method generated a profit of $1,843 (trading two contracts).
If you make mistakes during trading, go back in your mind to see what you could have done better, or differently. There is usually something to learn from each...read more.
Should you take your laptop to the beach to trade, or just close out all positions and forget about the markets for two weeks? Marco is just leaving for vacation, he'll let you know how he handles this as a systematic trader. Read more to find out!
Learn all you need to know about AlgoStrats:FX during this presentation by Marco Mayer. What is it, what's the idea behind it, why it is different from other services and how you'd profit from AlgoStrats:FX as a subscriber!
Feel free to email questions to This email address is being protected from spambots. You need JavaScript enabled to view it., or post it in our Blog or Forum. Follow me on Facebook and Twitter!
To view previous published Chart Scan newsletters, please log in or click on "Join Us,"
shown above, to subscribe to our free "Members Only" section.
A WEALTH OF INFORMATION & EDUCATION:
Joe Ross-Trading Educators' popular free Chart Scan Newsletter has been published since 2004.
Note: Unless otherwise noted, all charts used in Chart Scan commentary were created
by using Genesis Financial Technologies' Trade Navigator (with permission).
Legal Notice and Copyright 2016 Disclaimer - Published by Trading Educators, Inc.
Chart Scan is a complimentary educational newsletter.
Time, after time, after time we hear from traders who are ready to throw in the towel, call it quits, or hang up their trading hat. There's a common misconception that trading is easy, a fast way to earn money (a fast way to lose money too), or a program that has unbelievable returns. It takes years for your trading skills to reach a consistent level of gains. You should consider investing in yourself before walking away. Our traders have years of experience and have been through the good, the bad, and the ugly. Be smart and use the best resources which are right in front of you, our traders are here to help. It could be a simple tweak, major overhaul, or needing to trade in a different market. Whatever it may be, we are here to help. Invest in yourself!
The Law of Charts with Commentary
by Master Trader Joe Ross
Author, Trader, Trading Mentor, and Founder of Trading Educators, Inc.
1-2-3
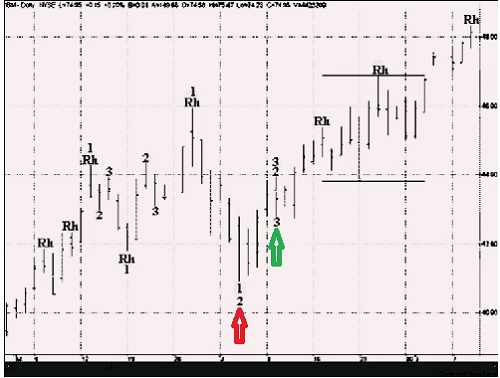
Quite often I am asked to give an example of a #2 and a #1 point occurring on the same bar. While it doesn’t happen often, it does happen. My friend and superb trader, Marshall Sass, sent me this one. Here’s what he said:
“Here's an interesting situation on a chart. In 10 years of IBM daily data, it came up once. The bar of interest is pointed to by the black arrow. A 123 low and a 123 high both get their full correction by this same bar. This bar is 2 bars after the 3 point for both cases.”
If you look carefully, you will see a 1-2 on the same bar as well as a 2-3 on the same bar.
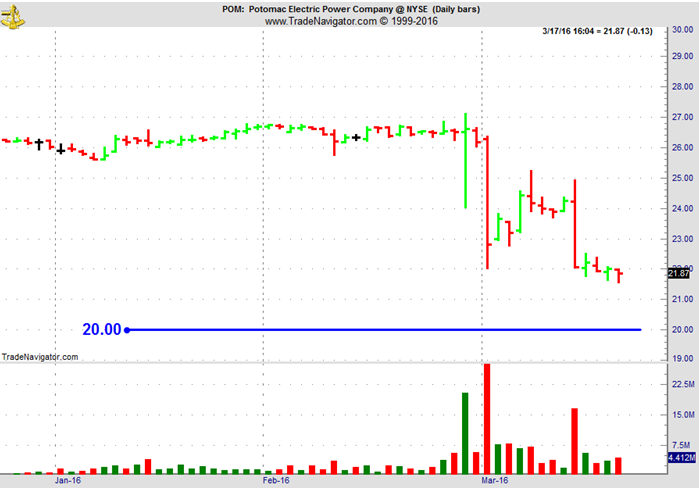
On 17th March 2016, we gave our IIG subscribers the following trade on POM, a natural gas and electricity company which had been in a take over deal with EXC (Excelon) for nearly 2 years at $27.25 per share. We advised to take only a position we would be comfortable being assigned:
On 18th March 2016, we sold POM April 15 2016 20P @ $0.50, ie. $50 per option sold, with 27 days to expiration.
On 23rd March 2016, we bought back POM April 15, 2016 20P @ $0.20, after 5 days in the trade, for quick premium compounding, as D.C. regulators approved Exelon-Pepco deal and the stock shot up 27.7% on the news.
Profit: $30
Margin: $400
Return on Margin Annualized: 547.50%
We have also added new types of trades for our IIG daily guidance, "no loss" propositions with unlimited upside potential, still using other people's money to trade.
This includes a daily 80+ page report along with a daily podcast!
We review and supply the following:
our daily fills (entries, exits)
full real-time statistics of our weekly trades, closed trades for the current month, monthly statistics (detail and summary) since the beginning of IIG
daily market commentary (indices/sectors, volatility indices, main commodities related to our trade)
new trades for the following day
comments on our open trades, with all relevant news
updated earnings dates for our open positions
full details (days in trade, days to expiration, underlying close and price change, etc.) on our open trades (classic trades, complex positions, remaining rolled trades and covered calls)
active good till cancelled orders
dividends for the stocks owned
We also supply quite a number of extra "slides" in the appendix which are quite useful for new subscribers: recommendations, answers and explanations on the most frequent questions, techniques for entering trades, historical trades and real life examples, broker information, etc.
The world's most successful traders believe in themselves and their ability to win. In fact, many of them feel that they “own” the market. They are not necessarily being...read more.
I’d like to give you an update on what happened trading AlgoStrats:FX during this week.
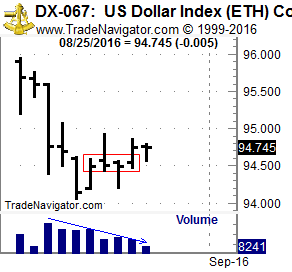
Or what didn't happen as we hardly got any signals this week. Sort of funny considering I wrote an article about why trading actually is quite boring. This week was especially true in the FX markets and, looking at some charts, this isn’t very surprising. On the daily chart of the US Dollar Index, we can see a really tight consolidation going on for days, with most days closing almost unchanged. Until Wednesday, literally nothing had happened, and most other currency markets looked pretty much the same:
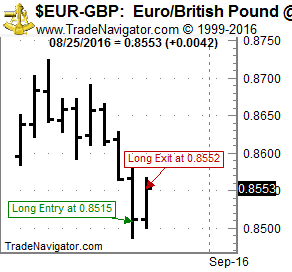
Because of this, we got no signals for three days in a row which doesn’t happen too often. Finally, on Wednesday the markets, especially the EUR and GBP pairs, moved and we got into 4 trades which we could all close with profits on Thursday. One of these trades happened in EUR/GBP (see chart). Yesterday, again no signals, so we finish this dull week with a profit of about 0.5% on the live trading account which isn’t too bad!
Learn all you need to know about AlgoStrats:FX during this presentation by Marco Mayer. What is it, what's the idea behind it, why it is different from other services and how you'd profit from AlgoStrats:FX as a subscriber!
Feel free to email questions to This email address is being protected from spambots. You need JavaScript enabled to view it., or post it in our Blog or Forum. Follow me on Facebook and Twitter!
In his latest blog post "(Good) Trading happens outside of your comfort zone," Marco challenges another misconception about trading. Does trading have to feel good, should you always do what feels comfortable? Or do the best trades actually happen outside of your comfort zone? Read more to find out!
To view previous published Chart Scan newsletters, please log in or click on "Join Us,"
shown above, to subscribe to our free "Members Only" section.
A WEALTH OF INFORMATION & EDUCATION:
Joe Ross-Trading Educators' popular free Chart Scan Newsletter has been published since 2004.
Note: Unless otherwise noted, all charts used in Chart Scan commentary were created
by using Genesis Financial Technologies' Trade Navigator (with permission).
Legal Notice and Copyright 2016 Disclaimer - Published by Trading Educators, Inc.
Chart Scan is a complimentary educational newsletter.
We were recently asked just what are commodities? This is how we replied. Enjoy!
The Law of Charts with Commentary
by Master Trader Joe Ross
Author, Trader, Trading Mentor, and Founder of Trading Educators, Inc.
Exchange Traded Fund also known as "ETFs" or IShares
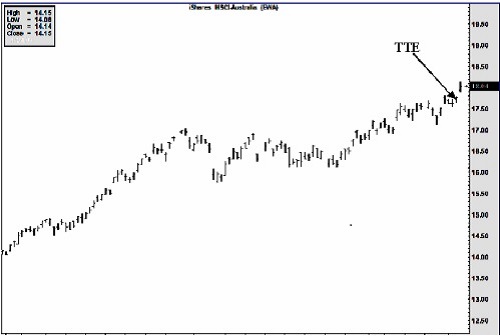
This was written awhile ago, but a good one to share with you. The Australian dollar had been rising against the U.S. dollar. I had been in the Aussie dollar for at least 3 years. In addition to dollar deposits using Australian interest bearing notes I had begun trading IShares. IShares are an index of some of the top companies in Australia. It is through ETFs that a trader can trade in another nation and still have the convenience of trading in the U.S. using U.S. dollars. Australian companies had been doing quite well supplying China with foodstuffs and raw materials. But in addition to the fat profits these companies were making, their stocks were rising because of the gain at the time of the Aussie Dollar against the U.S. currency. Trading or investing this way is a great way to hedge against a falling U.S. dollar.
One day, EWA offered up a Traders Trick for entry on March 3rd at a price of 17.74, 1 tick above the high of March 2nd. Entry was possible at that price and the shares Closed on March 4th at 18.04 for a gain of 30 cents, or $300 on 1,000 shares.
by Master Trader Joe Ross
Author, Trader, Trading Mentor, and Founder of Trading Educators, Inc.
I received the following question: "When you were teaching us at our forex office in Florida, you stressed discipline. Our head trader stresses discipline. What I want to know is if discipline can be acquired or is it just something you are born with? I’m having trouble finding it in myself."
Personally, I believe discipline can be learned, although at times it is very painful. When I began trading, I was an undisciplined person. But trading and the markets forced me to become disciplined. Was the discipline already there and just needed to be extracted? Or did I actually learn it? I can’t really be sure. I was a delinquent as a boy. I was in rebellion against all authority. I hated teachers and I hated school. I was really struggling with life as a young man.
One of the largest private trading firms, 1,500 S&P day traders, kept their offices near yeshivas. A yeshiva is a rabbinical school, which produces rabbis of the Jewish religion. The students coming out of the yeshiva were highly disciplined and made excellent traders. Was the discipline innate in those yeshiva students? Or did they learn it under the strict supervision of the rabbis who controlled their lives? I think they learned it.
I’ve mentioned previously that it can help to keep a journal if you want to learn discipline. The journal I kept was very basic and included what trades I made during the day and my reasons for getting into the trade. It is what I did with the journal that helped me to be disciplined. Anyone can make entries into a journal. I let the contents of my journal keep me in line. It became my supervisor. I took to heart what I wrote there. I no longer keep that kind of journal because it has served its purpose in making discipline into a habit in the way I trade.
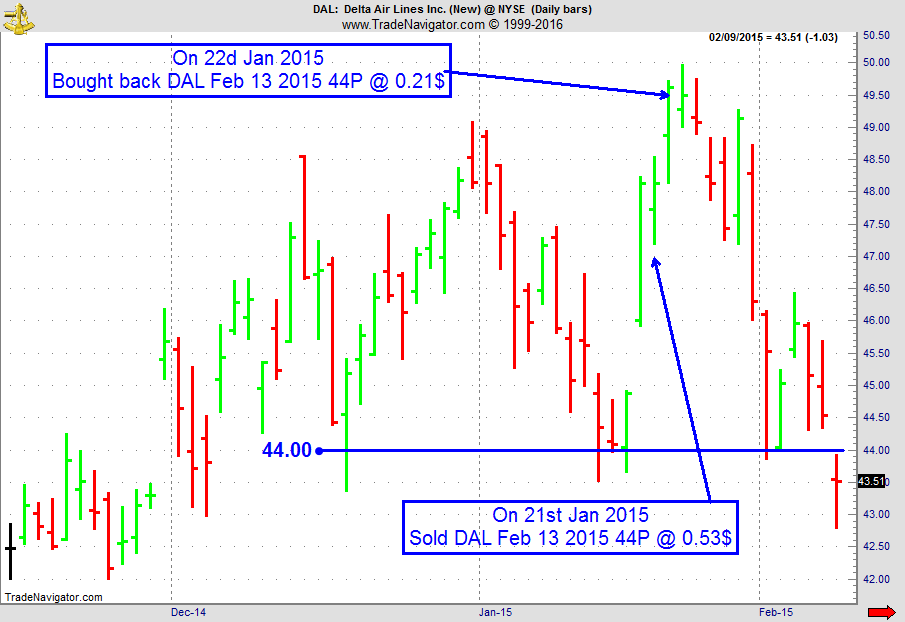
On 20th January 2015, we gave our IIG subscribers the following trade on DAL, which was moving strongly to the upside. As there was short term support around $44, we decided to sell price insurance as follows the following day:
On 21st January 2015, we sold DAL February 13, 2015 44P @ $0.53, ie. $53 per option sold; with 22 days to expiration.
On 22nd January 2015, we bought back DAL February, 13 2015 44P @ $0.27, after 1 day in the trade, for quick premium compounding.
Profit: $26
Margin: $880
Return on Margin Annualized: 1,099.15%
We have also added new types of trades for our IIG daily guidance, "no loss" propositions with unlimited upside potential, still using other people's money to trade.
When you start out trading, it’s pretty much all about the excitement. You watch every trade tick by tick, gazing at a chart ticking up and down together your P&L. You’re long. When it goes up, you feel excited because...read more.
Learn all you need to know about AlgoStrats:FX during this presentation by Marco Mayer. What is it, what's the idea behind it, why it is different from other services and how you'd profit from AlgoStrats:FX as a subscriber!
Feel free to email questions to This email address is being protected from spambots. You need JavaScript enabled to view it., or post it in our Blog or Forum. Follow me on Facebook and Twitter!
To view previous published Chart Scan newsletters, please log in or click on "Join Us,"
shown above, to subscribe to our free "Members Only" section.
A WEALTH OF INFORMATION & EDUCATION:
Joe Ross-Trading Educators' popular free Chart Scan Newsletter has been published since 2004.
Note: Unless otherwise noted, all charts used in Chart Scan commentary were created
by using Genesis Financial Technologies' Trade Navigator (with permission).
Legal Notice and Copyright 2016 Disclaimer - Published by Trading Educators, Inc.
Chart Scan is a complimentary educational newsletter.
"Teach our students the truth in trading - teach them how to trade,"
and
"Give them a way to earn while they learn - realizing that it takes time to develop a successful trader."
Derivative transactions, including futures, are complex and carry a high degree of risk. They are intended for sophisticated investors and are not suitable for everyone.
There are numerous other factors related to the markets in general or to the implementation of any specific trading program which cannot be
fully accounted for in the preparation of hypothetical performance results, and all of which can adversely affect actual trading results.
For more information, see the Risk Disclosure Statement for Futures and Options.