Trades in Stock Options. Receive daily trade recommendations. Can you imagine discovering a way to trade that promises instant income? If you think such a method is impossible, think again. It is definitely achievable, and everything you need to know is available online for one low price that includes special three-part online webinars.
Ambush is a time-proven mean-reversion day trading System focused on a variety of Futures markets around the globe. With Ambush Signals you can now easily follow the Ambush System on a subscription basis for educational purposes.
If you didn't fail early in your trading business, then you have probably been around long enough to realize that many of the problems you encounter as a trader are those that derive from your own individuality. Such problems are common among traders and, in fact, common among all human beings. Seeking spiritual help from a power much greater than your own is the area I address in the "Spiritual Side of Trading".
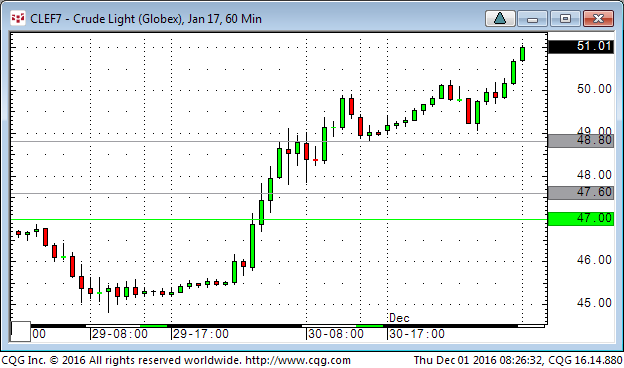
I want to present an outright futures trade we had this week in Traders Notebook Outrights. We went long the Crude Oil at 47.00 on 11/30 with a risk of $600 per contract on the “normal” futures contract (the risk per contract on the E-mini CL was only $300). We reached our first target at 47.60 an hour later (first gray horizontal line) and the second target at 48.80 on the same day (second gray horizontal line). We are still holding the last lot using a trailing stop with a possible target at 51.80.
If you are interested in this kind of swing trades, our newsletter service Traders Notebook Outrights is the right choice for you. If you have any questions, please do not hesitate to contact me at This email address is being protected from spambots. You need JavaScript enabled to view it..
by Master Trader Joe Ross
Author, Trader, Trading Mentor, and Founder of Trading Educators, Inc.
Time Independent Charts
If you want to trade a chart that is time-independent, you have two choices:
Point and figure charts
Tick charts
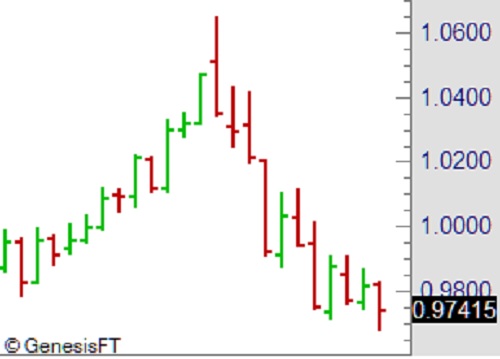
To create a tick chart you need software that will enable you to do so. I use Genesis Trade Navigator. Instead of each bar on the chart representing a specific amount of time, each bar represents a specific number of ticks. Tick charts change the entire structure of the prices you are looking at. The magnitude of the moves changes markedly, as well as having trends appear where there is no trend with charts based on time. The time between bars also varies. At a setting of 500 ticks per price bar, you might find an hour or more between bars, or a matter of minutes between bars, depending upon the liquidity of the market you are trading.
One of the nicest things about tick charts is that you can literally create them to match your own style of trading. Your chart for each market can be unique to you and you alone. The number and variety of tick charts is virtually unlimited. Someone trading a bar chart in which each bar contains 257 ticks is going to see a different chart from the person trading a bar chart in which each bar contains 250 ticks.
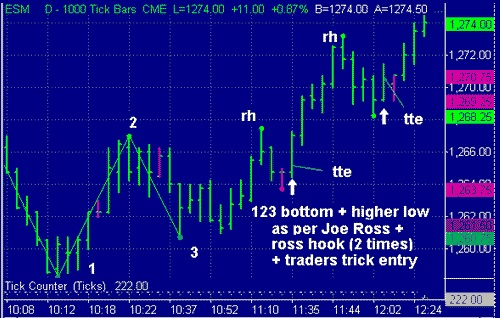
The chart below was sent in to me by one of our subscribers. It is a chart of the e-mini S&P. Each bar contains 1,000 ticks. This is the text that accompanied the chart: "Another example of using price bars and price bar relationships correlated with 15-min and 60-min charts. After a large go down, it is reasonable to have it go back up some."
Developer: Joe Ross
Administration and New Developments: Philippe Gautier
Check out our newest IIG example which produced for our subscribers a $25 Profit (Average), $1,370 Margin, and 111.01% Return on Margin Annualized. Read more.
We have also added new types of trades for our IIG daily guidance, "no loss" propositions with unlimited upside potential, still using other people's money to trade .
Blog Post - "Once I’ve achieved success as a trader, then what? I’ve heard that after a while trading can become boring."
by Master Trader Joe Ross
Author, Trader, Trading Mentor, and Founder of Trading Educators, Inc.
I know you would all like to have that problem, but I can vouch for its being true. I always have to find new ways to trade or I do become bored. However, I have never run out of ways to trade that remain exciting, at least for a fairly long time. Read more.
"Subscribed and loving it. Now I just look at the numbers generated for what I want to trade and put the orders in with my broker. It's just that easy. It's pretty much point and click. I really feel empowered and way more confident now, thanks to the service." DR, Michigan
You will be excited to learn about our new service, Ambush Signals for the Futures markets. Watch my short presentation to find out more about Ambush Signals.
To view previous published Chart Scan newsletters, please log in or click on "Join Us,"
shown above, to subscribe to our free "Members Only" section.
A WEALTH OF INFORMATION & EDUCATION:
Joe Ross-Trading Educators' popular free Chart Scan Newsletter has been published since 2004.
Note: Unless otherwise noted, all charts used in Chart Scan commentary were created
by using Genesis Financial Technologies' Trade Navigator (with permission).
Legal Notice and Copyright 2016 Disclaimer - Published by Trading Educators, Inc.
Chart Scan is a complimentary educational newsletter.
Whenever this time of year rolls around, I find myself with an attitude of gratitude. This week we celebrated Thanksgiving Day. Although "Thanksgiving" is not celebrated here in Uruguay, many living here celebrated at various places around the country. There were at least fifty people at the gathering my wife and I went to.
Trading and markets have been a major part of my life for almost 60 years. Trading has been the means through which my family and I have received many blessings.
I am grateful that I’ve been able to share those blessings with my many students. I am thankful for each and every one of you. Trading can be a lonely business, especially if you selfishly keep entirely to yourself what you know and have learned. At Trading Educators, it’s just not in us to be that way.
I wonder if you realize how rare it is to find traders, who are not only successful with their own trading, but are also willing to help others to achieve success?
A few days ago, as I was looking at our website, I stumbled across a brief statement of our philosophy at Trading Educators. I wonder how many of you have read it, and have truly given it some serious thought?
"Teach our students the truth in trading — teach them how to trade,"
and
"Give them a way to earn while they learn — realizing that it takes time to develop a successful trader."
All of our staff and associates truly believe in these ideas, and we work hard to bring you the best we have to offer because your success is our success.
Having been through the steps ourselves, we know how difficult it can be to one day realize that you are able to trade for a living - to realize that you have finally made it! There are so many times when you are ready to give up; So many times when you feel defeated. Trading looks easy, but once you are involved you realize that it takes great dedication, and persistence to reach the top. The toughest part of trading is learning to master yourself.
We want to encourage you to keep at it. Don’t give up. The rewards are greater than you think.
For those of you who celebrated Thanksgiving Day, we hope it was a terrific day for you. For those of you who live in countries where there is no Thanksgiving Day, perhaps you should give it a try. Set aside a day to be thankful for what you have. Everyone has something to be thankful for. At Trading Educators we are thankful that we have so much to share with all of you.
To view previous published Chart Scan newsletters, please log in or click on "Join Us,"
shown above, to subscribe to our free "Members Only" section.
A WEALTH OF INFORMATION & EDUCATION:
Joe Ross-Trading Educators' popular free Chart Scan Newsletter has been published since 2004.
Note: Unless otherwise noted, all charts used in Chart Scan commentary were created
by using Genesis Financial Technologies' Trade Navigator (with permission).
Legal Notice and Copyright 2016 Disclaimer - Published by Trading Educators, Inc.
Chart Scan is a complimentary educational newsletter.
You've been curious about the Ambush Trading Method EBook for a while, but haven't been sure, or didn't want to go through the hassle of setting up your charting software accordingly. Or the thought of having to calculate the entry price for each of the markets scared you off. Or if you simply aren't ready to invest in the Ambush Trading Method EBook as you haven't been sure if it's actually for you in the long run.
You will be excited to learn about our new service, Ambush Signals for the Futures markets. Watch my short presentation to find out more about Ambush Signals.
by Master Trader Joe Ross
Author, Trader, Trading Mentor, and Founder of Trading Educators, Inc.
SPIKE REVERSAL
Spike reversals have almost always been good for me. They are a definite setup, and with the proper filters, which we teach in our "Trading All Markets" online recorded webinar, it’s possible to approach 90% winning trades. There have been times during my trading career that I traded only spike reversals. However, the one in the graph would not have been taken. The reason is the gap opening on the bar following the reversal bar.
To the best of my knowledge, gap openings result in 50% good trades and 50% bad trades. However, 50-50 is not breakeven because of commissions and fees. It means I miss some beautiful trades, but I always want the probabilities to be in my favor.
by Master Trader Joe Ross
Author, Trader, Trading Mentor, and Founder of Trading Educators, Inc.
As a trader, it's essential that you set specific goals. Trading is chaotic enough without trying to achieve unstructured goals that are difficult to manage and reach. Making profitable investments requires you to prepare carefully. You have to develop hypotheses regarding current market conditions. You have to devise...read more.
Developer: Joe Ross
Administration and New Developments: Philippe Gautier
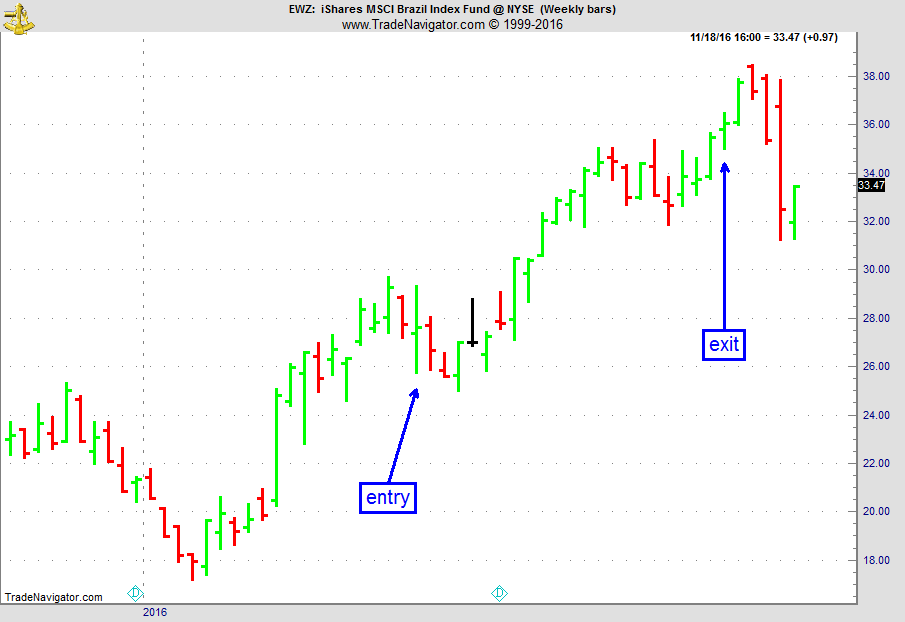
On 11th May 2016, we gave our subscribers a new type of trade for EWZ, the Brazil ETF, which was showing accumulation on a pullback on the weekly chart.
We entered a "complex position" for a net credit (still working with OPM, i.e. other people's money, as usual), but with unlimited upside potential.
On 12th May 2016, we entered the trade for a credit of $1.20 (or $120 per position).
On 14th October 2016, we closed the trade @ $4.15, after 155 days in the trade.
Profit: $535
Margin: $760
Return on Margin annualized: 165.77%
These are low maintenance, low stress trades with lots of upside potential.
We presently have 15 of these trades opened. We took partial profits on some of them.
This new technique allowed us to take advantage of the recent sector rotation moves in the market, with stocks like US Steel (X), to name only one.
If you are interested in learning this new technique, come and join us!
To view previous published Chart Scan newsletters, please log in or click on "Join Us,"
shown above, to subscribe to our free "Members Only" section.
A WEALTH OF INFORMATION & EDUCATION:
Joe Ross-Trading Educators' popular free Chart Scan Newsletter has been published since 2004.
Note: Unless otherwise noted, all charts used in Chart Scan commentary were created
by using Genesis Financial Technologies' Trade Navigator (with permission).
Legal Notice and Copyright 2016 Disclaimer - Published by Trading Educators, Inc.
Chart Scan is a complimentary educational newsletter.
by Master Trader Joe Ross
Author, Trader, Trading Mentor, and Founder of Trading Educators, Inc.
VOLATILITY STOP
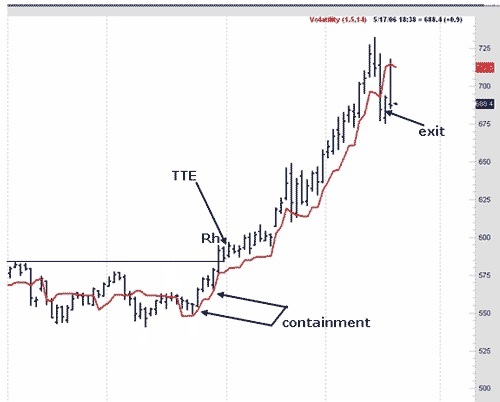
In past issues of Chart Scan I mentioned that The Law of Charts has many implementations. One of them is the Traders Trick Entry. But there are others. One implementation of The Law of Charts is done using the Volatility Stop study (VS).
When you have a trading range and prices ultimately break beyond the trading range, you have a defined trend. When they subsequently form a Ross hook, and then violate the point of that hook, a trend has been established. This is what happened in gold futures based on the daily chart. A low was in place at the base of a trading range. Prices violated the high point of the trading range, and then violated the point of the Ross hook. The VS could then come into play. I will not have time or space to describe in detail the parameters of the VS; however, it is a wonderful device for curve fitting to the reality of a trend. Unlike a moving average, the VS is reflective of current volatility in the market.
The way I use it is to curve fit so that VS shows containment at the base of the new swing that is being formed. From that point you can stay in as long as you do not get a Close below the VS. Some implementations of the VS enable you to offset the VS line by pushing it ahead one day, so that you can know where you will place your protective stop tomorrow. You can change the number of bars to be placed into the moving average of the volatility, and you can use a combination of offset, moving average, and a multiplier to make that VS line snuggle right up to the lows of the trend. The parameter settings for the chart below were a multiplier of 1.5 and 14 bars in the moving average of volatility. The rest of the story is on the chart.
A reader asks: "I bought a system that requires a minimum account size of $20,000. If you were me, how would you manage it?"
by Master Trader Joe Ross
Author, Trader, Trading Mentor, and Founder of Trading Educators, Inc.
Well, since I’m not you, I can only tell you how I would manage it. If I lost $10,000, I would stop trading and examine my losses to discover if a logical trading plan of action is being pursued. I would separate losses into technical and psychological failures. I would examine each of them separately to discern if any consistent losing behavioral patterns are evident, such as violating the rules of the trading system or if self-discipline is not being maintained. If I were winning, I would be sure to remove my initial startup capital from my account, once my account size had doubled.
Your question brings to mind a sad story about a friend of mine. It took place years ago in a market situation much like we are seeing today in the metals. He was trading the Mexican peso with insider information, and managing an account of $200,000. Each participant in the managed account put up $20,000. In very little time, the account grew to $500 thousand. At that time, with that amount of money, you could really move the peso and cause prices to move against you. There was simply no room for that much money to be traded in that market at that time, and they had no desire to be market movers. So my friend began to trade silver futures, also with inside information. Silver was on a rampage along with gold. Before long, they had $1.2 million in the account. However, their timing was terrible. They were caught in the fiasco when the Hunt brothers tried to corner the silver market. Silver began to crash, and soon their account was wiped out. All the money was lost, the entire $1.2 million. I asked my friend, "When you had $1.2 million in the account, why didn't you at least take out the seed money? Why didn't you take out the $200,000? He said, "No one wanted to touch that money. We were on a roll!" Lesson learned: Take the money when it is there to be taken. At least take out your seed money.
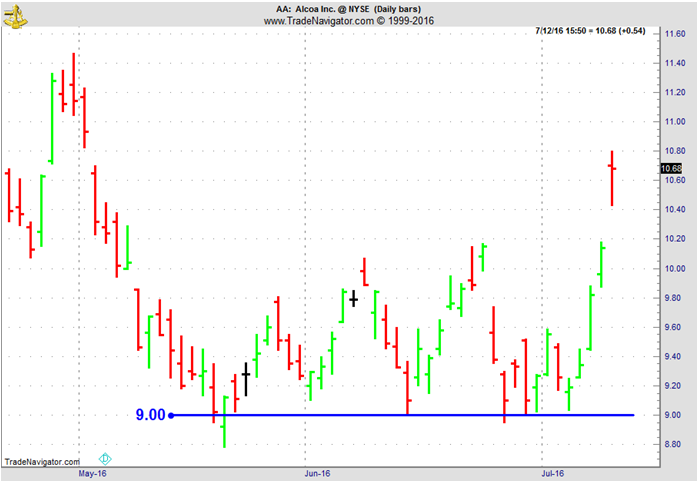
On 12th July 2016 we gave our IIG subscribers the following trade on AA, which gapped up on earnings and was showing strong accumulation. The trade was suitable for very small accounts, with an initial margin of only $180. We decided to sell price insurance as follows the following day:
On 13th July 2016, we sold to open AA Aug 26 2016 9P @ $0.10, i.e. $10 per option sold, with 43 days to expiration, and our short strike at a major support zone, 16% below price action.
On 21st July 2016, we bought to close AA Aug 26 2016 9P @ $0.05, after 8 days in the trade, for quick premium compounding
Profit (average): $5
Margin: $180
Return on Margin Annualized: 126.74%
We have also added new types of trades for our IIG daily guidance, "no loss" propositions with unlimited upside potential, still using other people's money to trade.
Traders Notebook Outrights gives you high probablity trades that are hand-picked for optimum results. If you are a futures swing trader looking for real trades while learning the correct way to place stops and the art of trade management, this is for you.
Traders Notebook Outright Guide explains the Outright trading service from Trading Educators. It shows you around on the Outright Campus, and how to use the information provided by the service.
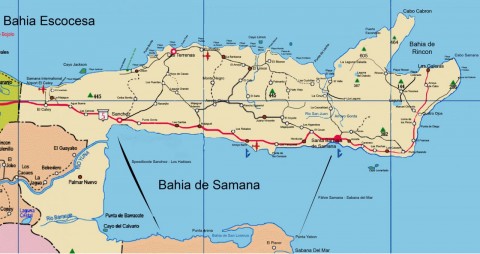
From Saturday October 29 until November 5 my wife and I took a vacation trip to Samaná, Dominican Republic. From Santiago, where we live, it takes about a 3 hour drive to get there. I love the region of Samaná because it is still very virgin compared to Bavaro or Punta Cana with only a few hotels. Read more.
To view previous published Chart Scan newsletters, please log in or click on "Join Us,"
shown above, to subscribe to our free "Members Only" section.
A WEALTH OF INFORMATION & EDUCATION:
Joe Ross-Trading Educators' popular free Chart Scan Newsletter has been published since 2004.
Note: Unless otherwise noted, all charts used in Chart Scan commentary were created
by using Genesis Financial Technologies' Trade Navigator (with permission).
Legal Notice and Copyright 2016 Disclaimer - Published by Trading Educators, Inc.
Chart Scan is a complimentary educational newsletter.
You asked for it and we listened. Andy Jordan is now offering a new service called Traders Notebook Outrights for swing traders. Also, scroll down to read about Marco Mayer's AlgoStrats:FX Live Trading Account which gained about +4% with a very low target risk of 0.5% per trade.
The Law of Charts with Commentary
by Master Trader Joe Ross
Author, Trader, Trading Mentor, and Founder of Trading Educators, Inc.
A Traders Trick Entry (TTE) Question
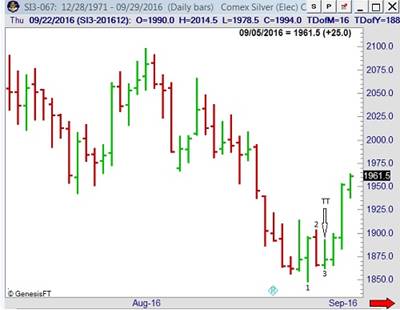
This week someone asked me: "Joe, would you have taken the Traders Trick even though prices finished in the lower half of the price bar?"
My answer was "I would not take it!" We were looking at a Traders Trick Entry ahead of a breakout of the #2 point of a 1-2-3 low at the end of a swing. However, since my objective would have been scalp money around the #2 point, prices would have had to move quite a bit on the next bar just to reach the high of the of the #3 bar. As you can see, price did not reach the #2 bar until a day later.
Over the years, many refinements have been made to the TTE. These refinements have made using them result in a very high win percentage. You can learn about the TTE refinements by signing up for the Traders Trick Advanced Concepts Webinar.
A reader asks: How do you handle fear? I seem to have plenty of it.
by Master Trader Joe Ross
Author, Trader, Trading Mentor, and Founder of Trading Educators, Inc.
Let’s get one thing straight. Fear, for the majority of traders, is a very real thing. You have it, I have it. Others have it as well. What is it that traders fear? The top three, in order, are:
Fear of missing a trade.
Fear of losing money.
Fear of being wrong and losing face.
In order to become a professional trader, you must learn to deal with fear. The first step is to acknowledge that you have it, which is what you have done. Once you admit to fear, you can begin to deal with it.
When you notice the impulse to trade based on strong fear, it is usually best to literally step out of the trap by stepping out of the situation.
You need to get up, walk away from the computer. Turn off the television if it's tuned to a financial station, take a walk, get something to eat, go outside and cut the grass, water the lawn, or do anything that will move you out of the fear/panic mode.
Don’t return to your trading desk until you have managed to achieve some emotional control over your fear/panic reaction. If you can’t get a grip on your fear, then don’t come back that day.
Most likely you will find that even if you keep thinking about the miserable market conditions while you water the lawn, simply getting away from the keyboard and monitor is enough to make a difference. It removes the demand to take action, and gives you the mental space to gain perspective and let go of your impulsive, fear-based reaction.
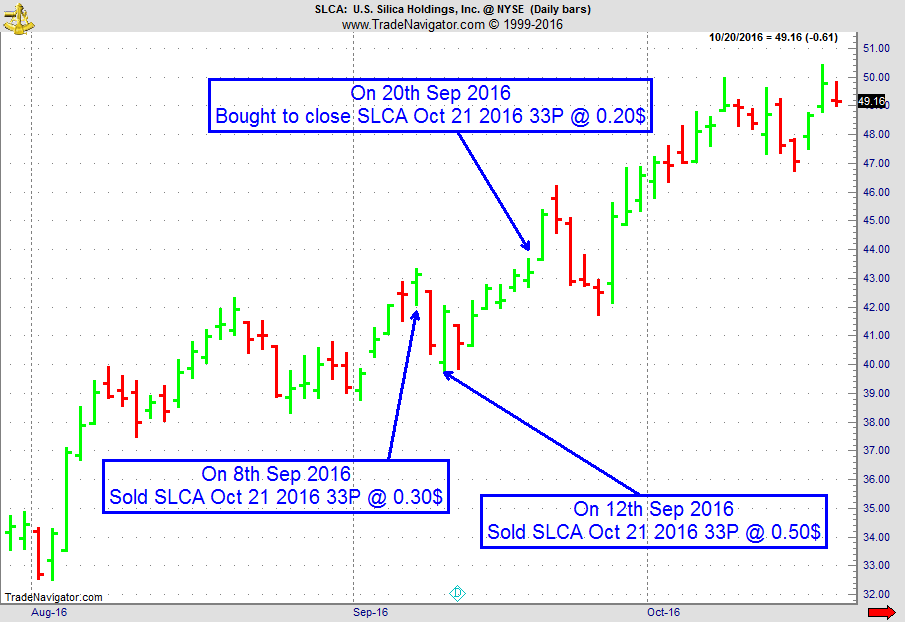
On 7th September 2016, we gave our IIG subscribers the following trade on SLCA, which was showing strong accumulation. We decided to sell price insurance as follows, in 2 equal steps:
On 8th September 2016, we sold to open SLCA Oct 21 2016 33P @ $0.30, i.e. 30$ per option sold, with 43 days to expiration, and our short strike well below a major support zone.
On 12th September 2016,we sold to open SLCA Oct 21 2016 33P @ $0.50 on a good till cancelled order.
On 20th September 2016, we bought to close SLCA Oct 21 2016 33P @ $0.20, after 10 days in the trade, for quick premium compounding.
Profit (average): $20
Margin: $660
Return on Margin Annualized: 110.61%
We have also added new types of trades for our IIG daily guidance, "no loss" propositions with unlimited upside potential, still using other people's money to trade.
Traders Notebook Outrights gives you high probablity trades that are hand-picked for optimum results. If you are a futures swing trader looking for real trades while learning the correct way to place stops and the art of trade management, this is for you.
Traders Notebook Outright Guide explains the Outright trading service from Trading Educators. It shows you around on the Outright Campus, and how to use the information provided by the service.
When traders are hot and seemingly cannot lose. When they make several trades that perform exceedingly well, there is a surge of human pride. They feel like...read more.
Marco Mayer and his subscribers had a great trading month in October. The AlgoStrats:FX Live Trading account gained about +4% with a very low target risk of 0.5% per trade. This was possible thanks to a winning rate of about 85% while having a profit to loss ratio of about 2:1 at the same time. Sounds awesome? We think so too, especially considering we're trading just once each day and usually are done trading within 2-3 minutes.
Don't forget this happened not just on some spreadsheet with some numbers on it or on a simulated account, but on a real money account that is fully transparent to all AlgoStrats:FX subscribers.
To learn more, here's a video where Marco walks you through the recent performance of AlgoStrats:FX:
To view previous published Chart Scan newsletters, please log in or click on "Join Us,"
shown above, to subscribe to our free "Members Only" section.
A WEALTH OF INFORMATION & EDUCATION:
Joe Ross-Trading Educators' popular free Chart Scan Newsletter has been published since 2004.
Note: Unless otherwise noted, all charts used in Chart Scan commentary were created
by using Genesis Financial Technologies' Trade Navigator (with permission).
Legal Notice and Copyright 2016 Disclaimer - Published by Trading Educators, Inc.
Chart Scan is a complimentary educational newsletter.
"Teach our students the truth in trading - teach them how to trade,"
and
"Give them a way to earn while they learn - realizing that it takes time to develop a successful trader."
Derivative transactions, including futures, are complex and carry a high degree of risk. They are intended for sophisticated investors and are not suitable for everyone.
There are numerous other factors related to the markets in general or to the implementation of any specific trading program which cannot be
fully accounted for in the preparation of hypothetical performance results, and all of which can adversely affect actual trading results.
For more information, see the Risk Disclosure Statement for Futures and Options.