Trades in Stock Options. Receive daily trade recommendations. Can you imagine discovering a way to trade that promises instant income? If you think such a method is impossible, think again. It is definitely achievable, and everything you need to know is available online for one low price that includes special three-part online webinars.
Ambush is a time-proven mean-reversion day trading System focused on a variety of Futures markets around the globe. With Ambush Signals you can now easily follow the Ambush System on a subscription basis for educational purposes.
If you didn't fail early in your trading business, then you have probably been around long enough to realize that many of the problems you encounter as a trader are those that derive from your own individuality. Such problems are common among traders and, in fact, common among all human beings. Seeking spiritual help from a power much greater than your own is the area I address in the "Spiritual Side of Trading".
"Price is what you pay. Value is what you get." ~ Warren Buffett
The Law of Charts with Commentary
by Master Trader Joe Ross
Author, Trader, Trading Mentor, and Founder of Trading Educators, Inc.
EURO/USD
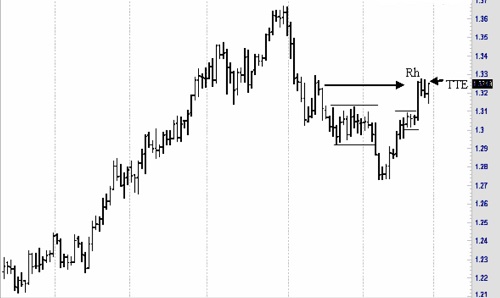
Euro had formed a Ross hook with a Traders Trick entry on the daily chart. Implementation of The Law of Charts teaches that entry signals from a larger time frame can be entered and managed on a lesser time frame. So let’s look first at the daily chart and then see how we might have managed a trade on the chart of a lesser time frame.
We see on the chart a set of matching congestions. Matching congestions are described in my book “Day Trading” and also in my book “Trading Is a Business.”
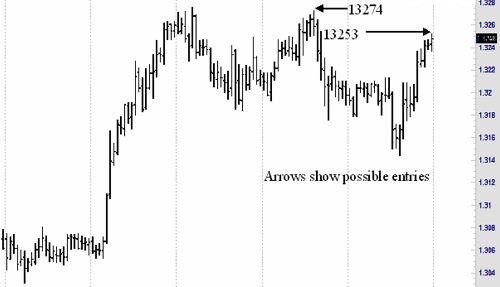
The Law of Charts states that a Ross hook is the first failure of prices to move higher following a breakout from congestion. The Law also states that one of the best ways to enter such a trade is from a Traders Trick entry. In this case entry would be at 1.3253.
Now let’s go to a lesser time frame for actual entry and management. We’ll use a 60-minute chart.
by Master Trader Joe Ross
Author, Trader, Trading Mentor, and Founder of Trading Educators, Inc.
Recently, I wrote: "As a human being there is a component working in you that is comprised of the following elements: Your intellect, your emotions, your memory, your imagination, and your will. These elements work together to determine who you are and how you will behave in the market -- actually, in anything and everything you undertake to do." This week we are going to look at "Intellect" to see how this element can defeat you as a trader.
Over decades of trading and teaching others how to trade one of the greatest problem areas that regularly comes up is that of intellect. You might want to think about that for a moment (no pun intended). A component of intellect is "logic." How can logic undermine a trader?
Being intelligent, being a logical thinker, having a high degree of intellect is often the worst thing that can happen to a trader, yet it is those persons having these gifts who are most often attracted to the business of trading.
The problem for these aspiring traders is that there is little to do with logic when it comes to trading in the markets. Markets are driven by emotions, the two most prominent being fear and greed. There is not a shred of logic in either of those emotions. On a purely intellectual level the markets consists of a place to buy and sell. They are places, where to the best of man's ability, a somewhat fair price may be discovered. Finding out a price at which buyers are willing to buy and sellers are willing to sell, seems altogether a logical pursuit. Indeed, this process is called price discovery. Although price discovery is often corrupted by those who are able to manipulate prices it is the best method man has come up with.
On the surface markets appear to be logical and intellectually solvable. However, the truth is that because they are driven by emotions they are actually confusing and chaotic, and anyone trying to put the movement of prices into a box is doomed to failure.
Sadly, the majority of people who are attracted to trading are those who want everything about price movement to make sense. Their attempts at setting boundaries for price movement are truly tragic. They talk about support and resistance as though somehow, magically, those price levels will contain prices. They draw trendlines and defy prices to cross them. They draw angles and pitchforks, speak knowledgeably about Fibonacci ratios, Elliott Waves, MACDs, and so forth as if these concepts had any logic behind them at all.
I'm not saying that any of the above are not tools that can be used in trading, but they must be used with full knowledge of their weaknesses and with full knowledge of what they can actually show. Any and all tools used for trading can fail, and unless a trader is willing to be flexible, there will be little chance for success.
There is no end to knowledge and understanding that must be acquired by a trader. There are no rigid lines, no boxes, no be-all to end-all models that will always work. There are no perfect systems and no perfect methods. The problem with intellect is that its logical element wants safety and assurances. Intellect wants a perfect fit every time. But anyone who has traded with real money, soon finds out that trading simply isn't logical. Prices cannot be confined. Markets are like the proverbial 600 pound gorilla. They go wherever they want to go.
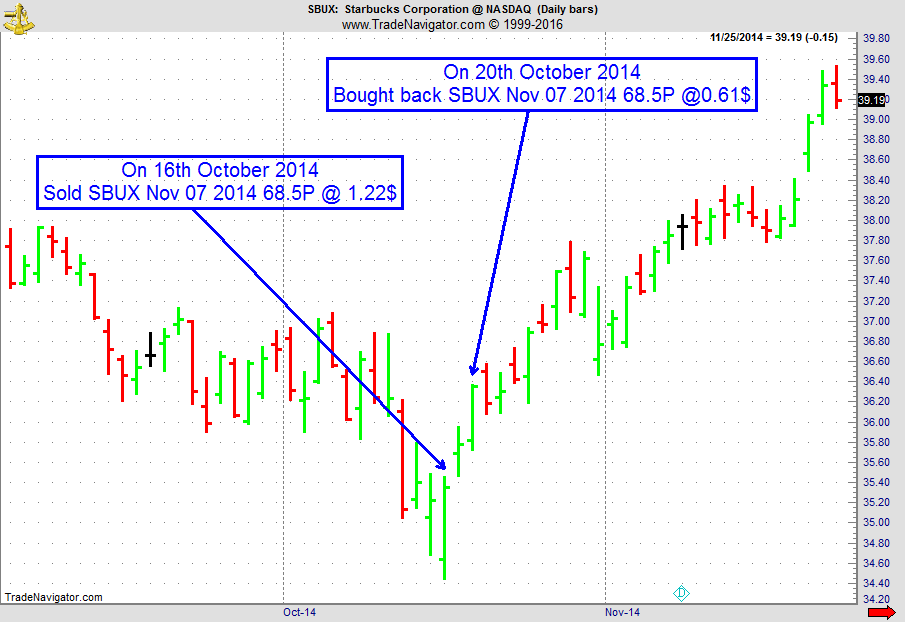
On 15th October 2014 we gave our IIG subscribers the following trade on SBUX. As the stock was bouncing back up around a major support level, we decided to sell price insurance as follows the following day:
On 16th October 2014, we sold SBUX November 07 2014 68.5P @ $1.22, ie. $122 per option sold; the short strike was below support level, with only 21 days to expiration.
On 20th October 2014, we bought back SBUX November 07 2014 68.5P @ $0.61, after only 3 days in the trade.
Some traders unconsciously ratchet their emotions up a notch each time they avoid a trade when the market is not in their favor. So their emotions build, like steam pressure, to higher and higher levels. You can see the anger growing... Read more.
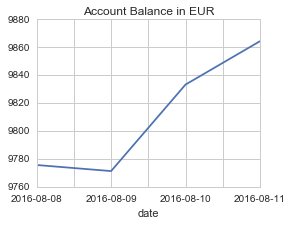
I’d like to give you an update on what happened trading AlgoStrats:FX during the second week after the Free Trial. We had a quite bumpy start in the first week, see my video from last week, the second week was quite a good one considering that most FX markets barely moved.
Here’s what happened in the live trading account this week (showing close equity balance including open trades):
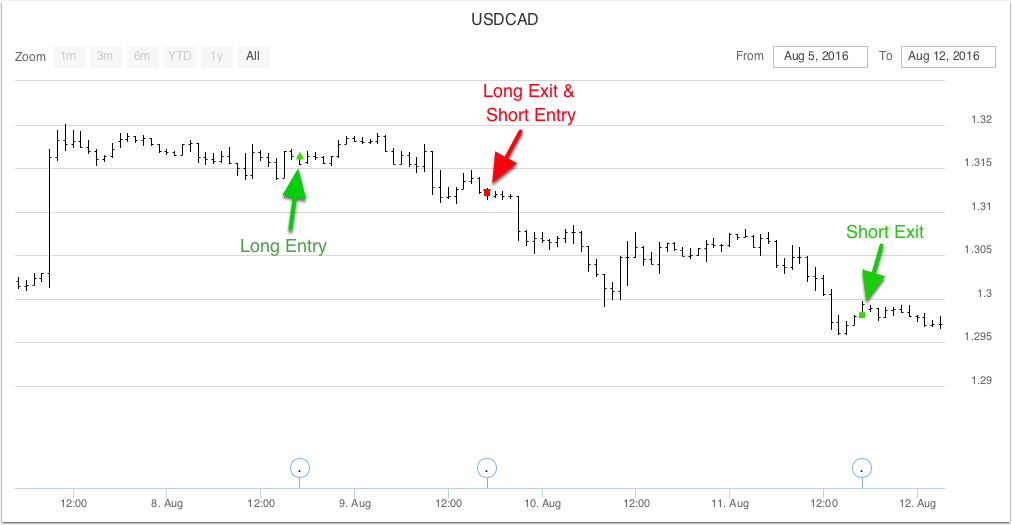
After capturing a profit in EUR/USD on Wednesday we also got into a short trade in USD/CAD which turned out as a nice winning trade:
What’s interesting about this trade is that on Monday, we actually got a long signal for USD/CAD speculating for a continuation of last week's move. As this didn’t happen, another system kicked in specialized on capturing such failures on Tuesday, and we reversed the position. This turned out to be a nice trade that we closed out yesterday. One of the big advantages of trading systematically as we do with AlgoStrats:FX is the flexibility that is so hard to have as a discretionary trader. We all know how hard it is to not only close out a trade that doesn’t work out, but to actually reverse it. Luckily, our trading systems don‘t have that issue.
Feel free to email questions to This email address is being protected from spambots. You need JavaScript enabled to view it., or post it in our Blog or Forum. Follow me on Facebook and Twitter!
To view previous published Chart Scan newsletters, please log in or click on "Join Us,"
shown above, to subscribe to our free "Members Only" section.
A WEALTH OF INFORMATION & EDUCATION:
Joe Ross-Trading Educators' popular free Chart Scan Newsletter has been published since 2004.
Note: Unless otherwise noted, all charts used in Chart Scan commentary were created
by using Genesis Financial Technologies' Trade Navigator (with permission).
Legal Notice and Copyright 2016 Disclaimer - Published by Trading Educators, Inc.
Chart Scan is a complimentary educational newsletter.
Trading Educators was founded by Joe Ross and we hold true to his philosophy:
"Teach our students the truth in trading - teach them how to trade," and "Give them a way to earn while they learn - realizing that it takes time to develop a successful trader."
For those new to our company, it's important that you understand this and we are here to help you. We offer quality products and services that assist and create independent traders which is our #1 goal. Feel free to contact any one of our traders. We hope that you have success in your trading, and are always striving to educate and improve yourself.
The Law of Charts with Commentary
by Master Trader Joe Ross
Author, Trader, Trading Mentor, and Founder of Trading Educators, Inc.
Failed Entry?
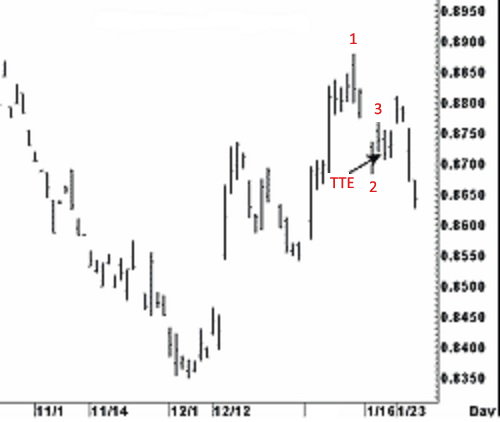
Consider this week's chart below. On this chart you see what some would call "a failed Traders Trick Entry" following a breakout of the number two point of what at the time was a 1-2-3 high formation. Does this mean that 1-2-3 formations are not valid? The Law of Charts describes a concept, not a method for trading. The 1-2-3 high was there at the time. There is no undoing that fact.
Does the fact that the Traders Trick seemingly failed mean the Traders Trick is no longer a viable implementation of a 1-2-3 high?
The answer to both questions posed above is trade management — at which point do you realize the trade isn't working out and extract yourself from a bad trade? Believe me, after trading countless thousands of times, I know and know that I know — I will have losses from failed trades.
Now consider this: Entry using the Traders Trick was at 8719. A position trader using only a daily chart for entry and exit could have sustained a loss. I say could have because there is no way for me to know the risk tolerance of another trader.
There were 11 possible profit-taking ticks in that trade, ($137.50) as prices move to 8708. Trading a ten-lot in most markets is not going to move the market, and taking 10 ticks offers a high percentage trade. If trade management were correct on a ten lot in a currency futures, $1,375 would have been available.
Let's say a daily position trader placed a first objective to buy back half the position at 10 ticks, with a second order to move the remaining portion of the position to breakeven, contingent upon the first objective being reached. Now, was that a bad trade? Can you see that once you are in a trade, success depends almost entirely on management beyond the initial fill?
In our seminars and one-on-one tutoring, we do not hand you a fish, we teach you how to fish. After that you will no longer need us, other than that we remain friends and mutually successful and profitable traders.
How should you feel about losses? I once read somewhere that you are supposed to love losses. Does that make sense to you? It doesn't to me.
by Master Trader Joe Ross
Author, Trader, Trading Mentor, and Founder of Trading Educators, Inc.
The worst aspect of losing is that it tends to create pessimism. Traders should feel bad when they lose money only if they fought the market trend, or violated their own trading strategies. The best traders have a healthy "so what, big deal!" attitude that maintains a sense of humor about losses. There is no reason to feel bad about losses if the trading discipline was correctly used. On the other hand, there is no reason to learn to love them either.
Analyze losses, learn from them, and then let them go; move on, that's the best thing to do.
Understanding man's relationship to time is one of life's most important challenges. When man becomes free of time's constraints, he lives life to the fullest and achieves goals on his own terms. Pessimism traps traders in the past, destroys their present, and robs them of the future. Imagine a world without time where the thought of death is not a finality of existence. If money were not the reason for your work-related behavior, then who are you? Where are you, and what are you doing? Who shares this existence with you? In the philosophical sense, man creates himself and his existence when he takes responsibility for his actions and his time. Think how any individuals create order, structure, and discipline in their lives. How will you allow a trading loss today affect your life five years from today?
Thinking the wrong way can become self-fulfilling. The trouble with self-fulfillment is that many people have a self-destructive streak. Accident-prone drivers keep destroying their cars, and self-destructive traders keep destroying their accounts. Markets offer unlimited opportunities for self-sabotage, as well as for self-fulfillment. Acting out your internal conflicts in the marketplace is a very expensive proposition.
Traders who are not at peace with themselves often try to fulfill their contradictory wishes in the market. If you do not know where you are going, you will wind up somewhere you never wanted to be.
Every business has losses. I cannot think of any that don't. Shoplifting, embezzlement, internal pilferage, lawsuits, bad debts, spoilage, etc., I'm sure you can think of even more. You name it and businesses have one or more of the many ways to experience losses. Most businesses expect and accept such losses as part of doing business. Why, then, is it such a big deal when you have a loss in trading? If you know the answer to that, please let me know.
The way I handle a loss is this: I examine it, make every attempt to learn from it, and ascertain whether I had the loss by straying from my trading plan. If I have strayed, I reinforce my resolve to stick with my plan. If I have not strayed, then I learn from it what I can, and shrug it off as a cost of business. It is not an expense, it is a cost, and if you don't know the difference you need to take a course or read a book on the basics of accounting.
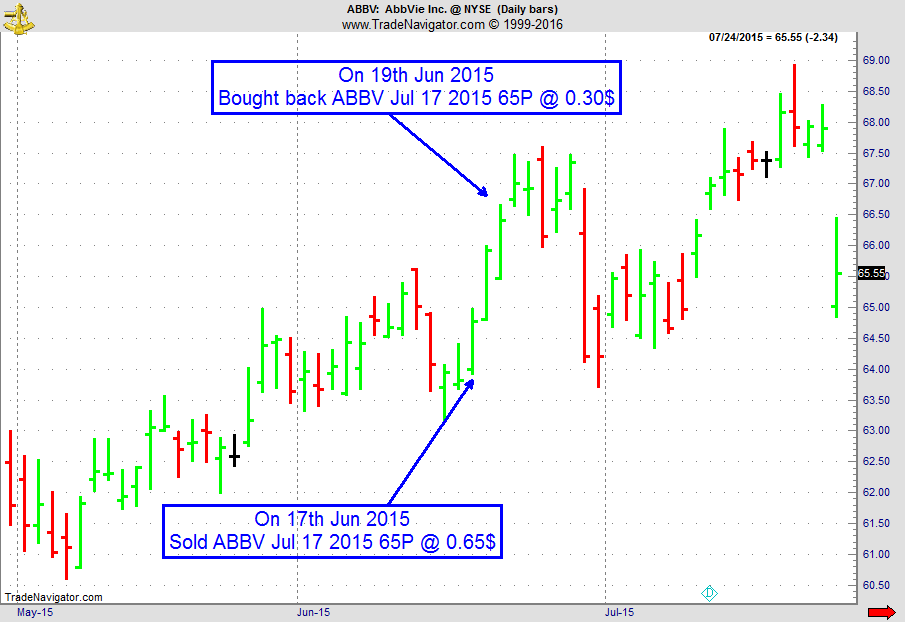
On 16th June 2015, we gave our IIG subscribers the following trade on ABBV, a strong stock in a strong sector. As momentum was back in our favor, we decided to sell price insurance as follows the following day:
On 17th June 2015, we sold ABBV July 17 2015 65P @ 0.65$, ie. $65 per option sold; the short strike was below support level, with only 29 days to expiration.
On 19th June 2015, we bought back ABBV July 17 2015 65P @ $0.30, after only 2 days in the trade
Profit: $35
Margin: $1,300
Return on Margin annualized: 491.35%
Another trade with quick premium compounding.
We have also added new types of trades for our IIG daily guidance, "no loss" propositions with unlimited upside potential, still using other people's money to trade.
The free trial week of AlgoStrats:FX is almost over, so I decided to create a video giving you a summary of the first week. Thank you to everyone who participated in the free trial and I really appreciated your feedback!
Feel free to email with questions at This email address is being protected from spambots. You need JavaScript enabled to view it., or post it in our Blog or Forum. Follow me on Facebook and Twitter!
Ambush Method Trade and Performance Report
by Master Trader Marco Mayer
Educator for Forex and Futures, System Trader, and Creator of Ambush Trading Method
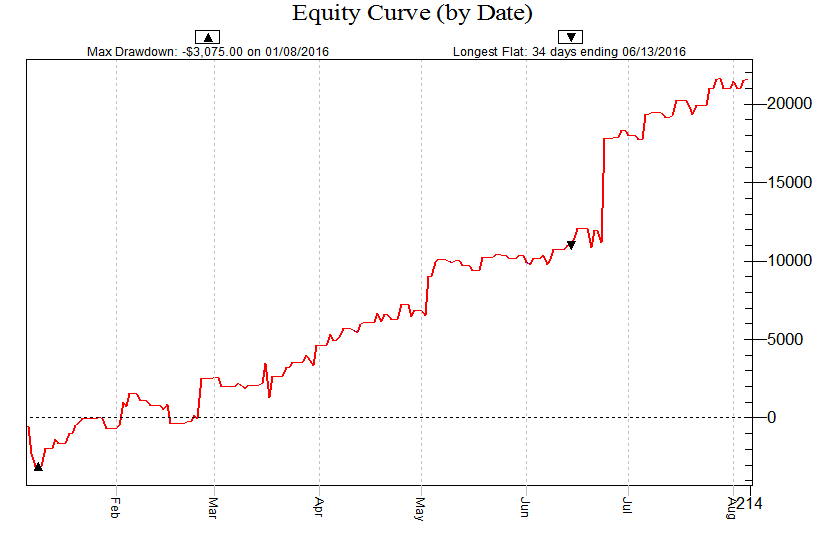
After Ambush had a tough start into 2016, during the last couple of months it literally took off in pretty much every market.
Let’s look at the performance of a typical Ambush-Basket with you:
Henry Hub Natural Gas Futures (NG)
E-Mini S&P 500 (ES)
Dollar Index (DX)
Australia Dollar (6A)
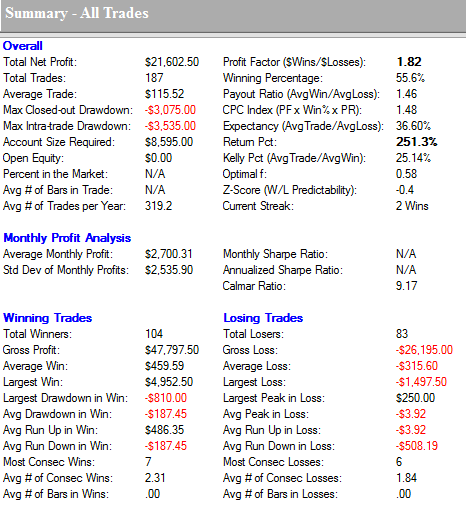
As you can see, Ambush managed to make a total of over $20,000 trading one contract in each of the markets (including $10 for commissions and slippage round-turn).
What makes Ambush so unique is that it achieved these results without holding any positions over-night. So these are day trades - but the only time you need to take action is at the market close each day!
Here’s the Equity-Curve, showing a rough start into 2016 but a really strong rally for the rest of the year so far:
Ambush didn’t just perform well in these markets. It did so across the board, and there are markets that did even better like Gas Oil for example.
Actually looking at the performance of all Futures markets, Ambush is trading at new all time equity highs again! We’d like to celebrate this with you and are offering you a special discount with 10% off this week! Use coupon code ambush10 when you check out. Offer valid until August 10, 2016.
Please look at the long-term performance of all other markets supported by Ambush. Check out the reports on the Ambushpage.
To view previous published Chart Scan newsletters, please log in or click on "Join Us,"
shown above, to subscribe to our free "Members Only" section.
A WEALTH OF INFORMATION & EDUCATION:
Joe Ross-Trading Educators' popular free Chart Scan Newsletter has been published since 2004.
Note: Unless otherwise noted, all charts used in Chart Scan commentary were created
by using Genesis Financial Technologies' Trade Navigator (with permission).
Legal Notice and Copyright 2016 Disclaimer - Published by Trading Educators, Inc.
Chart Scan is a complimentary educational newsletter.
Who doesn't want extra income guaranteed? Follow along with our "Instant Income Guaranteed" examples that will be highlighted after Joe's trading article. Here's what one subscriber has to say!
"Its been around a year since I enrolled in the IIG program. Probably the best "trading" decision I have ever made. It is amazing the annualized return you can produce if you keep flipping your money. I have taken shares on a couple of stocks because I chose to do so, I don't consider that a loss. Thanks, Randy C. (July 2016)"
The Law of Charts with Commentary
by Master Trader Joe Ross
Author, Trader, Trading Mentor, and Founder of Trading Educators, Inc.
Matching Congestions
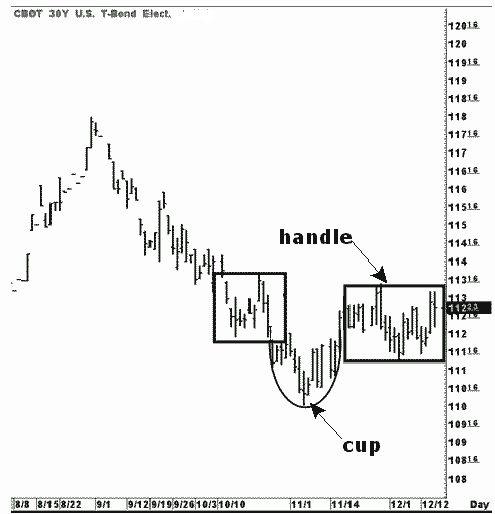
A few years ago I was asked about the chart below. The question was: "What do you think about what you see there?" The daily bond chart was showing a very interesting formation as I write this. It is a formation known in theLaw of Charts as "matching congestions." Matching congestions are usually a prelude to a significant move. In this instance, the matching congestions were also taking place along with a formation known as a "cup with handle." Not all matching congestions are also cup with handle formations. The cup with handle, when seen as on the chart below, typically breaks out the upside. With the underlying economy weakening as of the reports at that time, it seemed likely that we would see an up move on the chart. The matching congestion are seen in the left and right boxes.
by Master Trader Joe Ross
Author, Trader, Trading Mentor, and Founder of Trading Educators, Inc.
"Joe! You keep saying the markets have changed. But when I look at a chart of 50 years ago, it looks the same as a chart does today. Would you explain?"
Sure! Charts look the same. They look the same because a price chart reflects the action and interaction of traders as they view events that affect prices. Since human nature has not changed since Adam and Eve in the garden, a chart from before Noah’s flood would look the same then as it does today. But how the chart looks is not what I’m talking about when I say the markets have changed. What I am referring to is the way they trade throughout the day. Also I am referring to the fact of many new markets, and a multitude of time frames in which you can trade all markets.
Let’s look at only a few of the things that have caused these changes. The first major change that I noticed occurred soon after Richard Nixon took the U.S. off the gold standard. This led to a need to trade currencies. The dollar was based on a fixed price for gold, and most other currencies were based on the dollar.
The need to hedge in the currency markets brought about the need for currency futures and increased Forex trading. Additionally, this began to affect virtually all the commodity markets. Commodities that trade internationally now had to be adjusted for constantly fluctuating monetary exchange valuations. Trading interests who never before had to think about how much it would cost to buy commodities from other countries now had to hedge. Trading interests that sold commodities to other countries also now had to hedge. The effect of having a need to trade currencies has affected virtually every known market.
The next major event that caused vast changes in the marketplace was the advent of the personal computer and day trading. Over a relatively brief period of time, the markets have turned into giant casinos with people trading time frames all the way down to tick charts. Suddenly there was a tremendous amount of noise in the markets that was never previously there. Computers and advances in electronic technology have brought the world of trading to the point of a single global marketplace. No longer is trading confined to mostly the U.S. Trading is now a global phenomenon with millions of participants.
Of course, there are many more things I could mention that have changed the way the markets trade. But this is not the place for writing a new book. The impact for the trader of all the changes that have taken place is that the way you manage trades is in a constant state of flux. In general, no one method works forever; no one system can be relied on for very long. The trader must constantly adjust either his system, his method, or himself to the ever-changing market dynamics.
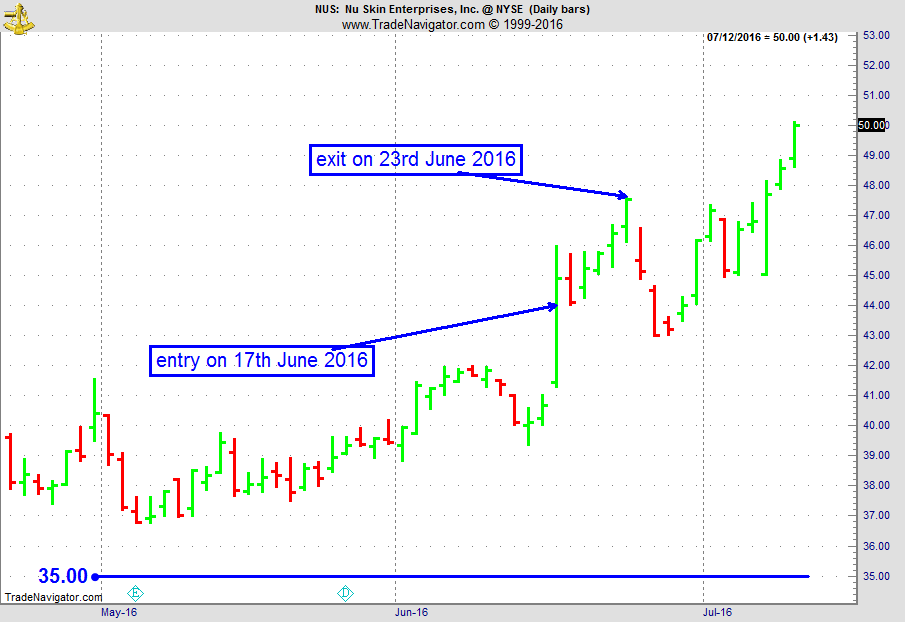
On 16th June 2016, we gave our IIG subscribers the following trade on NUS, which was in an established uptrend, and had a sharp move up on that day after winning a $210M investment from China. As the move was sustained by professional accumulation, we decided to sell price insurance as follows the following day:
On 17th June 2016, we sold NUS July 29 2016 35P @ 0.40$, ie. 40$ per option sold; the short strike was well below price action (22%away) and below a major support level, so that the trade was very safe, with 42 days to expiration.
On 23rd June 2016, we bought back NUS July 29 2016 35P @ 0.20$, after 6 days in the trade.
$Profit: 20$
$Margin: 700
Return on Margin annualized: 173.81%
Philippe
Receive daily trade recommendations - we do the research for you!
Andy gives you a 2016 update on how well Stealth Trading Method, break-out method, is handling the markets. Net profit while trading in 25 markets, and an equity curve with impressive upward movement.
If you have any questions, feel free to This email address is being protected from spambots. You need JavaScript enabled to view it., or post it in our Blog or Forum.
To view previous published Chart Scan newsletters, please log in or click on "Join Us,"
shown above, to subscribe to our free "Members Only" section.
A WEALTH OF INFORMATION & EDUCATION:
Joe Ross-Trading Educators' popular free Chart Scan Newsletter has been published since 2004.
Note: Unless otherwise noted, all charts used in Chart Scan commentary were created
by using Genesis Financial Technologies' Trade Navigator (with permission).
Legal Notice and Copyright 2016 Disclaimer - Published by Trading Educators, Inc.
Chart Scan is a complimentary educational newsletter.
Extra, Extra, read all about it! Ambush Trading Method is on sale for 20% off until July 13th, use coupon code: ambush20
The Law of Charts with Commentary
by Master Trader Joe Ross
Author, Trader, Trading Mentor, and Founder of Trading Educators, Inc.
Trading from a Ledge
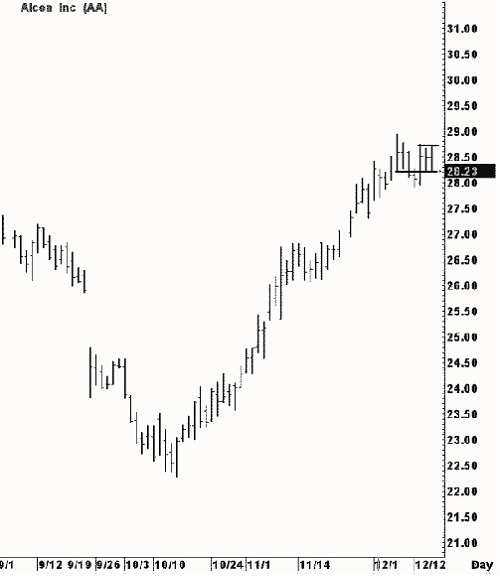
Aluminum prices had been soaring. But aluminum futures were too thin to trade and, besides, the futures are dangerous when thinly traded. One way to get into aluminum was to trade shares in Alcoa Inc. (AA)
AA had formed a ledge. The Law of Charts describes a ledge as being two matching or almost matching highs and two matching or almost matching lows. The two matching highs must be separated by at least one price bar, and the two matching lows must be separated by at least one price bar. A ledge always begins with a Ross hook, but then prices form a consolidation. A ledge occurs only within a trend or swing. The breakout of a ledge is traded only in the direction of the former trend or swing. The chart shows two almost matching highs at 28.74 & 28.75, and two almost matching lows at 28.20 & 28.21. Entry would be made long at 28.76, 1 tick above the high of the ledge.
by Master Trader Joe Ross
Author, Trader, Trading Mentor, and Founder of Trading Educators, Inc.
"I read about a Monday Morning Bull Market Entry Technique. Do you know anything about something like that?"
I’ve run across a few in my many years of trading. Of course, the first step is to be certain that you are in a bull market. Once you know for sure, buy Monday's opening — risk half the range of the previous trading day; price objective is 80% of the three-week average weekly range.
If the previous week had a higher high; higher low; and close above the open, mid-range, and previous week's close, then use this strategy. This is even better on Monday with a lower opening that does not violate the previous day's low, since it should retrace back to the previous close a high percentage of the time. Monday's price action should ideally exceed Friday's or the last week's high. If this happens and Tuesday or any following day makes new intra-week lows, then a short term reversal has occurred.
Watch to see if the new intra-week low closes below the previous intra-week low for confirmation. Tuesday is technically known as "the reversal day," so watch its afternoon price action carefully. Tuesday's relationship to Monday's range points to the direction of the remaining weekly range. Many technicians buy the S&P on early Monday morning weakness to sell a rally on Tuesday afternoon.
Of course, you have to check this technique to see if it is working now in the markets you want to trade.
The majority of traders end up losing their accounts. Why? There are many factors that go into becoming a successful trading that most traders don't even consider.
Marco answers the question "How did Ambush make it through the BREXIT" and includes the latest Ambush perfomance in his blog post. He is also giving 20% off of Ambush through July 13th. Enter the coupon code ambush20 when you check out. Enjoy! If you have any questions, feel free to This email address is being protected from spambots. You need JavaScript enabled to view it., or post it in our Blog or Forum.
Experience AlgoStrats.com today! Marco Mayer's (Systematic and Forex Expert) newest development. AlgoStrats:FX Free Trials will start this month, stay tuned! Follow Marco on Facebook and Twitter.
To view previous published Chart Scan newsletters, please log in or click on "Join Us,"
shown above, to subscribe to our free "Members Only" section.
A WEALTH OF INFORMATION & EDUCATION:
Joe Ross-Trading Educators' popular free Chart Scan Newsletter has been published since 2004.
Note: Unless otherwise noted, all charts used in Chart Scan commentary were created
by using Genesis Financial Technologies' Trade Navigator (with permission).
Legal Notice and Copyright 2016 Disclaimer - Published by Trading Educators, Inc.
Chart Scan is a complimentary educational newsletter.
"If you are going to trade, try to learn something about everything and everything about something." ~ Joe Ross
The Law of Charts with Commentary
by Master Trader Joe Ross
Author, Trader, Trading Mentor, and Founder of Trading Educators, Inc.
Trading Range
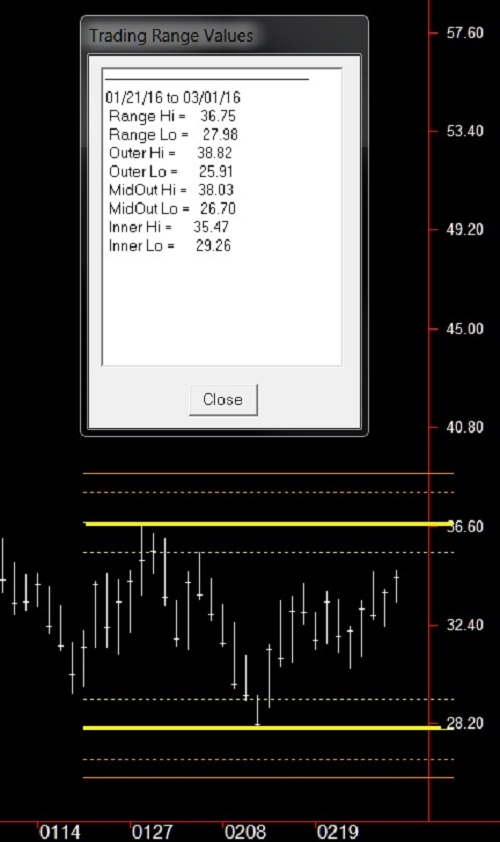
The chart below shows a typical trading range on the crude oil chart. The range shown was defined in my manuscript “Trading by the Book.”
Let´s take a look at the various horizontal lines you see on the chart, which form a trading envelope.
The high and low of the range are defined by the bright yellow bars. The high is set at 36.75, and the low at 27.98.
The dotted white lines above and below the yellow range lines are set at a fixed distance .146 above the low of the range (29.26), and below the high of the range (35.47). These form an inner envelope. Prices that enter into the inner envelope have a high propensity to bounce and move opposite to the direction from which they came.
The dotted orange lines below (26.70), and above (38.03) the yellow range lines are set at a fixed distance .146 outside of the range, and form an intermediate external envelope. Prices that enter into the intermediate envelope offer a warning to be cautious of a possible breakout coming.
The solid orange lines above and below the yellow range lines are set at fixed distance .236 above the range high at (38.82), and below the low at (25.91). These form the outer limits of the trading envelope. If prices violate the outer limits of the envelope, prices are probably trending, and will have formed a 1-2-3 high or low within the envelope, and possibly have formed a Ross Hook as well.
The trading envelope has proven to be excellent for trading option boxes, and for trading within the general limits of the envelope.
by Master Trader Joe Ross
Author, Trader, Trading Mentor, and Founder of Trading Educators, Inc.
When trading the markets, uncertainty is often a fact of life. Consider the plight of Jack who tried to add as much certainty into his trading as possible. He decided to invest in a solid retailer. Consumer confidence was high and sales had been high at the retail stores for the past two years. He looked closely at the five-year chart and noticed a clear, upward trend. When the price did temporarily drop, the most it had ever fallen in the past five years was about $3. It was currently trading at $40. He decided to buy 2000 shares and protected himself by placing a stop at $37. He reasoned that the past five years would be a good indicator of what might happen in the next year: the stock price should continue to rise and should only fall by $3 at the most.
There was something psychologically pleasing about studying the fundamentals of the company and its past stock performance. He felt assured. Even though his risk was almost 8% of his trading capital, he decided the risk was worth the reward.
Unfortunately, history only repeats itself when it does. A month after entering the trade, the stock price fell to $35. Jack couldn't believe what happened. He thought, "How could I have been so wrong? I had considered all possibilities." Many novice traders think like Jack. They seek out a level of consistency in the financial markets that just does not exist. They believe that the markets follow natural laws and falsely believe that there are some magical mathematical principles that underlie it all. Big time institutional investors may be able to forecast the market action in the long term, but they have mountains of capital and can attempt to hedge risk, and even they have great difficulty merely matching the yearly increases of the indexes. For the smaller investor or trader, there are no secret mathematical formulas. The past is the past, and what happened in the past may not forecast the future.
Don't falsely think that you can forecast market action with the same precision a physicist can program a satellite to reach Mars. The markets don't follow natural laws. There are many unknown factors that underlie the price action. The best you can do is study all available information and make an educated guess. As long as you manage risk, you can make trade after trade and get the odds to work in your favor. You won't be right all the time, but you'll be right enough of the time to make a profit. It may be pleasing to think that you can add certainty to trading, but you can't. You'll feel better in the long run and trade more profitably if you accept the fact that the future is uncertain.
Whether you are a long-term investor or a short-term trader, you might be looking through reams of information, such as charts, analyst commentaries, and financial statements, to arrive at a wise decision. You may have to sift through it all, weigh it appropriately, and use your intuition to make the most informed decision possible.
Usually, it's merely an educated guess in the end. Traders are hardly objective, logical processors of information. They suffer from what decision-making theorists call confirmation bias. When devising a trading plan, there is strong pressure to reach a decision and implement a plan. The consequences of a wrong decision can be financially disastrous. The added pressure can get to us. Rather than look at each piece of information objectively, we tend to pay closer attention to information that confirms our initial decision while ignoring contrary information.
If you want to make sound trading decisions, you must fight the urge to seek out information that supports your initial expectations. As a basic rule of thumb, when trying to arrive at a sound decision, you should spend most of your time looking for information that goes against your initial hunches than information that confirms it.
Winners learn more from losses than from profits. When a profit is taken, there may be little room for improvement. When a loss is taken, a trader's self-discipline is the first thing to be examined. Read more.
In his new Episode of his Questions & Answers Series, Marco answers the questions you sent in. Including a follow-up question of last week's video related to Pinbars, recommendations on Forex brokers, and why it's so hard to trade successfully on a 5-minute chart. Enjoy! If you have any questions, feel free to This email address is being protected from spambots. You need JavaScript enabled to view it., or post it in our Blog or Forum.
AlgoStrats.com, Marco Mayer's (Systematic and Forex Expert) newest development is live and ready for you to experience it. AlgoStrats:FX Free Trials will start soon in early July, stay tuned! Follow Marco on Facebook and Twitter.
To view previous published Chart Scan newsletters, please log in or click on "Join Us,"
shown above, to subscribe to our free "Members Only" section.
A WEALTH OF INFORMATION & EDUCATION:
Joe Ross-Trading Educators' popular free Chart Scan Newsletter has been published since 2004.
Note: Unless otherwise noted, all charts used in Chart Scan commentary were created
by using Genesis Financial Technologies' Trade Navigator (with permission).
Legal Notice and Copyright 2016 Disclaimer - Published by Trading Educators, Inc.
Chart Scan is a complimentary educational newsletter.
"Teach our students the truth in trading - teach them how to trade,"
and
"Give them a way to earn while they learn - realizing that it takes time to develop a successful trader."
Derivative transactions, including futures, are complex and carry a high degree of risk. They are intended for sophisticated investors and are not suitable for everyone.
There are numerous other factors related to the markets in general or to the implementation of any specific trading program which cannot be
fully accounted for in the preparation of hypothetical performance results, and all of which can adversely affect actual trading results.
For more information, see the Risk Disclosure Statement for Futures and Options.











 Receive daily trade recommendations - we do the research for you!