Trades in Stock Options. Receive daily trade recommendations. Can you imagine discovering a way to trade that promises instant income? If you think such a method is impossible, think again. It is definitely achievable, and everything you need to know is available online for one low price that includes special three-part online webinars.
Ambush is a time-proven mean-reversion day trading System focused on a variety of Futures markets around the globe. With Ambush Signals you can now easily follow the Ambush System on a subscription basis for educational purposes.
If you didn't fail early in your trading business, then you have probably been around long enough to realize that many of the problems you encounter as a trader are those that derive from your own individuality. Such problems are common among traders and, in fact, common among all human beings. Seeking spiritual help from a power much greater than your own is the area I address in the "Spiritual Side of Trading".
Joe Ross' "Money Master Plus" webinar is scheduled for June 25th at 10:00 a.m. to 1:00 p.m., US CST. This informative, wealth building, and motivating three hour webinar is led by a master trader who has gained invaluable knowledge and techniques by trading over 50 years within all markets. Become a "Master" of your money and learn a way to trade with no losses. Let us put you on a money making path that will greatly change your life. Don't wait another minute and sign up today!
Marco Mayer, Systematic and Forex Expert, is proud to announce that his newest development is live and ready for you to experience it. Traders, we invite you to visit AlgoStrats.com. AlgoStrats:FX Free Trials will start soon in early July, stay tuned!
The Law of Charts with Commentary
by Master Trader Joe Ross
Author, Trader, Trading Mentor, and Founder of Trading Educators, Inc.
Market Manipulation
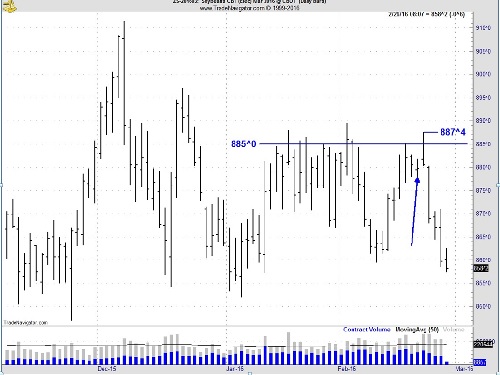
The chart below was sent in by one of our students. It showed a manipulation in March Soybeans.
March Soybeans had been struggling to get above the $8.85 level for quite some time, so it is reasonable to assume that a fair number of buy stops had accumulated just above that level. The day marked with an arrow, was options expiration day. When the market closed that day, there were eight thousand 880 puts that expired 1 ¾ cents in the money. This probably wasn’t nearly enough to recover the premium that was paid for them, and the person that wrote them had been working his tail off to make sure of it. The put owner decided to just let them expire instead of exercising his right to sell the position at 880. The Trade took notice, and took this as a very bullish sign, as can be seen by the gap open the following Monday. With all of the buy orders accumulated up above, both traders were easily able to liquidate their longs at a higher price and get short for the subsequent move down. Did they plan this move together, or was it mere chance that both sides were able to profit? Always remember that there are people out there with the ability to push the market around, and they will do so at every opportunity.
by Master Trader Joe Ross
Author, Trader, Trading Mentor, and Founder of Trading Educators, Inc.
After carefully studying the fundamentals of a tech stock, Jack decided to buy 1,000 shares at $60 a share. After a recent product announcement it traded at $64. Although it was higher than he had preferred, he felt it was still a good investment and figured he might as well buy at the higher price before it went even higher.
As is often the case after a product announcement jump in prices, prices fell to $60 a share a few days later. Jack started to kick himself, "Why couldn't I wait. I knew it would fall. I should have waited. I could have saved $4,000." Jack plans to hold the position for six months and he still thinks the stock has the potential to hit $70, but he can't seem to stop berating himself for buying too soon and spending an extra $4,000. His feelings are understandable, but it's distractions like these that often throw traders off target. It's vital to continue to focus on your trading plan and not be stifled by self-reproach.
Depending on your personality, you may be prone to kick yourself for making trading mistakes. In Jack's case, he may have bought a stock at a higher price than he had hoped, but it isn't a disaster. According to his trading plan, he can reach his objective of selling at $70 in six months, and making $6,000 as he had anticipated. Many traders have a tendency to be perfectionists. They can't stop obsessing about how they could have entered and exited a trade more skillfully.
Striving for high ideals is noble, but when it distracts you from focusing on your ongoing experience, it can be detrimental. For example, if Jack continues to berate himself for buying too high on this trade, he may not be able to focus on studying the next trade and developing a sound, new trading plan. He may also feel less spontaneous and creative. His mind may become filled with self-doubt and his thinking may become clouded. Striving for perfection can be much more of a distraction than a benefit in the long term.
At times of self-reproach, it's essential to talk yourself out of it. It's necessary to move from a mental state that concerns obsessing about errors to a calm, focused mindset concerned with thinking creatively. Although they may sound trite, repeating a few common sayings about trading the markets may be quite helpful: "I'm going to trade my plan and stick with it." "I'm going to go where the markets take me." "I'm a mere mortal; I can't control the markets." "I need to accept the fact that I'm human and may make mistakes."
You don't have to trade perfectly. You just have to trade profitably. Put a single trade in perspective. It's just one trade of the many trades you will make in your lifetime. You may lose or you may win, but the outcome of a single trade does not matter. What matters are your overall profits across a series of trades, not just a single trade. Rather than beat yourself up for minor mistakes, stay on target. You may make a mistake here and there, but it's all right. All traders make mistakes.
The majority of traders might think it would be impossible to trade in an "ego-less state", but this is not the case. To trade in an ego-less state means simply to not let the ego and emotions get involved. While trading in an ego-less state, winning or losing on a single trade become almost meaningless when the focus lies only on the whole picture. Read more.
In his new video, Marco talks about some of the most common pitfalls when doing manual backtesting. So if you ever wondered why your actual trading results don't match with the manual backtest you did, this is for you! If you have any questions, feel free to This email address is being protected from spambots. You need JavaScript enabled to view it., or post it in our Blog or Forum.
To view previous published Chart Scan newsletters, please log in or click on "Join Us,"
shown above, to subscribe to our free "Members Only" section.
A WEALTH OF INFORMATION & EDUCATION:
Joe Ross-Trading Educators' popular free Chart Scan Newsletter has been published since 2004.
Note: Unless otherwise noted, all charts used in Chart Scan commentary were created
by using Genesis Financial Technologies' Trade Navigator (with permission).
Legal Notice and Copyright 2016 Disclaimer - Published by Trading Educators, Inc.
Chart Scan is a complimentary educational newsletter.
Joe Ross sent out a letter earlier this week. In case you missed it, you can read it on his blog and have an opportunity to sign up for his "Money Master Plus" webinar on June 25th (take advantage of the early bird special).
The Law of Charts with Commentary
by Master Trader Joe Ross
Author, Trader, Trading Mentor, and Founder of Trading Educators, Inc.
Sugar Trade
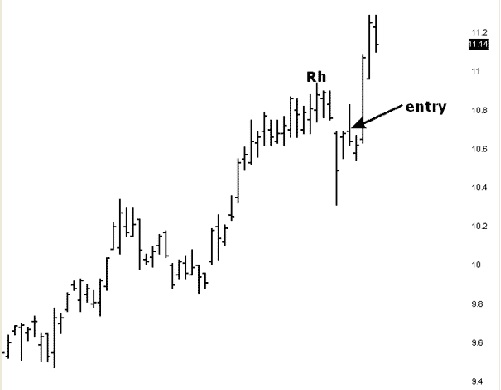
This week we look at a daily sugar chart. We need to learn something here about the Traders Trick Entry (TTE). March Sugar prices reached a high of 10.94 and then retraced for two days. Those two days made identical highs [at 10.90]. Prices then dropped again, and again we had two identical highs [at 10.69]. The TTE rules say that after 4-bars of correction you are no longer to enter a trade based on the TTE. However, the rules also state that when expecting a continuation towards the upside, equal highs count as only one bar of correction (retracement). So, although we have 4-bars in the correction, because of the equal highs we count this as only two bars of correction. Now you can see why we made an entry 1-tick above 10.69. What happened afterwards is of no consequence to the rule I am showing you here. In accordance with your money and trade management, you made a little, or took a loss, or made a lot on this trade. I will tell you only that we made a little. ;-)
by Master Trader Joe Ross
Author, Trader, Trading Mentor, and Founder of Trading Educators, Inc.
Making a profit in the trading world is hardly a sure thing. How you deal with this fact of trading, though, depends on your personality. Some people take risks in stride, while others obsess over them. Which type of person are you - a natural born risk taker, or an obsessive, fearful seeker of safety?
Life is a matter of taking risks, but some people embrace it while others superstitiously try to avoid it. For example, have you ever seen an extremely ineffective car theft device called "The Club?" You are fooled into believing that by putting a massive metal bar on your car's steering wheel, you are protected. It seems it would work, until you realize it takes merely a few minutes to cut the steering wheel with a hacksaw to pull it off. Similarly, why do car stereos have removable faceplates? Do you think thieves are actually unaware that there isn't an expensive stereo beneath a removed faceplate?
These kinds of "protective" devices make us feel better, at least until we realize that they don't work. At that point, we think, "How could I have been so stupid?" That said, feeling protected helps take the edge off. Even if it is just superstitious behavior, like wearing your lucky shirt on the day of a big trade, you feel better when you do it. There's a psychological benefit to it.
We can alleviate some of the uneasiness of taking risks through risk control. By risking a small percentage of your trading capital on a single trade, and looking at the big picture, you will feel more at ease. From a psychological viewpoint, it is to your advantage to make a potential trading loss so insignificant that you may start thinking "Why am I even bothering making this trade?" There is no universal rule for how to limit risk. Some experts suggest risking merely 2% of your capital, while others suggest 5%, and still others suggest using past market action to determine the amount of loss you can afford to take (for example, if the market is bullish with many opportunities for profit, then you can take a little more risk.)
The best way to control risk is to set a protective stop, but whether or not you set a stop loss or how you do it depends on your personality and attitude toward risk. If you are a natural born risk taker, you may not set a formal stop loss at all. You may keep an informal stop loss point in mind, and close your position when the stock price reaches that point. At the other extreme, the obsessive-compulsive worrier trader may set the stop loss too close to the entry price, and end up getting stopped out too early. The middle ground seems to be reasonable for most traders. Again, it depends on your personality, but if you are afraid to take a loss, a stop loss can help. If you don't have a stop loss and hate taking a loss, you may not close out a position when the price falls hard. You may be prone to hope against hope that the trade will turn around, and watch your losses mount as you fail to take action. The stop loss order, however, guarantees that you will be out of the trade should prices move against you.
If you had to describe the best trader in the world, who would that person be? What qualities would he have? Take a moment to envision him. This is important because this is the person you want to be, so you need to have an exact picture of him and what his qualities are. Read more.
In his new video, Marco talks about the major differences between trading Futures and Forex from his point of view. Find out what the advantages and disadvantages of both trading instruments are! If you have any questions, feel free to This email address is being protected from spambots. You need JavaScript enabled to view it., or post it in our Blog or Forum.
To view previous published Chart Scan newsletters, please log in or click on "Join Us,"
shown above, to subscribe to our free "Members Only" section.
A WEALTH OF INFORMATION & EDUCATION:
Joe Ross-Trading Educators' popular free Chart Scan Newsletter has been published since 2004.
Note: Unless otherwise noted, all charts used in Chart Scan commentary were created
by using Genesis Financial Technologies' Trade Navigator (with permission).
Legal Notice and Copyright 2016 Disclaimer - Published by Trading Educators, Inc.
Chart Scan is a complimentary educational newsletter.
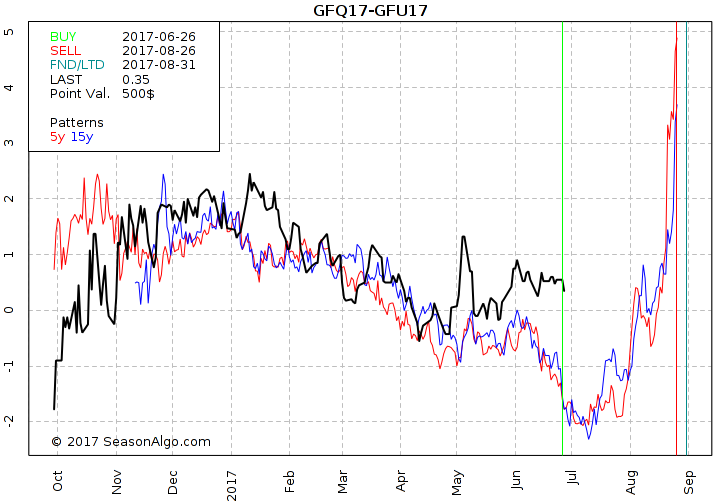
Today I am looking at a market that I don’t like to trade using outrights, but trade regularly with spreads. We are looking at the spread long August and short September Feeder Cattle with a seasonal time window between 06/26 and 08/26. Seasonality looks strong during that time and also the seasonal statistic looks promising. Because the time difference between both legs is very short (only 1 month) the spread is usually not very volatile and therefore the risk per spread contract at the lower range.
Do you want to see how we manage this trade and how to get detailed trading instructions every day? Please visit the following link: Yes, I want additional information!
I was going through my portfolio of past Chart Scans when I came across a chart with a question from one of our students. The chart and my answer to his question are below.
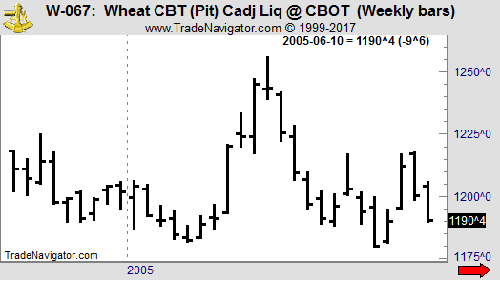
Hey Joe! Wheat seems set to go lower. It has formed a 1-2 with a potential #3 high formation at the end of a swing. If prices end up with a lower high and a lower low next week, the 1-2-3 formation will be complete. Friday’s Close ended the week near the low of the week after having spiked higher earlier in the week. In an odd sort of way, we have a “spike reversal.”
I agree. You could call that a sort of spike reversal, but it seems to me you have already miss the best chance to go short. I took the liberty of marking the chart you sent with the appropriate entry point.
In my opinion, entering 1 tick below of the “spike reversal” would have given you a more certain entry. Entering that way would have you already short based on a Traders Trick Entry.
One of the most important things to learn in this life is how we ourselves behave, not only when we are acting on our own, but when we are part of the crowd. And what few of us understand is how many of our important daily actions are not thought out in advance. We are all attempting to survive in what is basically a hostile environment. Many of our actions are in response to some sort of stimulus, whether someone else’s words, or actions, or something physical like our computer going down while in the midst of a trade. It may be painful to admit, but in much of human behavior we act first and then rationalize what we did later. While we all try to be logical, in most instances the rationalization comes after the fact, if it comes at all, and in general it is not at all close to explaining why we acted in the way we did. It is tough to be honest with ourselves, but honesty with self holds one of the secrets to success. This is nowhere more true than in trading.
Philippe Gautier: Administration and New Developments
Developer: Joe Ross
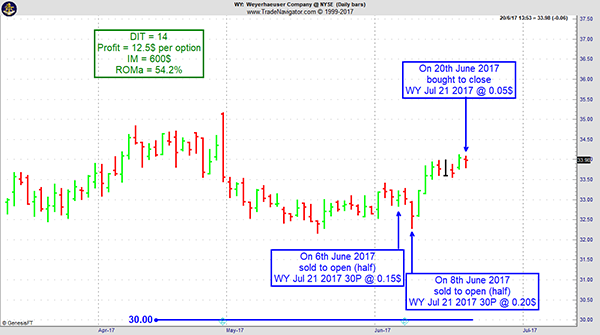
On 6th June 2017 we gave our IIG subscribers the following trade on Weyerhauser Company (WY), the stock being close to weekly and daily support zones. We decided to sell price insurance as follows:
On 6th June 2017, we sold to open WY Jul 21 2017 30P @ $0.15, with 45 days until expiration and our short strike 10% below price action for half of our position.
On a GTC order, on 8th jun 2017, we sold to open WY JuL 21, 2017 30p @ $0.20.
On 20th June 2017, we bought to close WY Jul 21, 2017 30P @ $0.05, after only 14 days in the trade, for quick premium compounding.
Profit: $12.5 per option
Margin: $600
Return on Margin Annualized: 54.32%
We have also added new types of trades for our IIG daily guidance since 2016, "no loss" propositions with unlimited upside potential, still using other people's money to trade.
Ambush just won’t stop making new equity highs in many markets, including the E-Mini S&P 500 this year.
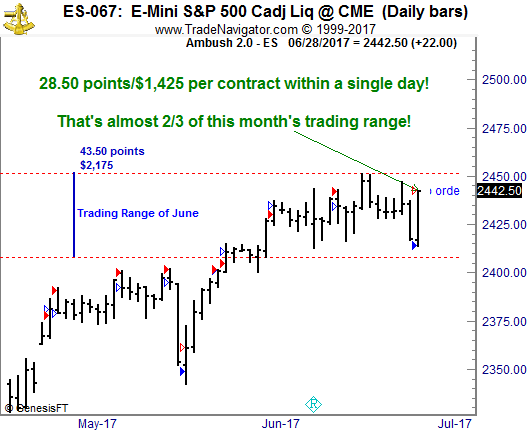
And so it just happened again yesterday when Ambush Traders totally dominated the E-Mini S&P 500. You have to see THIS trade for yourself:
Let’s put this into perspective. June’s trading range (Difference between the highest high and the lowest low of the whole month so far) in the ES was about 43 1/2 points.
The Ambush trade you can see on the chart is 28 1/2 points. Yesterday, within just one day Ambush traders made almost 2/3 of the whole months trading range! That’s $1,425 with a single day trade!
That’s insane and honestly makes most day/swing/position traders who sit in front of their charts all day long getting in and out of the market look like fools.
Just think of most day traders sitting there all day long trying to scalp a point or two out of the E-Mini. Want to know what the result of their efforts is at the end of the trading day? Red eyes and hardly any trading profits due to the trading costs, a happy broker thankful for the commissions and if the high-frequency trading robots could laugh, they would!
Now compare that to the Ambush traders who just placed their orders at the market open and went to the beach! Relaxed eyes, hardly any commissions and about $1400 profits at the end of the day…
Want to become an Ambush Trader too?
Then simply sign up to Ambush Signals. It does all the work for you, allows you to customize what markets you want to see and has a position sizing tool implemented to automatically adjust the positions to your risk preferences.
Each day around 6:30 PM NY Time (yes, it's ready much earlier now than before) the Signals are available for you on the Dashboard. You can then place your orders and literally walk away until the markets close! Can you imagine a more comfortable way to day trade?
To view previous published Chart Scan newsletters, please log in or click on "Join Us,"
shown above, to subscribe to our free "Members Only" section.
A WEALTH OF INFORMATION & EDUCATION:
Joe Ross-Trading Educators' popular free Chart Scan Newsletter has been published since 2004.
Note: Unless otherwise noted, all charts used in Chart Scan commentary were created
by using Genesis Financial Technologies' Trade Navigator (with permission).
Legal Notice and Copyright 2017 Disclaimer - Published by Trading Educators, Inc.
Chart Scan is a complimentary educational newsletter.
There are any number of reasons why a trader hesitates before a trade. The main one is lack of planning. Without a plan, there is no degree of confidence a trade will be successful, it’s all wishful thinking. Unless they are outright gamblers, traders usually have a strong need to protect their assets and avoid risk. This is especially true for beginning traders. It can take a long time to build up sufficient capital for serious trading. By that I mean sufficient capital to be able to trade for a living. It is quite understandable to fear losing all or part of your initial capital. Beginners tend to seek absolute certainty before taking a risk, and gaining true confidence in you ability to trade successfully can take time.
When it comes to short term trading, there isn't very much time for long deliberations. Market conditions are in continuous flux. Decisions need to be made relatively quickly, and if one waits too long to execute a trade, he or she may miss a significant opportunity. The reasons for hesitation are everywhere, and traders must be aware of them, and create a plan to prevent them.
Do you hesitate before a trade?
If so, Traders Notebook might help to overcome your fear to pull the trigger. With Traders Notebook you receive detailed trading recommendations for futures spreads, options, and outright trades on a daily basis with an excellent performance over many, many years.
We just made new equity highs with our spreads and options trading in Traders Notebook and we are on the best way to reach even higher levels this year.
And the best thing of all: you can start futures trading even with a small account of only $10k to $15k and build up your trading account slowly.
Click here to take advantage of our 30% off promotion!
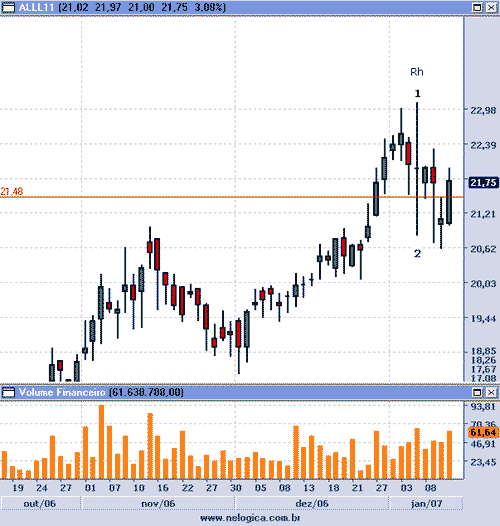
I have shown you how it was that a #1 and a #2 point could both occur on the same bar. This week I am revisiting that chart with some additional information.
In my book Trading Optures and Futions I wrote that one of the ways to know when prices are in consolidation is through the observation of a measuring bar.
One of my students, who lives in Brazil, was kind enough to send this chart. The doji bar labeled 1-2 is a measuring bar. What it demonstrates is that we have consolidation when: following the measuring bar we have at least four opens, four closes, or both, all falling within the range of the measuring bar. On the chart above we see that as of the time I received the chart, prices were in consolidation for 8 days.
Another characteristic of consolidation is found when prices have formed both a 1-2-3 high formation followed by a 1-2-3 (I, II, IIIon the chart) low. The Law of Charts dictates that when prices are in consolidation, the trader should AVOID taking Traders Tricks ahead of the breakout of a #2 point. The reason is that the expectation from a 1-2-3 formation is some sort of consolidation.
Master Traders develop a style that is a reflection of their education and character. Most individual trading styles are either positional or combinational and, rarely, a synthesis of both. However, there are other styles.
Positional traders take x amount of positions within a specific price area where the market is thought to be favorable to their trading strategy. This may occur on short term weakness when the longer trends are bullish. A known risk is assumed for a specific profit taking area. Positions remain until the losses or profits are taken or the price action analysis negates the trading strategy.
Combinational traders do not have the patience of positional traders, and want immediate profitable results or will exit the market quickly. These traders add additional orders as the market moves their way, building up large positions for fast two- to six-day price moves, then take profits and exit the market.
A third type of trader is a system trader, who adheres to a trading system discipline.
A fourth type of trader is the method trader. Methods differ from systems in that a method can be traded either as a system with no discretion, or traded with discretionary intervention. A method allows for a trader to be able to change parameters. A method gives full-disclosure of all its parameters and the logic behind the method. It should be realized that both systems and methods are based not so much upon a rationale as they are upon pure statistics, i.e., when a certain setup or pattern occurs, and you behave in a certain way, the result is statistically in accordance with the probable outcome.
The complete trader is able to combine all or parts of the above approaches with his own style. Trading mastery combines observation, scientific knowledge, good judgment, intuition, and creative instincts with decisive action.
Philippe Gautier: Administration and New Developments
Developer: Joe Ross
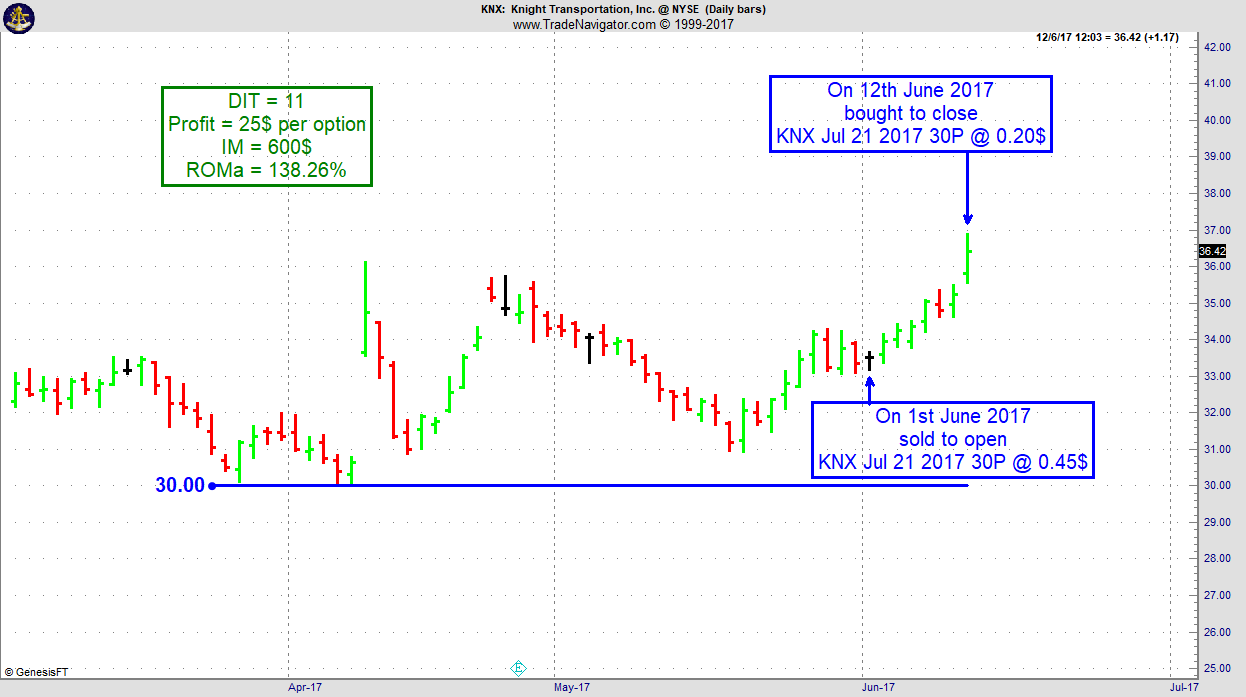
On 31st May 2017 we gave our IIG subscribers the following trade on Host Marriott Trust (KNX). We decided to sell price insurance as follows:
On 1st June 2017, we sold to open KNX Jul 21 2017 30P @ $0.45, with 50 days until expiration and our short strike 10% below price action.
On 12th June 2017, we bought to close KNX Jul 21 2017 30P @ $0.20, after only 11 days in the trade, for quick premium compounding.
Profit: $25 per option
Margin: $600
Return on Margin Annualized: 138.26%
We have also added new types of trades for our IIG daily guidance since 2016, "no loss" propositions with unlimited upside potential, still using other people's money to trade.
In this video, Marco talks about some of the most common pitfalls when doing manual backtesting. So if you ever wondered why your actual trading results don't match with the manual backtest you did, this is for you!
To view previous published Chart Scan newsletters, please log in or click on "Join Us,"
shown above, to subscribe to our free "Members Only" section.
A WEALTH OF INFORMATION & EDUCATION:
Joe Ross-Trading Educators' popular free Chart Scan Newsletter has been published since 2004.
Note: Unless otherwise noted, all charts used in Chart Scan commentary were created
by using Genesis Financial Technologies' Trade Navigator (with permission).
Legal Notice and Copyright 2017 Disclaimer - Published by Trading Educators, Inc.
Chart Scan is a complimentary educational newsletter.
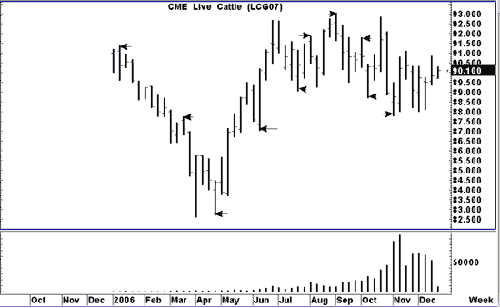
It is extremely important to pay attention to what you see. In the past I’ve written about anticipatory trading, and in this issue of Chart Scan I want to show you more about what I mean. The Law of Charts indicates that there will be many orders grouped above or below a weekly high. Since it is the job of the market to fill orders, you can anticipate that either the high or the low will be violated with considerable momentum in order to break through what, on a lesser time frame, will appear to be so-called "support" or "resistance."
Take a close look at the Weekly Live Cattle chart below. The chart is a continuous chart. I rarely bother to adjust my continuous charts, so when the contract month changes you will often see a gap like the one just prior to the last four bars on the chart.
For what I want to show you here, those gaps will not be important. They were important in 2007 and they are important even today.
I’ve drawn an arrow next to each bar that is of interest. What do you see that is "special" about the price bars I’ve pointed out?
I may have missed a few, but be aware that most of the time when one of these special bars occurred, prices moved strongly the following week in a direction opposite of the way they had been previously going. What is most interesting about these bars is what happens on the following bar, the one representing the next week’s price action.
The bars I have pointed out can occur whenever a new local high or low has been made. By local, I mean recent, not necessarily an all-time high or low, or even a contract high or low. Now, have I revealed to you the holy grail of turning points in the market?
No! I have merely pointed out "reversal bars." These are bars that make a new high, and close lower than they opened when a market has been moving up, or make a new low, and close higher than they opened when a market has been moving down. Such bars create an immediate or even longer term pivot point in the market.
Interestingly, when these occur on a weekly chart in Live Cattle, the following week sees a continuation of the price action in the direction of the reversal. Better yet is to see one of these reversals take place in conjunction with a seasonal entry signal.
Now go back and check that chart again. If you can’t see a way to make money on reversal bar anticipation, you should close out your account and use your margin money to purchase a seeing eye dog. When the reversal fails to follow through the next week, there is seldom anything to worry about. You simply are not able to get into the market, or you sustain a small loss if you are not able to watch.
Here’s another way to use the simple fact of a reversal bar, and a way that I regularly do use them.
Whenever I am holding a position in a trade, I tighten my profit protecting stops as soon as a reversal bar occurs or is in the making. I either protect a portion of my profits, or I move my stop to within one tick of the extreme of the reversal bar.
If you want to do something profitable right now, pick up your charts and see what would have happened to you in any market, in any time frame, simply using the concept of the reversal bar to get into a trade and to get out of a trade. However, there is a serious caution in the lesser time frames. In a trading range, you will find that the price bars will reverse every other bar or every two bars. In most cases you will not be able to obtain a trade using the technique as an entry signal, because prices will not continue in the direction of the reversal.
The best results will be found when prices begin to trend. How will you know when prices are beginning to trend? You will cease getting alternating reversal bars.
You might also want to look at previous issues of the Monthly Report to see if any of the reversal bars took place in conjunction with a seasonal entry signal. I looked a little way back and found that the Live Cattle contract reversed during the week of 3-27-96. The report called for a seasonal short trade entry on that date. The report also called for a seasonal short trade on 4-11-96 in the June Live Cattle contract, and sure enough, that week there was a reversal.
But I don't want to have all the fun, so I'll leave a few for you to do as research. Don't tell me you just sit in front of your screen all day and watch the markets. Heavens! You really ought to do some research, shouldn’t you???
"I thought that I’d pass on something that you might want to share with your trading community. I spent way too long thinking that range bars and/or tick bars were my way to the holy grail and I would like to tell you what I realized and why I think I was wrong."
"First some background: I got started down that path, because wasn’t seeing formations on the x minute charts with what I thought was adequate frequency. This all got started a few years ago and I haven’t gone back to look at those charts. Maybe it was just a slow period or maybe I misinterpreted what I needed to see. Regardless, in my attempt to find a solution, I looked at range and tick charts. You’ll probably remember that I came to Austin and showed the range charts to you and you agreed that they showed trades clearly. Tick charts showed different things, but they make beautiful TLOC formations."
"The fatal flaw is time coupled with charting inaccuracies. The time aspect is that the TLOC formations that one sees on those charts are fantastic, but they are impossible to manage in live trading. The challenge is that the beautiful formation that you see on a historical chart can take 30 minutes or 30 seconds to form. Therefore, you either fall asleep before the formation completes itself or you don’t have time to get the order placed. In addition, the tick change shape completely sometimes when Trade Navigator corrects or recalculates the data. It doesn’t happen often, but enough to cause a problem: a formation would look one way during live trading and then after the nightly update, it would look similar, but different enough to change how I would have traded it."
"Another aspect is that when trading those charts, you must be "on" 100% of the time that you are trading, because you never know how long it will be before a tradeable formation happens. With time charts, you know that you have a few minutes while the bar completes, so you can unplug from time to time."
"I don’t know why I didn’t figure this out sooner."
"I went back to minutes and there’s plenty of action, so I’m back in business. The tick charts seem like they might be useful to see inside a reversal bar, but not on their own. You might have already put this somewhere in a blog post, but I wanted to pass on my experience."
Limit Offer!
Further your education with "The Law of Charts In-Depth" Recorded Webinar and use coupon code during checkout, Take50 to receive 50% off your purchase (offer is good until 6/19/2017).
Through this recorded webinar The Law of Charts, we will show how YOU how to win consistently in any market and in any time frame. What it takes to create charts that exactly fit your trading style and level of comfort. The content of this intensive, in-depth recorded webinar takes the "The Law of Charts" to the next step. You'll feel like your attending a private seminar with Joe Ross himself. Don't miss out, use coupon code during checkout, Take50 to receive 50% off!
Philippe Gautier: Administration and New Developments
Developer: Joe Ross
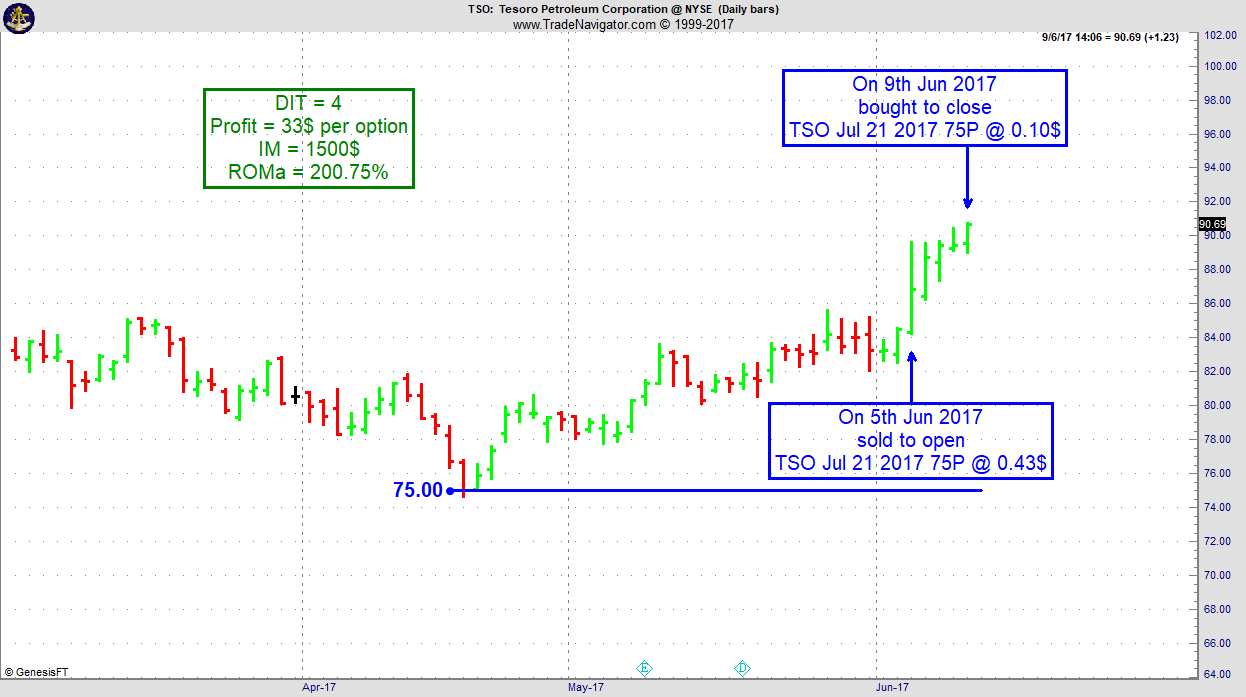
On 4th June 2017 we gave our IIG subscribers the following trade on Tesoro Petroleum Corporation (TSO). We decided to sell price insurance as follows:
On 5th June 2017, we sold to open TSO Jul 21, 2017 75P @ $0.43, with 46 days until expiration and our short strike 11% below price action
On 9th June 2017, we bought to close TSO Jul 21, 2017 75P @ $0.10, after only 4 days in the trade, for quick premium compounding.
Profit: $33 per option
Margin: $1,500
Return on Margin Annualized: 200.75%
We have also added new types of trades for our IIG daily guidance since 2016, "no loss" propositions with unlimited upside potential, still using other people's money to trade.
In this Q&A series, Marco answers a follow-up question related to Pinbars, gives recommendations on Forex brokers and talks about why it's so hard to trade successfully on a 5-minute chart. Enjoy!
To view previous published Chart Scan newsletters, please log in or click on "Join Us,"
shown above, to subscribe to our free "Members Only" section.
A WEALTH OF INFORMATION & EDUCATION:
Joe Ross-Trading Educators' popular free Chart Scan Newsletter has been published since 2004.
Note: Unless otherwise noted, all charts used in Chart Scan commentary were created
by using Genesis Financial Technologies' Trade Navigator (with permission).
Legal Notice and Copyright 2017 Disclaimer - Published by Trading Educators, Inc.
Chart Scan is a complimentary educational newsletter.
"Teach our students the truth in trading - teach them how to trade,"
and
"Give them a way to earn while they learn - realizing that it takes time to develop a successful trader."
Derivative transactions, including futures, are complex and carry a high degree of risk. They are intended for sophisticated investors and are not suitable for everyone.
There are numerous other factors related to the markets in general or to the implementation of any specific trading program which cannot be
fully accounted for in the preparation of hypothetical performance results, and all of which can adversely affect actual trading results.
For more information, see the Risk Disclosure Statement for Futures and Options.