Trades in Stock Options. Receive daily trade recommendations. Can you imagine discovering a way to trade that promises instant income? If you think such a method is impossible, think again. It is definitely achievable, and everything you need to know is available online for one low price that includes special three-part online webinars.
Ambush is a time-proven mean-reversion day trading System focused on a variety of Futures markets around the globe. With Ambush Signals you can now easily follow the Ambush System on a subscription basis for educational purposes.
If you didn't fail early in your trading business, then you have probably been around long enough to realize that many of the problems you encounter as a trader are those that derive from your own individuality. Such problems are common among traders and, in fact, common among all human beings. Seeking spiritual help from a power much greater than your own is the area I address in the "Spiritual Side of Trading".
Let's be real. How many times have you encountered failed promises to "get rich quick" with your trading, and have taken huge hits to your bank account? Well, you won't find that here. Our philosophy is very clear and concise:
"Teach our students the truth in trading - teach them how to trade," and "Give them a way to earn while they learn - realizing that it takes TIME to develop a successful trader."
Invest in yourself today! Private tutoring is available with any of our three professional traders. Ask them the difficult questions, revise your trading plan, or whatever you feel that needs extra attention taking you to your next level of trading.
The Law of Charts with Commentary
by Master Trader Joe Ross
Author, Trader, Trading Mentor, and Founder of Trading Educators, Inc.
Trading Tops and Bottoms
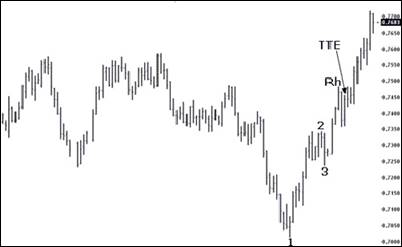
How do you trade markets that form "V" bottoms, or for that matter, "A" tops. The method I usually follow causes me to miss the first part of the move, but I feel that with "V" bottoms and "A" tops it is better to be safe than sorry. Typically, when prices form sharply-turned bottoms and tops, the move is considerable once it becomes established. Such was the case shown on the chart below. I've pointed out on the chart the way my method would allow me entry into the trade. It follows the rules for the Law of Charts. The Law states that the breakout of the #2 point of a 1-2-3 low defines a trend; a breakout of a Ross Hook establishes a trend.
Prices formed a potential #2 point at .7342. The pattern then corrected, but not enough to establish the #2 point. A #2 point by definition requires both a lower high and a lower low to form before a #2 point is in effect. Prices moved to .7343 where, by definition of both a lower low and a lower high following the move to .7343, there was a defined #2 point. Prices then made a higher low and a higher high, putting into effect the #3 point. Two bars later, a Ross hook was formed when prices failed to move higher. A Traders Trick Entry was in effect at .7459, leaving plenty of room to cover costs and take a profit. The rest is history, and it seemed that prices would soon arrive at .8000.
by Master Trader Joe Ross
Author, Trader, Trading Mentor, and Founder of Trading Educators, Inc.
A reader asks: "Hey Joe! I’m pretty new at this. Can you tell me the rules for buy and sell stops?"
When the market trades above (“trades through”) a buy stop price order, it becomes a market order. The first down tick after the market order price is activated determines the highest price at which the buy stop order may be filled. The rule to remember placing stops is this, "Buy above and sell below." Buy stops are placed above the current market price, and sell stops are placed below the current market price. If a buy stop price is hit, the order then becomes a market order to be filled electronically or by the floor broker at the best price possible. If a buy stop is hit at 40, and the market trades 40, 45, 50, then 45, the worst fill a trader can receive is a 50, because 45 is the first down tick. In general, you must expect to get the worst fill possible. Anything better is a bonus. The exception to this rule is a fast market condition, when no one is legally held to any price.
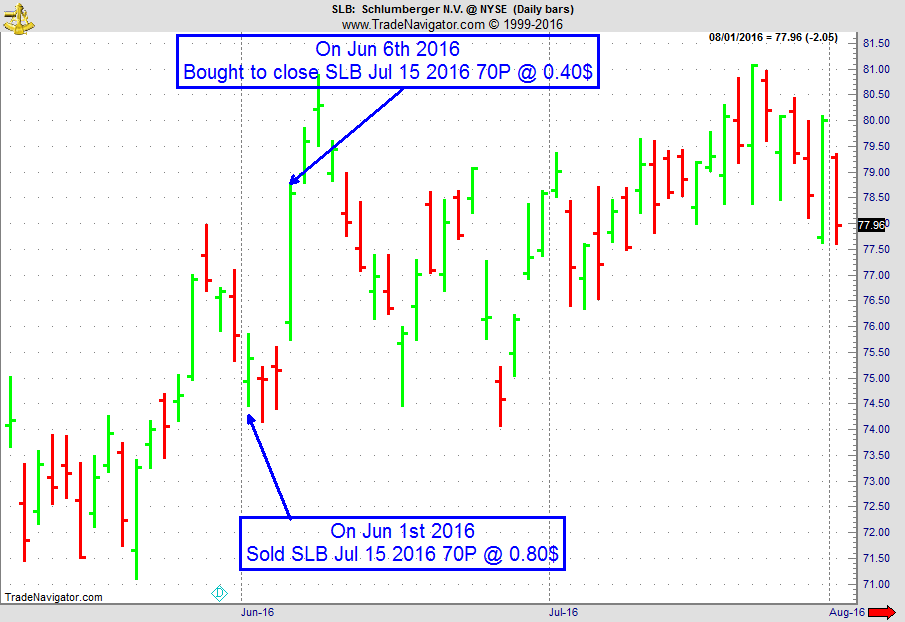
On 31st May 2016, we gave our IIG subscribers the following trade on SLB, which was showing accumulation on a pullback. We decided to sell price insurance as follows the following day:
On 1st June 2016, we sold to open SLB Jul 15 2016 70P @ $0.80, i.e. $80 per option sold, with 44 days to expiration, and our short strike below a major support zone.
On 6th June 2016, we bought to close SLB Jul 15 2016 70P @ $0.40, after 6 days in the trade, for quick premium compounding.
Profit: $40
Margin: $1,400
Return on Margin Annualized: 208.57%
We have also added new types of trades for our IIG daily guidance, "no loss" propositions with unlimited upside potential, still using other people's money to trade.
This includes a daily 80+ page report along with a daily podcast!
We review and supply the following:
our daily fills (entries, exits)
full real-time statistics of our weekly trades, closed trades for the current month, monthly statistics (detail and summary) since the beginning of IIG
daily market commentary (indices/sectors, volatility indices, main commodities related to our trade)
new trades for the following day
comments on our open trades, with all relevant news
updated earnings dates for our open positions
full details (days in trade, days to expiration, underlying close and price change, etc.) on our open trades (classic trades, complex positions, remaining rolled trades and covered calls)
active good till cancelled orders
dividends for the stocks owned
We also supply quite a number of extra "slides" in the appendix which are quite useful for new subscribers: recommendations, answers and explanations on the most frequent questions, techniques for entering trades, historical trades and real life examples, broker information, etc.
If you are interested in outright futures short term swing trading, you should check out our new service Traders Notebook Outrights.
Traders Notebook Outright Guide explains the Outright trading service from Trading Educators. It shows you around on the Outright Campus and how to use the information provided by the service.
You pay a price for every profit you take with time and effort required to obtain it. Not to mention the years of experience upon which your knowledge and system methodology have...read more.
This Tuesday, we'll have another Federal Open Market Committee (FOMC) day. Whenever the FOMC meets and releases its rate decision and its statement, it’s seen as one of the most important data releases in the markets in the currency markets. But is it really such a market mover? What kind of moves can we actually expect on such a day? Well, let's find out and look at some statistics! Read more.
To view previous published Chart Scan newsletters, please log in or click on "Join Us,"
shown above, to subscribe to our free "Members Only" section.
A WEALTH OF INFORMATION & EDUCATION:
Joe Ross-Trading Educators' popular free Chart Scan Newsletter has been published since 2004.
Note: Unless otherwise noted, all charts used in Chart Scan commentary were created
by using Genesis Financial Technologies' Trade Navigator (with permission).
Legal Notice and Copyright 2016 Disclaimer - Published by Trading Educators, Inc.
Chart Scan is a complimentary educational newsletter.
by Master Trader Joe Ross
Author, Trader, Trading Mentor, and Founder of Trading Educators, Inc.
Where’s the Ledge?
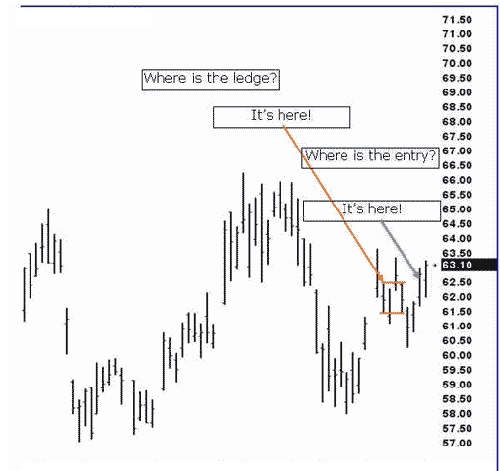
I received a chart with a question: "Where is the ledge?" Below you see the chart with the ledge as I drew it. In order to understand the concept, you have to know how a ledge is defined within The Law of Charts. A ledge comes when prices are trending or swinging. It consists of 4 to 10 bars and has two matching or close to matching highs and two matching or close to matching lows. There must be at least 1 price bar between each of the matches. In the case below there were two bars between the matches. Entry is made when prices breakout in the direction of the most recent swing or trend. Entry was 1-tick above the high of the ledge as shown by the dark arrow. The swing in this case was up from approximately 58.00 to between 63.50-64.00.
"Have you ever felt as if the more you know, the less you know, and the more you become confused? Why is this?"
by Master Trader Joe Ross
Author, Trader, Trading Mentor, and Founder of Trading Educators, Inc.
People have the tendency to believe that the accuracy of their forecasts increases with more information. This is the illusion of knowledge – that more information increases your knowledge about something and improves your decisions. However, this is not always the case. Increased levels of information do not necessarily lead to greater knowledge. There are three reasons for this. First, some information does not help us make predictions and can even mislead us. Second, many people may not have the training, experience, or skills to interpret the information. And, finally, people tend to interpret new information as confirmation of their prior beliefs.
Let me give you an example of how too much information can lead to a paralysis of confusion.
I met a man who was an avid student of the teachings of W.D. Gann. Gann believed in the movement of prices along a 45 degree angle. He also believed that time intervals of 3, 5, 9, and others had great importance. So the man I knew created moving averages of 3-bars, 5-bars, 9-bars and multiples thereof. Of course, 3 x 9 equals 27 and so he kept 27 bar moving averages. 5 x 9 is 45, and so he also kept 45 bar moving averages. He also watched 135-bar moving averages (3x45) and others. He looked for agreement among all of these moving averages, which of course, led to great confusion, since it was rare indeed and most likely coincidental when all of the moving averages showed some sort of agreement (confluence). So this man suffered greatly from paralysis of analysis. He simply had too much information, and he was unable to pull the trigger on a trade.
I will never forget the statement he made to me: “Joe, I know so much. Why then is it that I never seem to be making money?”
I think from the above description you should be able to figure it out, just as I did.
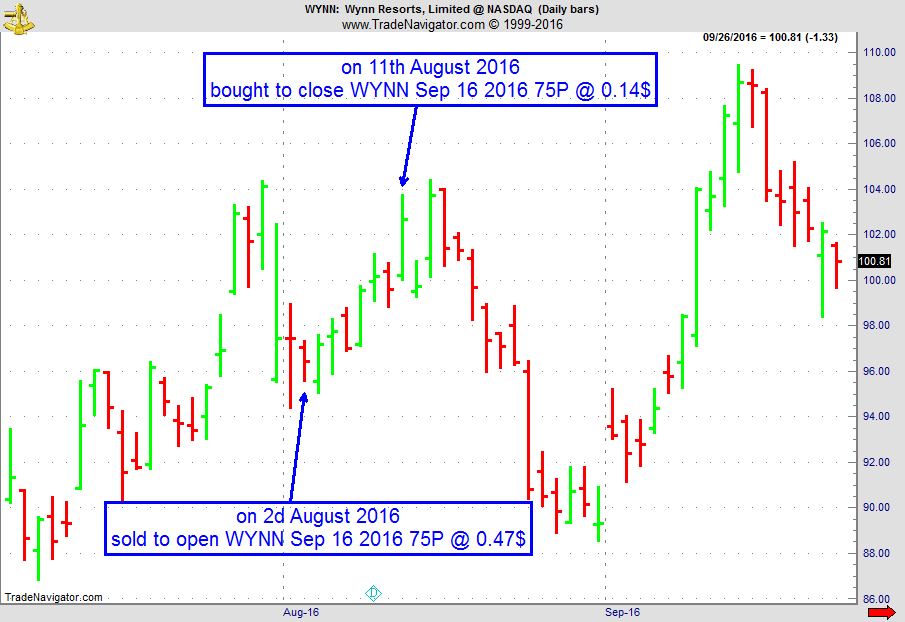
On 1st August 2016, we gave our IIG subscribers the following trade on WYNN, which was showing accumulation on a pullback. We decided to sell price insurance as follows the following day:
On 2nd August 2016, we sold to open WYNN Sep 16 2016 75P @ $0.47, i.e. $47 per option sold, with 44 days to expiration, and our short strike 23% below price levels when we gave the trade, making it pretty safe.
On 11th August 2016, we bought to close WYNN Sep 16 2016 75P @ $0.14, after 9 days in the trade, for quick premium compounding.
Profit: $33
Margin: $1,500
Return on Margin Annualized: 89.22%
We have also added new types of trades for our IIG daily guidance, "no loss" propositions with unlimited upside potential, still using other people's money to trade.
This includes a daily 80+ page report along with a daily podcast!
We review and supply the following:
our daily fills (entries, exits)
full real-time statistics of our weekly trades, closed trades for the current month, monthly statistics (detail and summary) since the beginning of IIG
daily market commentary (indices/sectors, volatility indices, main commodities related to our trade)
new trades for the following day
comments on our open trades, with all relevant news
updated earnings dates for our open positions
full details (days in trade, days to expiration, underlying close and price change, etc.) on our open trades (classic trades, complex positions, remaining rolled trades and covered calls)
active good till cancelled orders
dividends for the stocks owned
We also supply quite a number of extra "slides" in the appendix which are quite useful for new subscribers: recommendations, answers and explanations on the most frequent questions, techniques for entering trades, historical trades and real life examples, broker information, etc.
Once in a while I stumble over a nice article, video or any other source of information about trading on the internet that I would like to share with all of you.
I found this video a long time ago and honestly, I like it a lot. It is fun to watch and the rules mentioned in the video are very simple to follow, and explains what a trader really needs. I’ve tried many different ways in trading, but I always coming back to the simple things because this is what works best for me. Using a simple strategy does not allow me to “doubt” on my entries. I do not have to re-think where to enter, where to put my stop, and where to take profits. For me, simple is GOOD.
If you are interested in outright futures short term swing trading, you should check out our new service Traders Notebook Outrights.
Traders Notebook Outright Guide explains the Outright trading service from Trading Educators. It shows you around on the Outright Campus and how to use the information provided by the service.
To view previous published Chart Scan newsletters, please log in or click on "Join Us,"
shown above, to subscribe to our free "Members Only" section.
A WEALTH OF INFORMATION & EDUCATION:
Joe Ross-Trading Educators' popular free Chart Scan Newsletter has been published since 2004.
Note: Unless otherwise noted, all charts used in Chart Scan commentary were created
by using Genesis Financial Technologies' Trade Navigator (with permission).
Legal Notice and Copyright 2016 Disclaimer - Published by Trading Educators, Inc.
Chart Scan is a complimentary educational newsletter.
Don't be alone on your trading journey. We are here for you. Let us educate, guide, and improve your existing trading style. If you're new to the business, then you have found the right place!
The Law of Charts with Commentary
by Master Trader Joe Ross
Author, Trader, Trading Mentor, and Founder of Trading Educators, Inc.
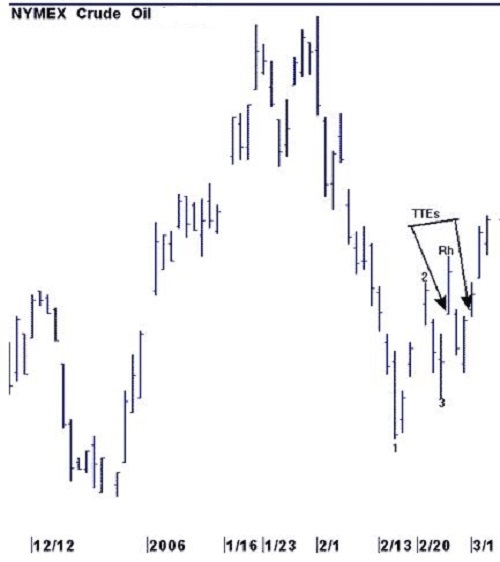
CRUDE OIL
At the time I wrote this issue of Chart Scan crude oil was leaping higher. Where it will be by the time you get this issue of Chart Scan, I have no idea, but it's a good example.
The question I received was, "Is it okay to take gap open entries on Traders Tricks?" The only honest answer is take a look at the market to see if they usually work in that particular market. Based on what we can see on the crude oil chart, I would have to say it's worth taking a shot at it. Surely on both TT entries there was plenty of room to cover costs and take a profit. Both entries filled my requirement that I get paid to trade, and get a free trade while I'm at it.
Here are two ways to know when prices are getting ready to break out from a trading range.
by Master Trader Joe Ross
Author, Trader, Trading Mentor, and Founder of Trading Educators, Inc.
When prices are in a trading range, count the number of closes above or below a specific price near the vertical mid-level of the trading range. If 70% of the closes are above the mid-level price, and the market cannot rally and close above reaction highs, a severe correction may be imminent. If prices break and cannot close below reaction lows, expect a rally to carry prices above the reaction highs. E.g. Let’s assume that a futures chart is showing that about 90% of the Closes are above 445.00, yet prices cannot Close above 455.00. If prices finally do Close above 455.00, a strong buy signal would then be in place.
Another way to determine that prices are about to break out of a trading range is to note if you have a 1-2-3 followed by a Ross hook within the trading range. If both are present, the percentages favor a breakout to follow, and entry by way of a TTE is acceptable.
A 1-2-3 formation followed by a Ross hook is a consistent objective chart pattern for defining that a trend or swing is in process. Once the point of the Ross hook has been violated, this pattern is enough to establish that a trend or swing does exist.
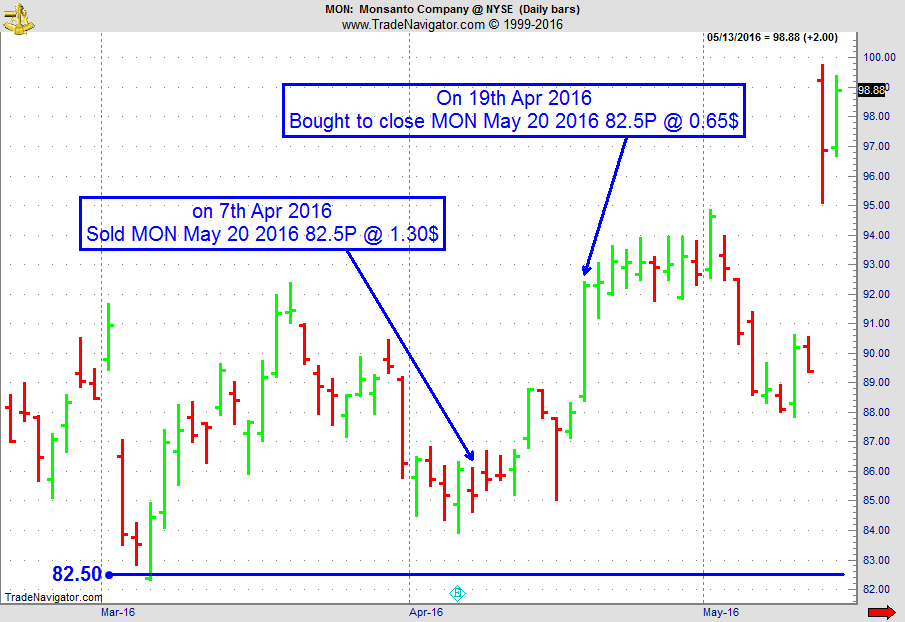
On 6th April 2016 we gave our IIG subscribers the following trade on MON, which showed high premium with short strikes above support levels and buying activity. We decided to sell price insurance as follows the following day:
On 7th April 2016, we sold to open MON May 20 2016 82.5P @ $1.30, i.e. $130 per option sold, with 43 days to expiration, and our short strike right at a major support level;
On 19th April 2016, we bought to close MON May 20 2016 82.5P @ $0.65, after 12 days in the trade, for quick premium compounding.
Profit: $65
Margin: $1,650
Return on Margin Annualized: 119.82%
We have also added new types of trades for our IIG daily guidance, "no loss" propositions with unlimited upside potential, still using other people's money to trade.
This includes a daily 80+ page report along with a daily podcast!
We review and supply the following:
our daily fills (entries, exits)
full real-time statistics of our weekly trades, closed trades for the current month, monthly statistics (detail and summary) since the beginning of IIG
daily market commentary (indices/sectors, volatility indices, main commodities related to our trade)
new trades for the following day
comments on our open trades, with all relevant news
updated earnings dates for our open positions
full details (days in trade, days to expiration, underlying close and price change, etc.) on our open trades (classic trades, complex positions, remaining rolled trades and covered calls)
active good till cancelled orders
dividends for the stocks owned
We also supply quite a number of extra "slides" in the appendix which are quite useful for new subscribers: recommendations, answers and explanations on the most frequent questions, techniques for entering trades, historical trades and real life examples, broker information, etc.
Trading is nothing more than a long, random statistical run. An experienced trader knows that even if he is in a losing streak right now, as long as he sticks to his already approved trading plan, he will come out a winner in the long run. Read more.
If you are interested in outright futures short term swing trading, you should check out our new service Traders Notebook Outrights.
Traders Notebook Outright Guide explains the Outright trading service from Trading Educators. It shows you around on the Outright Campus and how to use the information provided by the service.
In his new video Marco talks about why he believes Entry Signals are the most important aspect of a trading strategy. He then shows you how he likes to "prototype"-test entry signals and why it's important to do so.
To view previous published Chart Scan newsletters, please log in or click on "Join Us,"
shown above, to subscribe to our free "Members Only" section.
A WEALTH OF INFORMATION & EDUCATION:
Joe Ross-Trading Educators' popular free Chart Scan Newsletter has been published since 2004.
Note: Unless otherwise noted, all charts used in Chart Scan commentary were created
by using Genesis Financial Technologies' Trade Navigator (with permission).
Legal Notice and Copyright 2016 Disclaimer - Published by Trading Educators, Inc.
Chart Scan is a complimentary educational newsletter.
Experienced traders find time to work and play. If you're not at the level you desire, don't waste another day, contact us for help.
The Law of Charts with Commentary
by Master Trader Joe Ross
Author, Trader, Trading Mentor, and Founder of Trading Educators, Inc.
GAPS
“Hey Joe, I noticed that when I look at older charts as presented in books and historical data, I see a lot of gaps. There doesn’t seem to be so many these days. Can you explain?”
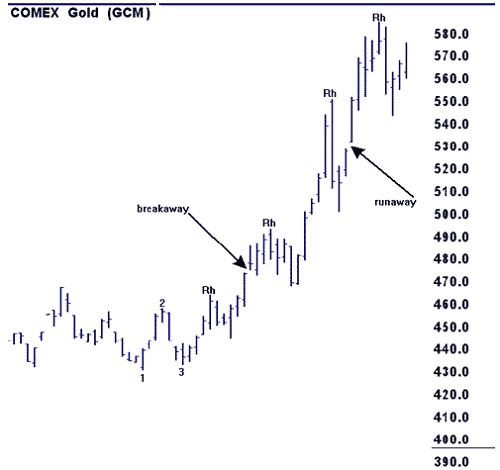
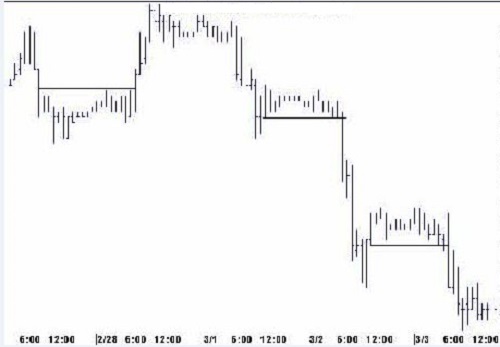
Prior to extended hour trading, prices would have lots of hours between trading sessions. As an example let’s look at a weekly gold chart. Gold traded at the Comex Exchange between the hours of 7:20AM US Central Time and 1:15PM, almost 6 hours.
However, people traded in gold for 24 hours—leaving 18 hours during which gold prices moved. The move in prices was reflected at the Open. There were many gaps, even on weekly charts as shown above. Gaps were so significant they even had names. The first gap out of consolidation was called a “breakaway” gap. If prices continued to rise, the next gap was called a “runaway” gap. At some point prices would make one last effort to move higher. That last effort often resulted in a final gap opening called an “exhaustion gap.”
With extended trading hours it is a rare week that will show any kind of gap at all in a futures market. Daily gaps have also become uncommon. However, daily chart gaps are still frequently seen in the stock market. There is a premarket and an aftermarket in stocks, but not a lot of price movement takes place during those hours.
by Master Trader Joe Ross
Author, Trader, Trading Mentor, and Founder of Trading Educators, Inc.
"I just want to be prepared for the next legal holiday. I’ve been basically a Dow investor for years and now I've begun trading the Dow futures. Do you have any information about the Dow Industrial Average relative to legal holidays in the U.S?"
Thanks to Yale Hirsch’s excellent "Stock Traders Almanac" for the following: “The Dow closes higher before one day holidays 67% of the time, and three day holidays 75% of the time. It closes on Friday greater than Thursday 57% of the time, but when Friday closes weaker than Thursday, it also closes lower on Monday 73% of the time. This study was based over 100 years’ research.”
If anyone knows where you can still get a copy of the almanac, please let me know. I have the above information only in my notes.
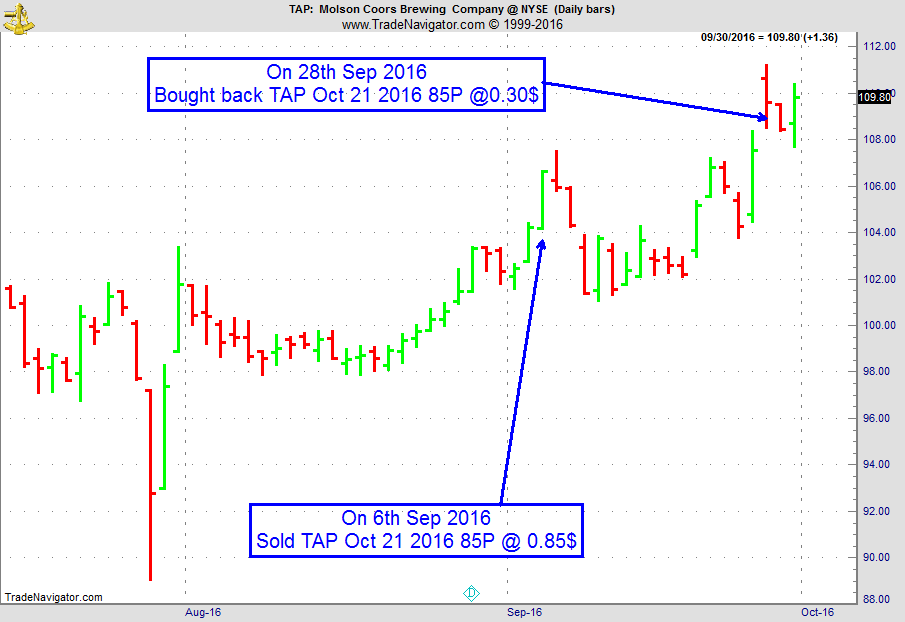
On 5th September 2016, we gave our IIG subscribers the following trade on TAP, which showed high premium levels at distant short strikes in a low volatility environment. We decided to sell price insurance as follows the following day:
On 6th September 2016, we sold TAP October 21 2016 85P @ $0.85, ie. $85 per option sold, with 45 days to expiration, and our short strike 18% below price action;
On 28th September 2016, we bought to close TAP October 21 2016 85P @ $0.30, after 23 days in the trade
Profit: $55
Margin: $1,700
Return on Margin Annualized: 51.34%
We have also added new types of trades for our IIG daily guidance, "no loss" propositions with unlimited upside potential, still using other people's money to trade.
This includes a daily 80+ page report along with a daily podcast!
We review and supply the following:
our daily fills (entries, exits)
full real-time statistics of our weekly trades, closed trades for the current month, monthly statistics (detail and summary) since the beginning of IIG
daily market commentary (indices/sectors, volatility indices, main commodities related to our trade)
new trades for the following day
comments on our open trades, with all relevant news
updated earnings dates for our open positions
full details (days in trade, days to expiration, underlying close and price change, etc.) on our open trades (classic trades, complex positions, remaining rolled trades and covered calls)
active good till cancelled orders
dividends for the stocks owned
We also supply quite a number of extra "slides" in the appendix which are quite useful for new subscribers: recommendations, answers and explanations on the most frequent questions, techniques for entering trades, historical trades and real life examples, broker information, etc.
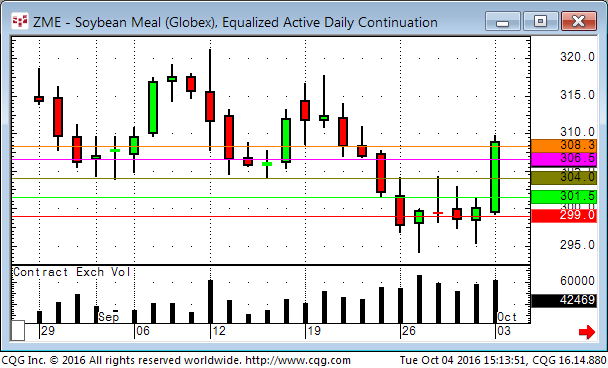
Today I will show you a trade from the other day with our new service. As you can see below, we were looking for a few entries in several markets.
We were filled in the long Soybean Meal trade at 301.5 with an initial stop at 299.0 (the risk was $250 per contract traded). During the overnight session the market moved a bit, but everything was very quiet. At the open of the day session the market moved strongly lower but we were happy of not getting stopped out of the trade. Only ½ hour later the market was back up to our entry level and it climbed higher all day long. We took firsts profit at 304.0, then at 306.4 and finally at 308.3 as you can see on the daily chart below.
If you are interested in outright futures short term swing trading, you should check out our new service Traders Notebook Outrights.
Traders Notebook Outright Guide explains the Outright trading service from Trading Educators. It shows you around on the Outright Campus and how to use the information provided by the service.
In the Forex world, the RUB/MXN cross has become known as the Trump Trade. But is it really? And how would you trade it if your broker doesn't offer that pair? If you'd like to know or ever wondered what synthetic Forex pairs are and how to create them, check out Marco's latest article on our blog! Read more.
To view previous published Chart Scan newsletters, please log in or click on "Join Us,"
shown above, to subscribe to our free "Members Only" section.
A WEALTH OF INFORMATION & EDUCATION:
Joe Ross-Trading Educators' popular free Chart Scan Newsletter has been published since 2004.
Note: Unless otherwise noted, all charts used in Chart Scan commentary were created
by using Genesis Financial Technologies' Trade Navigator (with permission).
Legal Notice and Copyright 2016 Disclaimer - Published by Trading Educators, Inc.
Chart Scan is a complimentary educational newsletter.
“Destruction will come to the Traders of iniquity.” Master Trader Joe Ross
The Law of Charts with Commentary
by Master Trader Joe Ross
Author, Trader, Trading Mentor, and Founder of Trading Educators, Inc.
BOND TRADING
Someone asked me recently, "Can you trade the T-Bonds with cluster breakouts? Can I use the same technique you have in your 'Day Trading' book?"
The answer to the first question is "Yes!" You can trade the T-Bonds with cluster breakouts. The answer to the second question is "No," T-Bonds are a different market with different movement. You would have to make some sort of adjustment to your objectives and to your exit points. In other words, you would have to change your management.
To tell the truth, I've never tried trading T-Bonds on cluster breakouts. Certainly, you would have to do the trading only when T-Bonds were making swings or trends on the daily chart. It would not be something I would try to do every day. I think it would be murder to trade bonds with cluster breakouts when the market was going sideways.
Here's the 60-minute T-Bond chart at a time the daily chart was trending. You be the judge.
by Master Trader Joe Ross
Author, Trader, Trading Mentor, and Founder of Trading Educators, Inc.
I’ve been asked many times: “Is there any meaning in trading? Does it serve a purpose? Does it produce anything of value to anyone?”
Those are good questions, and ones that I have frequently thought about over the years.
When I first began trading futures, a fair number of contracts actually ended up in a delivery — certainly more than we see today. Today only 3% of contracts result in delivery.
The economic and social justification for the futures markets is to provide a venue in which producers and users can hedge against excessive fluctuations in price. Price stability within the economy is seen as a desirable thing, and so it is. In effect, the hedger is seeking price insurance, and the speculator provides the insurance policy.
With hedging as its justification, speculation in futures serves as a way of providing liquidity, efficiency, and price discovery. The speculator serves as the person who is willing to take the risk the hedger wants to avoid. Without that justification, trading futures is nothing more than outright speculation.
Put options in the stock market provide the same thing by enabling an investor insurance against falling stock prices.
However, it is difficult to see how trading from a 1, 3, or 5-minute chart meets the criteria for providing liquidity and price discovery for the hedger. Does a producer or consumer need to hedge for only 1 minute? It is hard to argue on the basis of short-term intraday trading, that anyone is actually providing a social or economic benefit of any kind, other than to another day trader.
Whereas with longer-term trading it is easy to see the social and economic benefits provided by the speculator, or investor, it is virtually impossible to see that such benefits are derived from short-term trading. That renders day trading as nothing more than speculating. To that extent, the markets may have become giant gambling casinos.
That raises a question: What is the difference between the gambler and the speculator? True speculation is based on taking advantage of the realities of the market. Gambling is an attempt at trying one's luck.
Since trading is a business, the business-like speculator is willing to accept the risk of price fluctuation in return for the greater leverage that comes with that risk in the hopes of earning substantial profits. The business-like speculator makes his trading decisions based on knowledge gathered from information about the behavior of the underlying: Research, financial analysis, seasonality, historical and current trends, chart analysis, fundamentals, the market dynamics, and knowledge of those who trade it.
What about the gambler? How does he make his decisions?
The gambler makes his trading decisions on gut feelings, hopes, dreams of getting rich quick, tips from the broker, “inside information” from friends, opinions uttered in the financial news media, and from the improper understanding and use of indicators, oscillators, moving averages, and mechanical trading systems. In general, he is looking for a way to shortcut having to truly learn what is going on. He or she is in a hurry to make money. Unfortunately, most people who attempt to trade fall into this category. Many wannabe traders are gambling, and they don’t even realize it. Anyone who attempts to trade without essential knowledge of what the markets are all about and how they truly function, is gambling.
There is one more aspect to this subject. It has to do with morality. I am often asked if trading goes against the teachings of the Bible. Is it a sin to trade? Is it a sin to speculate in the markets? I have been asked this question numerous times even by church pastors. A friend of mine said it this way: “You did not pay to be born. Life is a gift that was freely given to you. The ways in which you repay God for your life is by using your natural talents to the best of your ability and constantly creating positive change in your life and the lives of others. This quest fulfills the meaning of life, to make the world a better place because you were here. What are your talents and abilities? What is the most important goal in your life? How do you exercise your talent on a regular basis to achieve that goal? How are you creating positive changes in your life and the lives of others? What is the legacy you will leave behind to show mankind that you ever existed? May God bless you and your efforts to become the best person and the most consistently profitable trader you possibly can be!”
In my own life, I use my trading to support a charity which works with the poor, for missionary work, and my local church. I believe that produces both economic and social benefits to the world in which I live.
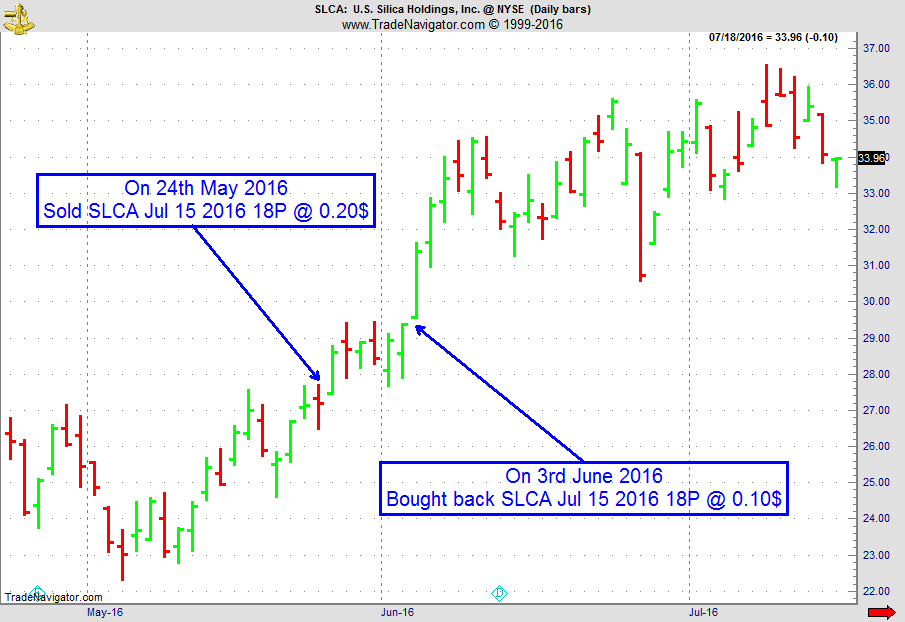
On 23rd May 2016, we gave our IIG subscribers the following trade on SLCA, right after exiting a trade on the same stock. With strong support around $22, we decided to sell price insurance as follows the following day:
On 24th May 2016, we sold SLCA July 15 2016 18P @ $0.20, i.e. $20 per option sold, with 51 days to expiration, and 34% between price action and our short strike (difficult to make a trade any safer).
On 3rd June 2016, we bought back SLCA July 15 2016 18P @ $0.10, after 10 days in the trade, for quick premium compounding.
Profit: $10
Margin: $360
Return on Margin Annualized: 101.39%
We have also added new types of trades for our IIG daily guidance, "no loss" propositions with unlimited upside potential, still using other people's money to trade.
This includes a daily 80+ page report along with a daily podcast!
We review and supply the following:
our daily fills (entries, exits)
full real-time statistics of our weekly trades, closed trades for the current month, monthly statistics (detail and summary) since the beginning of IIG
daily market commentary (indices/sectors, volatility indices, main commodities related to our trade)
new trades for the following day
comments on our open trades, with all relevant news
updated earnings dates for our open positions
full details (days in trade, days to expiration, underlying close and price change, etc.) on our open trades (classic trades, complex positions, remaining rolled trades and covered calls)
active good till cancelled orders
dividends for the stocks owned
We also supply quite a number of extra "slides" in the appendix which are quite useful for new subscribers: recommendations, answers and explanations on the most frequent questions, techniques for entering trades, historical trades and real life examples, broker information, etc.
In his article "Drawdown is the norm, not the exception", Marco writes about why being in a drawdown most of the time is nothing unusual or bad in trading and why it's not a good idea to try to avoid drawdowns altogether. Read more.
Learn all you need to know about AlgoStrats:FX during this presentation by Marco Mayer. What is it, what's the idea behind it, why it is different from other services and how you'd profit from AlgoStrats:FX as a subscriber!
Feel free to email questions to This email address is being protected from spambots. You need JavaScript enabled to view it., or post it in our Blog or Forum. Follow me on Facebook and Twitter!
To view previous published Chart Scan newsletters, please log in or click on "Join Us,"
shown above, to subscribe to our free "Members Only" section.
A WEALTH OF INFORMATION & EDUCATION:
Joe Ross-Trading Educators' popular free Chart Scan Newsletter has been published since 2004.
Note: Unless otherwise noted, all charts used in Chart Scan commentary were created
by using Genesis Financial Technologies' Trade Navigator (with permission).
Legal Notice and Copyright 2016 Disclaimer - Published by Trading Educators, Inc.
Chart Scan is a complimentary educational newsletter.
"Teach our students the truth in trading - teach them how to trade,"
and
"Give them a way to earn while they learn - realizing that it takes time to develop a successful trader."
Derivative transactions, including futures, are complex and carry a high degree of risk. They are intended for sophisticated investors and are not suitable for everyone.
There are numerous other factors related to the markets in general or to the implementation of any specific trading program which cannot be
fully accounted for in the preparation of hypothetical performance results, and all of which can adversely affect actual trading results.
For more information, see the Risk Disclosure Statement for Futures and Options.






 Let's be real. How many times have you encountered failed promises to "get rich quick" with your trading, and have taken huge hits to your bank account? Well, you won't find that here. Our philosophy is very clear and concise: