Trades in Stock Options. Receive daily trade recommendations. Can you imagine discovering a way to trade that promises instant income? If you think such a method is impossible, think again. It is definitely achievable, and everything you need to know is available online for one low price that includes special three-part online webinars.
Ambush is a time-proven mean-reversion day trading System focused on a variety of Futures markets around the globe. With Ambush Signals you can now easily follow the Ambush System on a subscription basis for educational purposes.
If you didn't fail early in your trading business, then you have probably been around long enough to realize that many of the problems you encounter as a trader are those that derive from your own individuality. Such problems are common among traders and, in fact, common among all human beings. Seeking spiritual help from a power much greater than your own is the area I address in the "Spiritual Side of Trading".
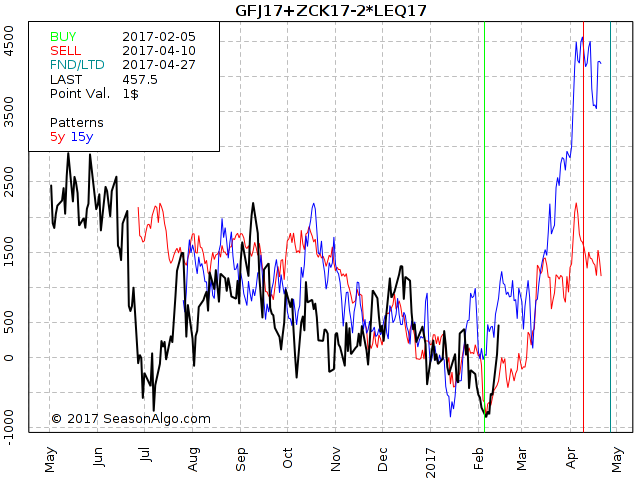
Once again I want to show you a “strange looking” butterfly: Long 1 April Feeder Cattle + 1 May Corn and short 2 August Live Cattle.
As you can see on the chart below the seasonal time window usually opens around February 5 with a close around April 10. Interestingly how precise this spread changed the direction this year. After testing the July low on February 6 it turned around and has been trading higher since then. Maybe it is already too late to enter the spread this year and the spread will not look back. But with these kind of volatile spreads there is always a chance the spread might show some weakness and maybe return to test the break even line again.
If you want to know how we trade this spread in Traders Notebook, please follow the link below.
Traders Notebook Complete had its most profitable year in 2016! Learn how to manage this trade by getting daily detailed trading instructions, click here.
There is a special deal available for the ones new to our Newsletter.
Traders want to trade. That’s what we feel is our job and that’s when we feel that we’re actually really doing something. And I think that’s why it can be so tough to go through periods of low trade frequency. It just somehow doesn’t feel right. Might be missing out on something. For sure the markets keep on moving and others are trading, right?
But feelings are often misleading, especially when it comes to trading. The fact is that to know when to not take a trade is as important as to know when to put on a trade and be active in the markets.
Whatever approach you’re using to trade in the markets, there is always a time when that approach will actually not give you an advantage in the markets.
That’s why most trading systems have some kind of a market regime filter that defines when to actually follow a signal or not. That filter might measure volatility, check if there’s an up- or downtrend going on or look for periods where the market is not trending at all. Other kinds of filters are limiting trading to certain trading hours or specific weekdays or certain regular news events.
Without these filters, without these periods of standing on the sideline and not trading, it’s very hard to make money in the long run. As whatever money you’ve made during the time when the market was in sync with your trading style, you’ll probably give most of it back if you stubbornly keep on trading when the market is not. One exception that comes to my mind is long term trend following where you simply cannot afford to ever miss a trade and where filtering trades can be very expensive.
But in general, knowing when not to trade and then do exactly that is actually an edge. If you keep on trading all the time, you will on average lose money during these periods where you should not trade. And to avoid a losing trade is at the end of the day as good as having a winning trade. The only difference is that it just doesn’t feel that way. Taking a trade and making $1000 feels like you did something, you see that trade on your daily account statement. If you skip a losing trade, you might not even notice that you just saved yourself from a $1000 loss, and it actually doesn’t even show up in your trade history. Still, you now have $1000 more than you would have otherwise. So remember that and be patient during times of low trade frequency.
by Master Trader Joe Ross
Author, Trader, Trading Mentor, and Founder of Trading Educators, Inc.
When you put your money on the line, it's hard to avoid getting a little emotional. Beginning traders may be especially prone to experience a roller-coaster ride of emotions, feeling euphoric after a winning streak, yet disappointed after a string of losses.
How well do you handle emotions? Winning traders control their emotions. They don't let their emotions control them. But emotions don't happen in a vacuum. How emotional you feel depends on the context in which you experience emotions. For example, market conditions matter. When the markets seemed to go up in the late 1990s with no end on the horizon, it was easier to stay calm. But after the bubble burst in 2000, many traders learned how hard trading can become. Take the story of a young trader named Bozo. I spoke with him about once a year for three years. His emotional life changed over time, depending on market conditions and his experience with the markets.
At one point in time, stock prices increased with little resistance. Back then, Bozo saw himself as a relatively unemotional trader. He said, "It takes a lot to shake me up. Even if I do have one of those bad days, it just doesn't hurt that bad because I know that I'll probably make it up." It was easy to stay unemotional back then, but after a while things changed.
I asked Bozo about his emotional life a year later after the market had fallen: "The days that I lose a lot are the days that I am too greedy. Maybe I'll have one bad trade in the morning, then I'll be down, and it is frustrating. And then I'll just want to climb my way out. My worst days always start out like that. Then I'll just dig my hole a little deeper all day long. Those are my worst days. That will usually carry over until at least one more day. By then, though, I realize what I did wrong the day before. I take smaller positions at first and just try to get myself a little bit in the positive. I'm fine if I just end up making four or five hundred bucks that day because I'm just slowly climbing my way out of the hole I dug the day before. I'm not out to recapture my losses in one day." With regard to the previous year, Bozo observed, "I get more frustrated than I used to, obviously just because it didn't used to matter so much when I was making money because I knew that I could make it back."
Bozo continued to be introspective about his emotions. One year later, in 2002, when the markets were relatively flat, I asked him what he observed. "To make me realize whether or not I was emotional, I had to go through hard times with trading. I think it's crazy how the market can take you from a high to a low, and back to a high and then back to a low. You think you've got it all worked out, and then six months later, you're thinking of finding a new job. What I realized is that when I'm doing okay, I'm totally unemotional when it comes to trading, like when a new trading strategy has been working. I just sit there and have a good time. Even if I have a bad trade, it doesn't bother me. But when I was having trouble, like earlier this year and late last year, when I was only able to keep my head barely above water, it was really frustrating. I guess that's when you learn more about how emotional you are when it comes to the market. I'm not the kind of guy who is going to throw my keyboard around, but it definitely has a psychological impact on the rest of my day."
Experienced traders say that trading the markets reveals your true nature. You learn how you react to stress and how you react to failure. Over time, Bozo learned more about his emotional life. He went from thinking he was unemotional to thinking that his emotional life was more complicated and depended on his experience and current market conditions. When asked to summarize his emotional experience, Bozo said, "Obviously, when you're doing better, it's much easier to relax and trade. I now see that I can't say I'm always an unemotional trader. It all depends on how I'm doing. I've heard that if you were to see most successful traders who have been trading for 20 years, you couldn't tell if they had a good day or a bad day. They are supposedly that unemotional. You read that all the time. But I have a hard time believing it. Let's see how they would feel after eight months of losses."
Developer: Joe Ross
Administration and New Developments: Philippe Gautier
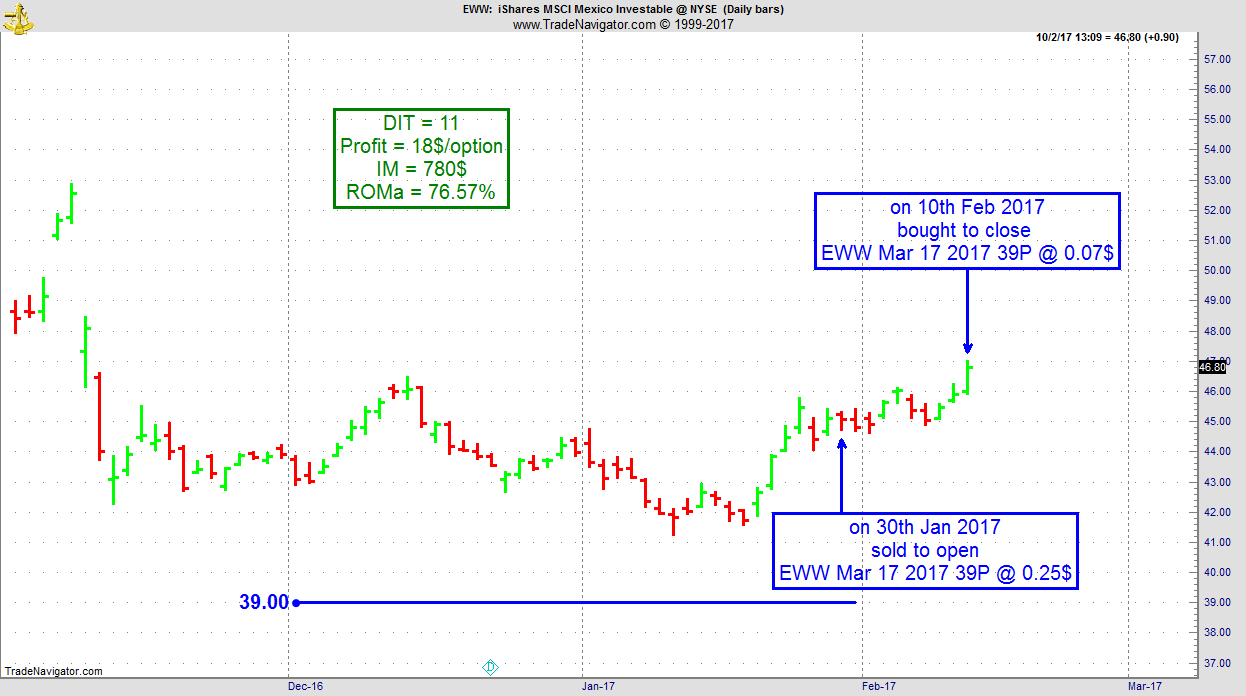
On 29th January 2017 we gave our IIG subscribers the following trade on EWW (iShares MSCI Mexico ETF), which was in an established uptrend on the daily chart. We decided to sell price insurance as follows:
On 30th January 2017, we sold to open EWW Mar 17 2017 39P @ $0.25, ie. $25 per option sold, with 47 days to expiration, and our short strike below a major support zone, about 14% below price action.
On 10th February 2017, we bought to close EWW Mar 17, 2017 39P @ $0.07, after 11 days in the trade, for quick premium compounding.
Profit: $18 per option
Margin: $780
Return on Margin annualized: 76.57%
This trade was pretty safe.
We have also added new types of trades for our IIG daily guidance, "no loss" propositions with unlimited upside potential, still using other people's money to trade.
To view previous published Chart Scan newsletters, please log in or click on "Join Us,"
shown above, to subscribe to our free "Members Only" section.
A WEALTH OF INFORMATION & EDUCATION:
Joe Ross-Trading Educators' popular free Chart Scan Newsletter has been published since 2004.
Note: Unless otherwise noted, all charts used in Chart Scan commentary were created
by using Genesis Financial Technologies' Trade Navigator (with permission).
Legal Notice and Copyright 2017 Disclaimer - Published by Trading Educators, Inc.
Chart Scan is a complimentary educational newsletter.
by Master Trader Joe Ross
Author, Trader, Trading Mentor, and Founder of Trading Educators, Inc.
How much can you risk psychologically, emotionally, and financially before taking a loss that will put you into the fetal position, sucking your thumb in a catatonic state of existence?
Once you know how much risk you can stand to take, you can then begin to consider which time frame you should trade. You must match the risk you are personally willing to take with the amount of risk in the market.
Let’s say you are willing to risk $300 per contract. Does it make sense to risk $300/contract using a monthly chart? How about a weekly or daily chart? Do you see where I’m going with this? You need to choose a time frame in which the average risk/trade is around $300 or less.
How do you determine the amount of risk in the market and time frame you wish to use? There are several ways to do it.
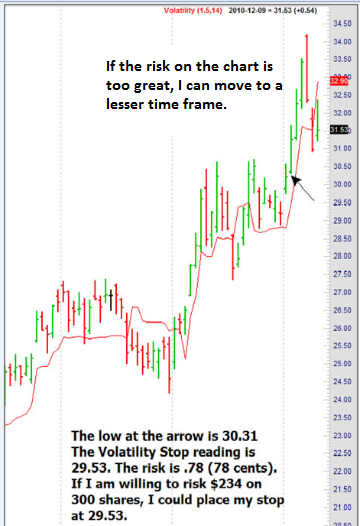
You could use Wilder’s Volatility Stop Study, which would show you graphically where to place the stop. You could curve-fit a moving average to the chart, and then look to see the amount of risk you would be taking if the moving average were to be hit. You could test to see on average how much prices move against you based on the setup you are using.
For example: Let’s say you love to trade outside reversal bars (engulfing reversals for you candle heads). You could go back to look at the last 45 times you had an outside reversal in the market and time frame of your choice, to see on average how much prices move against you after you buy 1 tick (pip) above the high, or after you sell 1 tick (pip) below the low.
The main thing is to match your risk tolerance to the risk in the market. If the risk is too high, move to a shorter time frame. If the risk is too low, move to a greater time frame.
The chart below shows using Wilder’s Volatility Stop.
The chart above is a the price chart of a stock. Of course I can do the same thing with futures, or forex, or even CFDs. I simply move the time frames up or down until I find a match to my risk tolerance. Four bars later, I would have been stopped out of the trade where the risk was 74 cents. So I would have to subtract 74 cents/share from whatever unrealized profit I had in the trade. Actually I made this trade, using a Traders Trick Entry, at a price of 28.38, and exited at 29.53 for a profits of $1.15/share. There is another way I could have done it; those of you who have taken private tutoring or attended one of my seminars should know what else I could have done.
by Master Trader Joe Ross
Author, Trader, Trading Mentor, and Founder of Trading Educators, Inc.
People don't want to be changed. They don't want to be told that they need to change. Do you ever find yourself struggling in those areas? Thank you for your honesty. If there is a struggle, that means there is a battle for truth. If you're not battling, you've already lost. Truth has been lost and deceit has won.
We must come to a place where we are willing to unclothe our soul, ultimately, completely. And it's the hardest battle there is. It's doable. You can do it. Anyone can do it if they want to badly enough. It's doable. It is just that not all people really want it. Not all people are willing to be taught. People come to me all the time, years, I'm talking about decades of seeking success and people will come to me and say to me, "Please mentor me. Help me know how to trade the markets so that I can be profitable. Please mentor me." And in the past I would often say, "Okay. I'll teach what I know, that's all I can give."
But you know what I learned? I learned that people don't want to change. People don't want to be told that they have to change. People resent being corrected. Do you know anyone like that? It's understandable, right? It's not easy to be corrected. Yet experience shows that life as a trader is a life of correction. So whereas you may know people that don't want to be corrected, the fact is, if you are going to trade successfully you are going to have to learn how to receive correction. It's really the hardest part, what I'm giving you right now. It's the hardest part. Everyone wants to think that they are lovable just the way they are, and maybe they are lovable just the way they are but that's not going to necessarily help the real deep things that hide in your soul that will destroy true success. We can't like ourselves too much. Do you understand what I am saying? You know what to do, now do it! That’s a correction, by the way.
What will be your response? Will you turn and walk away?
If a person is rich in their self-love, do not like correction, loves trading, loves markets, and maybe have a great intensity – in the eyes of other traders, that person may be highly prized, but what is hidden deep in the recesses of the heart is “I love who I am, what I am, what I want. I don't like to be corrected. I don't like to be challenged, to be changed. I don't like those kinds of messages.”
How many of you know what that feels like? But the fact of the matter is if you really want success you have to come back to the center and the center has to be changed from pride to humility. When that happens, things inside of you will change. Maybe even some of the old things that are so deep you never thought they could be changed.
If you are not willing to be corrected, if you're not willing to take off the old, how can you put on the new? How can you clothe yourself with the necessary attitude, if you're not willing to change? If you're one of those traders that always has to be right and no one can question you on it no matter how badly it's needed, you'll never have success, not ever.
Developer: Joe Ross
Administration and New Developments: Philippe Gautier
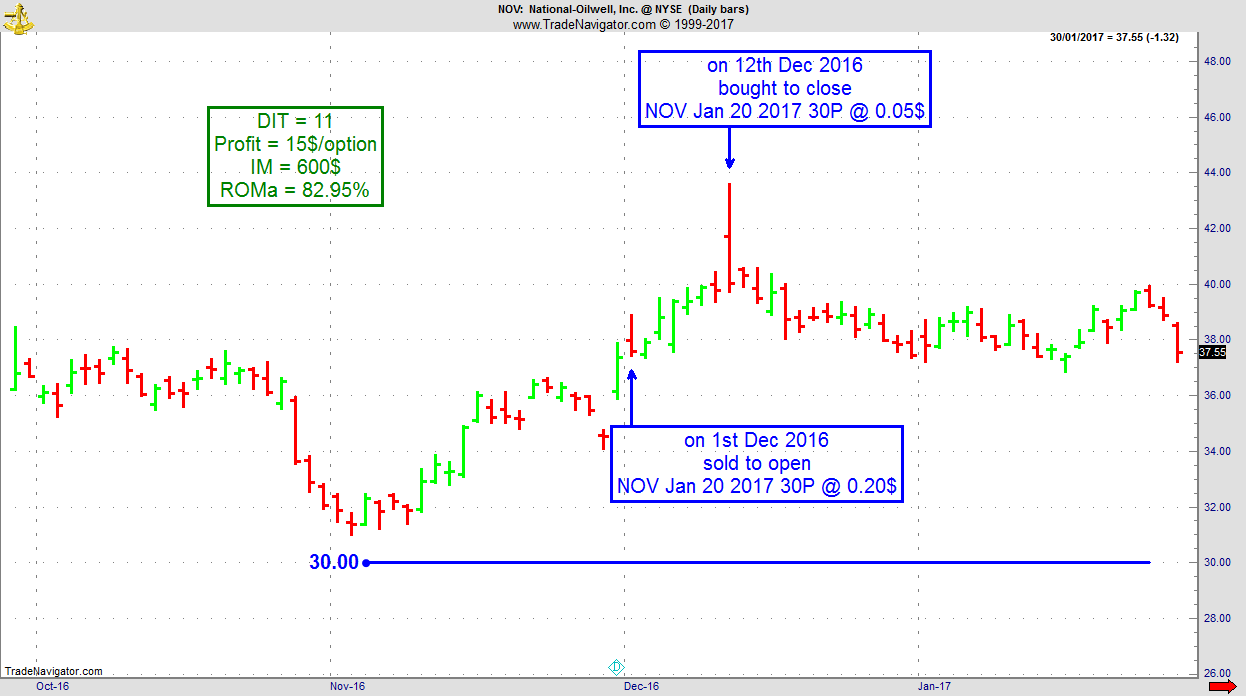
On 30th November 2016, we gave our IIG subscribers the following trade on NOV, which was in an established uptrend on the daily chart. We decided to sell price insurance as follows:
On 1st December 2016, we sold to open NOV Jan 20 2017 30P @ $0.20, i.e. 20$ per option sold, with 49 days to expiration, and our short strike below a major support zone, about 20% below price action.
On 12th December 2016, we bought to close NOV Jan 20 2017 30P @ $0.05, after 11 days in the trade, for quick premium compounding.
Profit: $15 per option
Margin: $600
Return on Margin annualized: 82.95%
This trade was pretty safe in spite of overall very low implied volatility levels.
We have also added new types of trades for our IIG daily guidance, "no loss" propositions with unlimited upside potential, still using other people's money to trade (see recent EWZ example in Newsletter Edition 649).
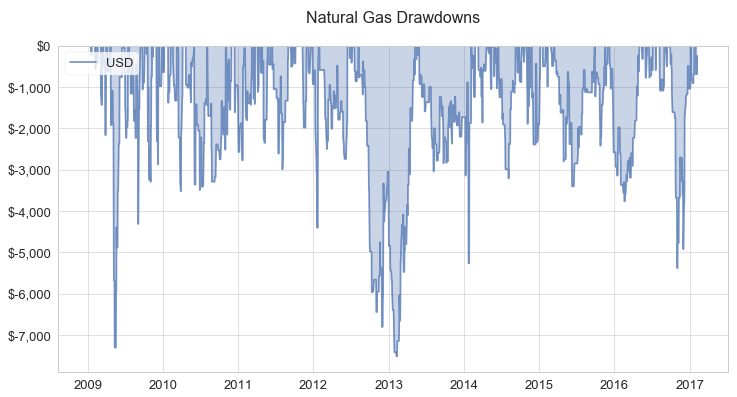
The Natural Gas Future is one of the favorite markets of Ambush Traders. And so for a good reason. Its performance has been very stable over the years and drawdowns tend to get recovered quickly.
But even trading Natural Gas there are times when it can get bumpy trading Ambush. And as we just experienced one of these periods, I thought this might be a good time to have a look at some statistics regarding Drawdowns.
Now Drawdowns are not what traders want to hear or even think about. And this probably isn’t the best way to advertise a product. But it’s a very important one and it’s what you should think about before starting to trade. What can go wrong? What kind of pain will you have to endure? Can you make it through that?
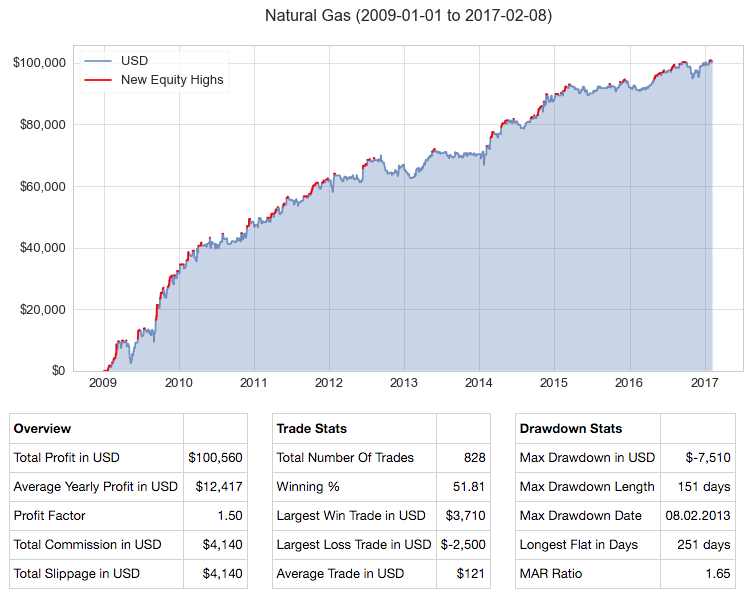
Let’s start with the equity curve. First of all, the results here assume we’re trading one contract all the time, pay $5 commissions per round-turn and get 1/2 tick slippage on any non-limit order.
On the chart every new equity high is marked red and as you can see we just made new all time equity highs in NG. Another thing to notice is that new highs happen quite often compared to other strategies. During 2016 we had a huge draw-up period making lots of new equity highs.
One of the most useful metrics to measure the impact of drawdowns is the MAR Ratio. It takes the average yearly profit (usually compounded in %, in our case, it’s not compounded as we’re always trading 1 contract) and divides it by the maximum drawdown. Which means, the higher the number, the better. If it’s above 1 that’s a good sign, and anything above 1.5 is really good. In our case, we got a MAR Ratio of 1.65, so the average yearly profit ($12.5k) is 1.65 times the maximum drawdown (-$7.5k). Which means to make those $12.5k on average a year, you’d have to endure a drawdown of about -$7.5k sometime in between. Sounds like a very good deal, doesn’t it? If it doesn’t then trading maybe isn’t the right business for you. No pain, no gain.
Now let’s have a more detailed look at the drawdowns:
This gives you a pretty good idea what you’ll have to make it through on a regular basis (up to -$3k drawdowns), sometimes (up to -$5k drawdowns) and the two worst cases that don’t happen often but you better are aware that they could (up to -$7.5k drawdowns).
So what happened at the end of 2016 was ugly, but not that unusual. Also, notice how quickly these drawdowns tend to recover (with the exception of 2013).
Again this is not what most traders want to think about. It’s so much more fun to think about the $12k profits a year per contract! But the day will come when you’ll be much better off to have thought this through. To be prepared when the shit hits the fan, and it will sooner or later. Then this kind of knowledge is what helps you to now throw in the towel at exactly the wrong time, to keep on trading, keep on pushing through and to make it to the next equity highs!
How to reduce drawdowns? The wrong path would be to try and somehow filter out these losing periods. That’s going to work in the backtest, but not in real trading. The best way to reduce drawdowns is to diversify. Trade more than one market. Trade more than one system. That’s what will make that MAR ratio go above 2 and higher.
Happy Trading!
Marco
Become an Ambush Trader today!
Two Easy Ways:
Buy the Ambush eBook and learn all about how the method works and set everything up yourself.
OR
Join Ambush Signals and simply get access to the daily Ambush Signals for all of the supported Futures markets. This way you can follow Ambush without having to go through the hassle of setting up charts, indicators, or taking care of getting the right data and so on.
To develop a trading plan is the key to your trading success. Read more.
Traders Notebook Complete had its most profitable year in 2016! Learn how to manage this trade by getting daily detailed trading instructions, click here.
Andy is offering a FREE 2 Week Trial - Sign up before February 11th Yes, sign me up!
To view previous published Chart Scan newsletters, please log in or click on "Join Us,"
shown above, to subscribe to our free "Members Only" section.
A WEALTH OF INFORMATION & EDUCATION:
Joe Ross-Trading Educators' popular free Chart Scan Newsletter has been published since 2004.
Note: Unless otherwise noted, all charts used in Chart Scan commentary were created
by using Genesis Financial Technologies' Trade Navigator (with permission).
Legal Notice and Copyright 2017 Disclaimer - Published by Trading Educators, Inc.
Chart Scan is a complimentary educational newsletter.
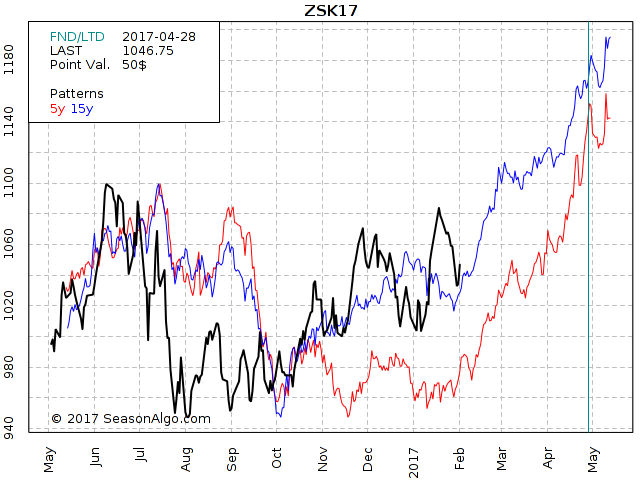
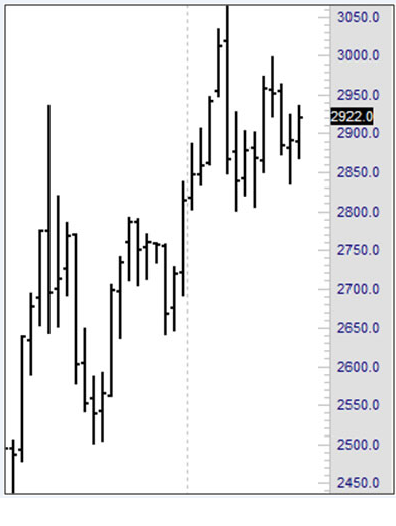
As you can see on the chart below the May 2017 Soybeans are in a long term up-trend since August/September 2016. Both seasonal charts (the blue 15 year and the red 5 year) a looking very strong for the next few months and this might help to drive Soybeans even higher. Therefore, selling May 2017 puts seems to be a good strategy for us as long as the May Soybeans are not dropping below the 1000 level.
Traders Notebook Complete
Learn how to manage this trade by getting daily detailed trading instructions, click here!
Andy is offering a FREE 2 Week Trial - Sign up before February 11th Yes, sign me up!
A fallacy you should be vividly aware of in the trading world is the well-chosen example. This comes in all kinds of forms but the most popular one is to show a single trade or a couple of trades on a chart and point out some really nice winning trades.
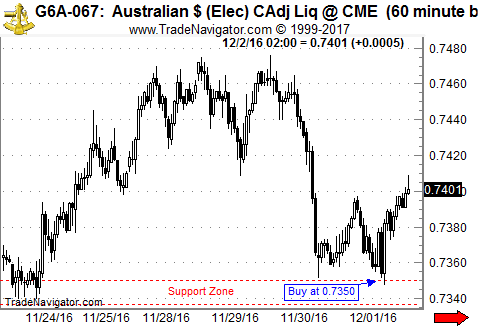
Here's one I ran into a few days ago. This was sent out to promote a trading education service:
So yes that trade really worked out nicely huh? Bought down there right at the bottom, very tight stop and then got a quite nice rally out of it. Took profits of about two times the initial risk!
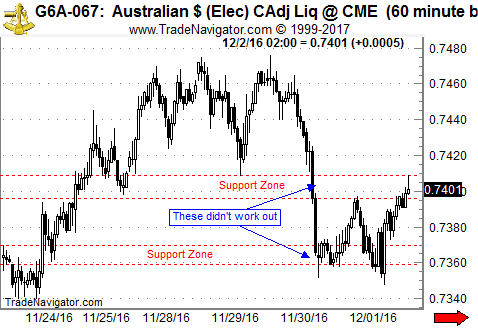
What they didn't show are the other 2 price levels they had suggested. In these cases, the Australian Dollar just traded through the levels:
So actually there’ve been 3 trades on that day with a total result of barely breaking even.
And there’s no problem with this. Doesn’t mean that service or that their strategy is not good or at least somehow useful. What I want to point out here is simply this tendency in the trading industry to show the well-chosen examples. Obviously, that’s simply how marketing works, and there’s nothing wrong with that, just something to be aware of.
Once you’re aware of that you can start asking the right questions: "I’ve seen your sample trade in the Australian Dollar, nice one! Makes me really curious and I’d love to learn more about your performance. Can you send me a record of all the trades you did in this market using that strategy over the last 5 years? Or across all currency markets? If so, please let me know if it does include trading costs (commissions/slippage) and if it is based on real trades or just simulated results?"
If you hear back from them you can start to investigate and get a better idea of their potential edge in the markets. A single chart of an equity curve of 5 years of trading tells you much more than looking at 100 single trade sample charts. If you don’t hear back, you can save your time and move on.
Another popular "trick" of the same fallacy you should be aware of is whenever you see the result of a trading account. Especially if it’s on one of the popular social trading platforms. Might even be a small real money account. The trick goes like this: "Open up 10 accounts and put a couple of positions on one account, but do the opposite on the other one. Go crazy with your risk, doesn’t matter if you blow up an account. Repeat until out of the 10 accounts you’ll just by chance probably have at least one that survived and now looks really great. If not simply repeat starting with 10 new accounts." This works especially well for strategies that use very tight profit targets and no or very wide stops. As the odds of short-term profit are very high here anyway, doing this on multiple accounts you’ll surely have one that shows a very nice equity curve.
What you’ll see on their website is the result of that one account that did really well during the last few months. But you won’t learn about or about what happened to the other 9 accounts.
Marco Mayer has been nominated for the "Forex Best Awards 2017" over at FxStreet.com for his educational Forex content. We are pleased and honored to have him as a part of our trading team and feel he deserves such an Award. This is your chance to show your support for Marco and all the free articles, blog posts and videos he provides on a regular basis. It'll only take a minute, no email or registration required. Go to the following link, https://www.surveymonkey.com/r/forexbestawards2017-Nominees, and if you don't know any of the other guys, just click through using "don't know" until page 4 of the survey. On page 4, select Marco Mayer's article (third on the list) and proceed to page 7 to vote for Marco again, and finish the survey.
Thank you!
Chart Scan - Exiting a Trade
by Master Trader Joe Ross
Author, Trader, Trading Mentor, and Founder of Trading Educators, Inc.
One of the requests made from a Chart Scan subscriber was about exiting from the market. In general, any signal that would cause you to enter a market in one direction should signal you to exit a market if you have entered it from the opposite direction. However, there is often more to it than that.
Let’s say you have held a long position, and you are wondering when or if you should exit. Let’s also say that one of your entry signals is a breakout of support. In other words, had you not been long, and were perhaps waiting for prices to drop, you would sell short if the support line was violated.
There are then things you can do:
You can exit on a Close below support, or, since a violation of support is an entry signal for you, you could reverse your long position and sell short.
There is still another idea to be considered, and that is how long do you want to stay in a trade that is going nowhere? As we look at the chart we see that prices are definitely in a consolidation, which at TE we call congestion (11-20 bars with no real trend). In fact, the last 8 bars have all either opened, closed, or both inside the range of a measuring bar—that large bar that made the high of the recent move.
Might it not be better to take your money out now and wait for further developments? The margin you have tied up in the silver trade could be making you money in a market that is trending. It is a rare occasion that you end up getting every cent of an uptrend from bottom to top.
There is still another consideration which derives from the fundamentals for any market. You have to weigh the costs of getting out now against the costs of not staying in, if you believe that prices will go much higher.
The job of a trader is to make these kinds of decisions. There is still one more thing to consider: how does the trade “feel” to you? Are you comfortable staying in? Or would you be much more comfortable getting out, counting your money, and planning to get back into the market in whichever direction prices actually move.
Trading Article - Searching for a Winning Strategy
by Master Trader Joe Ross
Author, Trader, Trading Mentor, and Founder of Trading Educators, Inc.
Winning traders must identify profitable trading strategies. It's a creative process. Much like scientists find evidence to support a theory, traders must formulate hypotheses and determine whether their proposed strategy can produce a profit. You must sift through a wealth of information, mentally testing and retesting your hypothesis and trying to decide if it will work when the ideal market conditions are present.
In searching for a winning strategy, there comes a point when you start to believe that you're right. At some point, you must stop deliberating whether or not to go with a particular strategy, and make a final decision. But you don't want to jump in too early. On the other hand, you don't want to consider and reconsider your strategy so long that you miss a market move. The key is discerning when to stop deliberating and when to take action.
If you're like many traders, however, you've made your share of bad decisions. Psychologists have studied the thought processes that go into making decisions, such as determining whether a trading strategy will work or fail. It's a two-stage process, according. When evaluating a strategy, there's a point where you start to believe that it is true; in other words, you believe that your view of the markets is accurate and you'll make a profit if you use the strategy. That is the first stage of the decision making process, believing that you are right. The second stage consists of determining whether or not you are actually right. The human mind seems to work in a peculiar way. In order to fully understand and mull over a hypothesis, we must first believe it is true, even if it is actually false. After we accept the hypothesis as true, we then go through a process of thinking and re-thinking the hypothesis before finally deciding if our initial acceptance of the hypothesis was a prudent decision.
For example, if you decided that a product announcement was going to produce a dramatic price increase in a company's stock next week, you first accept that you're right, Stage 1 of the thinking process. By accepting you are right, you build up the motivation to further study your hypothesis and decide if you are in fact right. It makes sense when you think about it. If you thought that your hypothesis was wrong, you would just forget about it and move on. You might see how problems may arise in the way the mind works.
What if you decided your strategy was right, but then stopped deliberating, instead of continuing to question whether or not you made a good decision? If you stop too soon, and avoid Stage 2 of the thinking process, you'll continually jump to the wrong conclusion and erroneously implement unprofitable trading strategies. It's important that you think and rethink the strategy a little while longer. You must play Devil's Advocate and think about what might go wrong. For instance, a product announcement won't lead to a profit if media analysts report that the product will be a dismal failure. You must do a little extra research to decide if there is evidence of an unexpected event that may ruin your plan.
People often forget to fully evaluate their initial decisions. Why? Research studies have shown that when people are under time pressure, or tired and worn out, they do not fully deliberate their decisions. In other words, they engage in Stage 1 thinking, they accept that their hypothesis is true, but they avoid Stage 2 thinking; they assume their initial hunch is right without fully considering evidence that may refute its veracity.
When making a trading decision, fully deliberating your alternatives is essential. You don't want to over-deliberate, but you don't want to be impulsive. Don't rush the decision making process. Slow down, and realize your limitations. When you are overloaded with too much information to sift through, or you are just too tired to think straight, you will make an impulsive judgment. Make sure you are rested and relaxed. By staying psychologically alert, you'll increase the odds of choosing winning trading strategies.
Developer: Joe Ross
Administration and New Developments: Philippe Gautier
With implied volatility at the lowest level since we started IIG daily guidance, it is much more difficult to find safe trades with sufficient premium levels, but it is still possible.
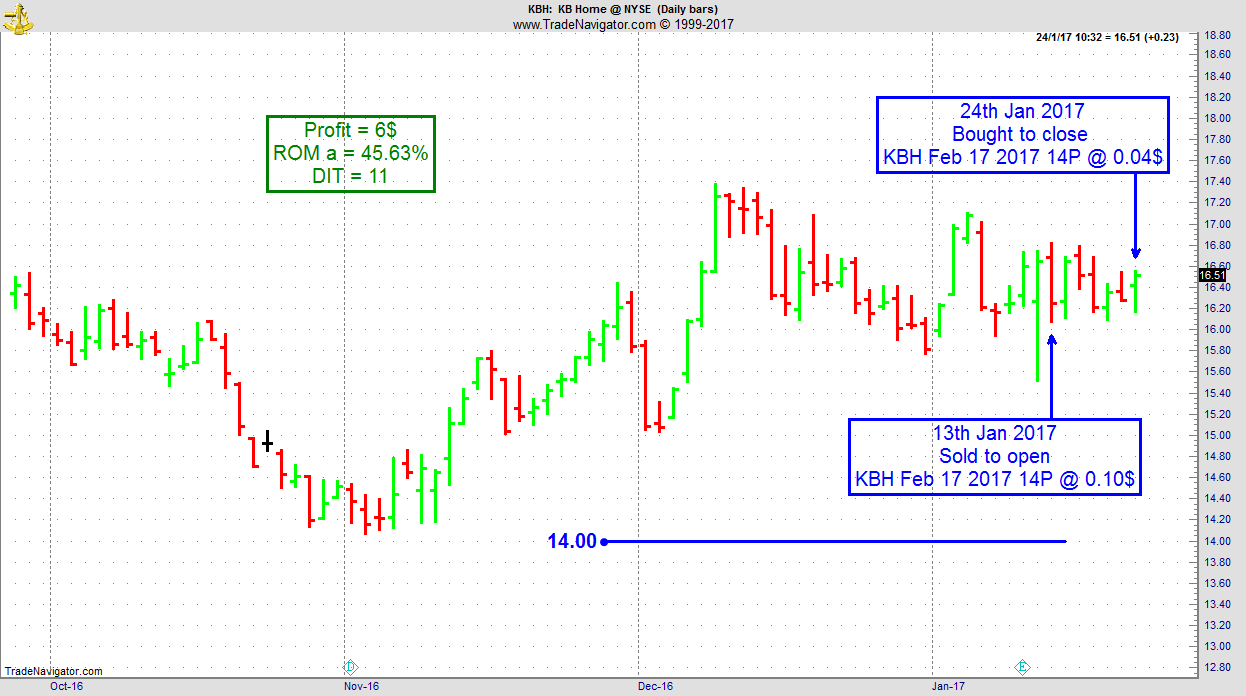
On 12th January 2017, we gave our IIG subscribers the following trade on KBH, which was in a trading range on the daily chart. We decided to sell price insurance as follows:
On 13th January 2017, we sold to open KBH Feb 17, 2017 14P @ $0.10, i.e. $10 per option sold, with 34 days to expiration, and our short strike at a major support zone, about 16% below price action.
On 24th January 2017, we bought to close KBH Feb 17, 2017 14P @ $0.04, after 11 days in the trade, for quick premium compounding
Profit for one contract: $6
Margin: $280
Return on Margin annualized: 45.63%
This trade was suitable for very small accounts due to the very low level of margin.
We have also added new types of trades for our IIG daily guidance, "no loss" propositions with unlimited upside potential, still using other people's money to trade (see recent EWZ and X recent examples).
To view previous published Chart Scan newsletters, please log in or click on "Join Us,"
shown above, to subscribe to our free "Members Only" section.
A WEALTH OF INFORMATION & EDUCATION:
Joe Ross-Trading Educators' popular free Chart Scan Newsletter has been published since 2004.
Note: Unless otherwise noted, all charts used in Chart Scan commentary were created
by using Genesis Financial Technologies' Trade Navigator (with permission).
Legal Notice and Copyright 2017 Disclaimer - Published by Trading Educators, Inc.
Chart Scan is a complimentary educational newsletter.
by Master Trader Joe Ross
Author, Trader, Trading Mentor, and Founder of Trading Educators, Inc.
WHAT SHOULD YOU TRADE?
During my private tutoring and recorded webinar, I prove to my students that what I teach can be used in any market and in any time frame.
People write to me to tell me, "All I want to trade is a 5-minute E-mini S&P 500 chart."
But why? Why would anyone want to restrict himself to one market and one time frame? There is no market in the world that is always good for trading in a single time frame. You need to look around to see exactly which markets and time frames are best suited to your personality, comfort level, account size, and current market conditions.
In fact, at Trading Educators, we are likely to trade a different market every day, and if it is the same market, we don't necessarily trade it in the same time frame as we did the previous day. The reason for that is that we want the best possible setups for the way we like to trade.
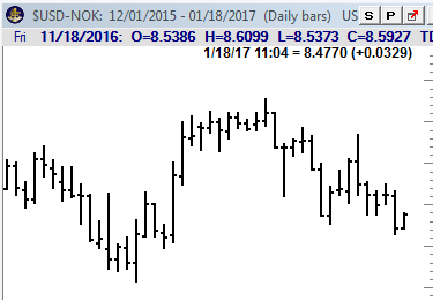
There are times when you can do just as well in the Russell 2000 ETF as you can do trading the E-mini Russell 2000 futures. Have you ever tried to trade the Norwegian Krone in the futures market? There's practically no liquidity. But you can trade it as USDNOK in the forex market as seen on the chart below. If you wanted to be short the krone, you can go long USDNOK.
Too many traders have tunnel vision. All they can see is one market and one single time frame. Trading that way is a great way to get killed. But if you truly learn how to trade; if you truly understand The Law of Charts; if you really understand market dynamics, and the correct approach to the markets, you can trade wherever and whenever the trading is best.
by Master Trader Joe Ross
Author, Trader, Trading Mentor, and Founder of Trading Educators, Inc.
Winning traders take decisive action. The decisions you have to make to put on winning trades are crucial to success. Where do you enter? When do you exit? How much risk will you take? Each of these questions must be addressed quickly and with strong resolution. But not all traders can make the right decision at critical moments of investing. Passivity often sets in. It can take on many forms from failing to pull the trigger to holding onto a losing trade. Sometimes, actually taking action is a form of passivity. For instance, rather than actively letting a winning trade fully come to fruition, a passive trader may close out a position early to lock in profits and avoid the unpleasant feeling of embracing and accepting uncertainty. There may be three types of passive traders: Cautious, fearful, and insecure. If one of these types is descriptive of you, consider learning how to conquer passivity by gaining awareness of the psychological mechanisms that lie beneath it.
Cautious traders are passive in an attempt to avoid risk. They obsess over any possible flaw in their trading plan. They try to seek out perfect trading information in a fruitless attempt to control the inherent uncertainty of the markets. Many times, their thorough search for all pertinent sources of information is merely an excuse for not taking on risk. But information is never fully complete. When you are trading, you are taking a risk, and you must accept the fact that no amount of perfectionism or caution will guarantee success. All that cautious traders end up doing is failing to take action.
A second type of passive trader is the fearful trader. Fearful traders don't trade to win. They constantly try to avoid losing. It's not a very satisfying way to trade. You might say, their need to avoid loss "leads to a sense of quiet desperation." Rather than enthusiastically trading the markets, and expecting success, they passively wait for their doom, which they think is inevitable. Your destiny is never set, however. By taking an active approach to trading, you'll increase the odds of realizing huge payoffs.
Insecure traders are passive because they continually seek approval. Insecure traders seek out acceptance and reassurance. They can't make a decision independently and spend hours gathering the opinions of others, and hope that other people can make key decisions for them. Their primary intention is to avoid responsibility. If someone else were the impetus for their decision, then it's never their fault when the trade goes sour. It's always someone else's fault. By putting the blame on others, the insecure trader is able to avoid facing his or her limitations. A grandiose self-view can be maintained. But looking toward others and avoiding an honest look at your abilities will lead to stagnation. Trading requires action, and fully engaging in trading activities requires a full awareness of what you're doing. You must actively look inward to your own intuitive sense of the market action and trust what your instinct tells you. Only when you are fully committed to looking at the market through your senses, and fully accepting your experience on its own terms can you trade freely, creatively and profitably.
In the end, there are no guarantees. You must take risks. The key is to find the proper balance. Risks can motivate you, but they can also overwhelm. By finding a level of risk that motivates you, but does not overwhelm you, you will stay energized and be ready to actively trade the markets rather than allow profits to pass by.
Developer: Joe Ross
Administration and New Developments: Philippe Gautier
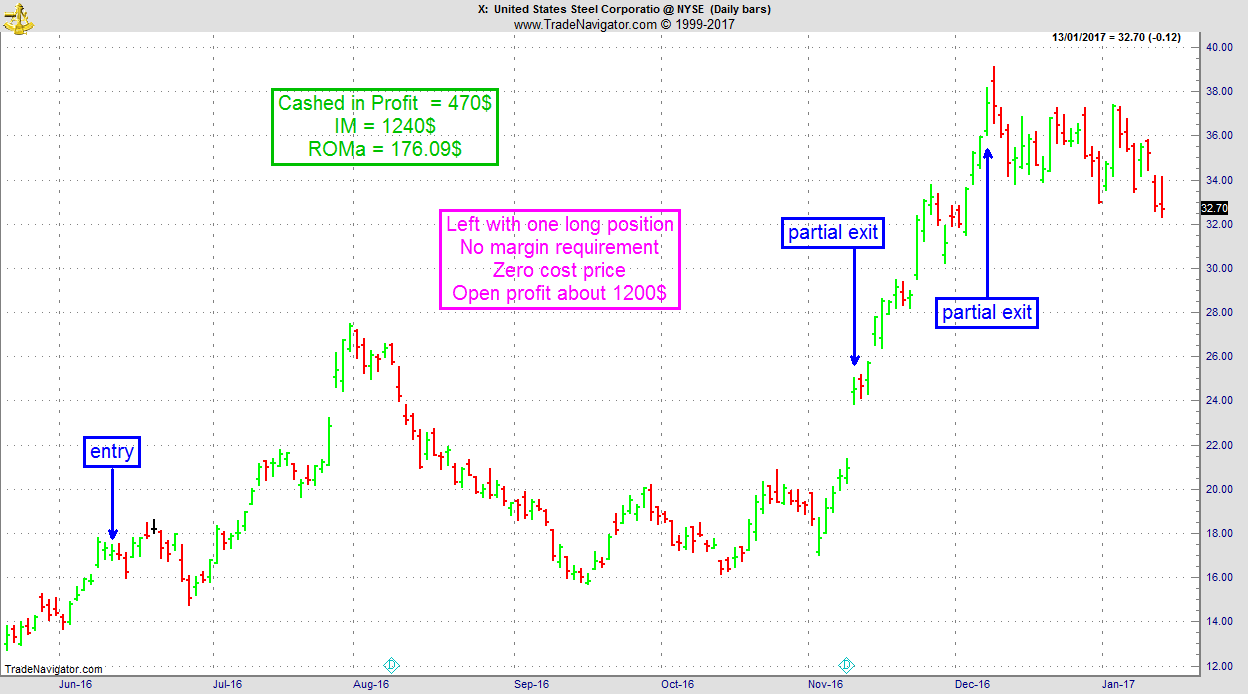
On 9th June 2016, we gave our subscribers a new type of trade on US Steel (X), which was showing accumulation on a pullback on the weekly chart.
We entered a "complex position", entered for a net credit (still working with OPM, i.e. other people's money, as usual), but with unlimited upside potential.
On 10th June 2016, we entered the trade for a credit of $1.70 (or $170 per position).
On 9th November 2016, we took partial profits on our long position.
On 7th December 2016, we took new partial profits on our long position and closed our short position.
Profit: $470
Margin: $1,240
Return on Margin annualized: 176.09%
But this is only part of the story. As part of our profit maximizing strategy on these long term trades, we still have one long call position left, with a zero cost price, an extra open profit of around $1,200, and about one year left to play out.
These are low maintenance, low stress trades with lots of upside potential.
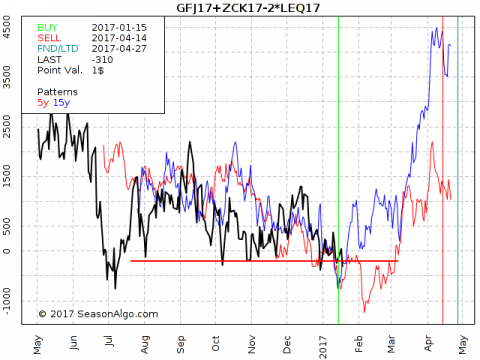
Today I am looking at a very “strange” butterfly spread: Long 1 April Feeder Cattle and one May Corn and short 2 Live Cattle August.
I have to admit that it is difficult to find an entry into this trade by looking for chart patterns, but it is easy to see the possible support around the current level. Okay, the spread moved a bit lower in July last year but this happened when there was not enough volume in all 3 legs of the spread. Since then, the spread stayed above -$500 on a close basis. Unfortunately, there is no way to trade this spread as a single contract and we need to “leg in” into each leg separately. I would also give this spread enough room to develop and therefore a risk of about $1,000 - $1,500 per butterfly seems to be necessary.
One of the most commonly discussed trading topics is whether indicators are good or bad. Should a trader use them or is it just a distraction that doesn’t add anything to the "pure" price-action you can see on a simple price chart?
The answer is that making a war of opinions out of anything related to trading and thinking in terms of "good" or "bad" is kind of silly. Remember, we’re talking about trading here, not about where you can get the best Burgers, which is the best soccer team or some other question of preferences. Trading is about making money, so it’s important to ask the right objective questions and for these, there usually are objective answers.
Does the indicator you’re looking at give you an edge in the markets or not? Or if it’s an indicator supposed to provide you a specific information in an easier way, does it do its job and make your life as a trader easier?
If it does it would be crazy to not use it. An indicator is nothing else than some kind of transformation/representation of whatever data you put in there and how you’d like to see it. The same can be said about OHLC charts. If you want it really pure then you should look only at tick data as an OHLC price bar is just a summary of that.
So don’t get fooled by the "Price Action is the only way!" crowd. Of their patterns, you can ask the very same question: "Does the shown price pattern provide an edge, yes or no? If the answer is no, and that is, unfortunately, the truth for most price patterns and indicators out there, then just forget about it and move on. Again this isn’t about a question of what appeals to you or not. It’s about whether it makes you money or not.
The truth is that any indicator is only as useful as the trader’s knowledge about the indicator. Obviously just randomly adding a couple of indicators to a chart isn’t going to be helpful. You should understand pretty well what an indicator actually does, how it works and what that number it spits out tells you. Otherwise, it’s going to be very hard to know when and how to use it. Most indicators „work“ only under certain conditions. But the very same thing can be said about any price pattern out there. If you blindly trade it without having done any testing on whether it provides you can edge or not in the market/timeframe/conditions you want to trade it, you can as well use any arbitrary indicator out there!
As a systematic trader, I use a lot of indicators in one way or the other. Most of them are indicators I came up with on my own to make my life as a trader easier. Others tell me whether a certain price pattern is there or not. But I know exactly how each indicator works and what it’s actually useful for. Whether it’s indicating some OHLC based price pattern or providing some measurement of volatility that might not be that easy to recognize by just looking at a price chart.
To view previous published Chart Scan newsletters, please log in or click on "Join Us,"
shown above, to subscribe to our free "Members Only" section.
A WEALTH OF INFORMATION & EDUCATION:
Joe Ross-Trading Educators' popular free Chart Scan Newsletter has been published since 2004.
Note: Unless otherwise noted, all charts used in Chart Scan commentary were created
by using Genesis Financial Technologies' Trade Navigator (with permission).
Legal Notice and Copyright 2017 Disclaimer - Published by Trading Educators, Inc.
Chart Scan is a complimentary educational newsletter.
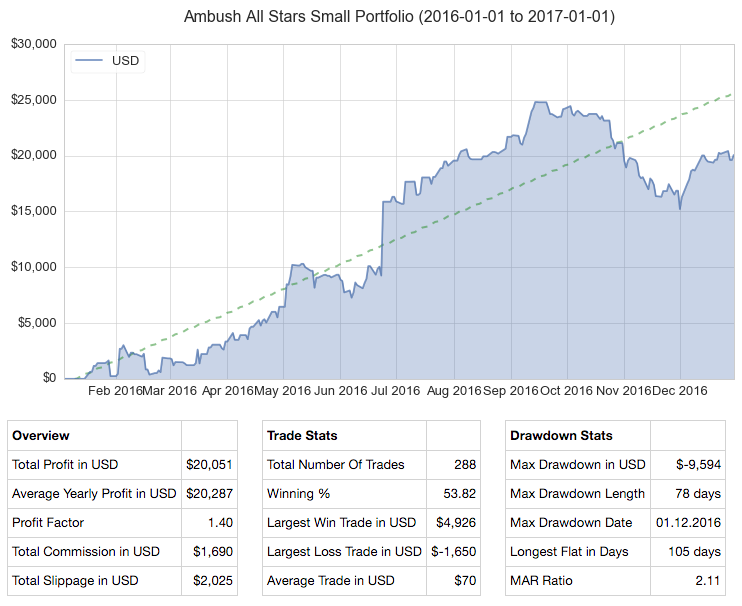
As we’re heading into 2017, I thought it was a good time to reflect on the trading performance of Ambush in 2016.
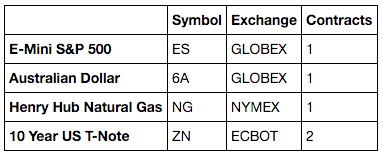
To do so, let’s look at the performance of the Ambush All Stars Small Portfolio consisting of:
The following Performance Report includes trading costs of $5 commissions round turn and 1/2-tick slippage per market order. We’re assuming to get 1-tick slippage on 50% of all executed stop-market or market orders, and of course, no slippage on limit-orders.
Now, there’s not much to say about that performance report. 2016 has simply been an exceptional year for Ambush traders and all performance metrics look just as a trader would wish for. Out of 12 months there have been only 2 losing months (October/November). The resulting drawdown of these two happening in a row wasn’t very nice, but compared to the overall profits of the year, it was still very moderate. This gives us a MAR Ratio of over 2 which is still excellent.
You need to find other things to do while padding the time waiting for better trades. Try to study the markets or different ways of trading, or simply do something completely different like going to the beach. It is critical that you learn to enjoy yourself in ways other than being in a trade.
The fact is, if you are trading in a professional way, you are out of the market much of time. So you need to think of ways to fill this time. Trading is not a full-time job where a person works 8 hours a day. Also, trading doesn't get better by trading more. The opposite is often the case.
When you are not satisfied with your trading, try to reduce the number of trades instead of putting on more trades. This might help to move your trading to a higher level and you might get better results.
by Master Trader Joe Ross
Author, Trader, Trading Mentor, and Founder of Trading Educators, Inc.
Spreads
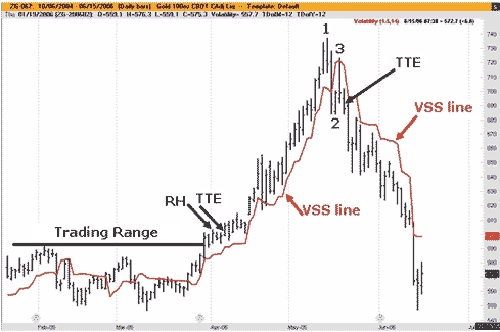
The years go by quickly. Seems like yesterday that I presented a webinar for the CBOT, in which I showed how to stay in a trend using the Volatility Stop Study (VSS).
The market I used was CBOT gold. Since that time, gold has dramatically changed, but what I want to show hasn’t changed at all.
One person wrote to me doubting that I could have used the VSS to get into the gold uptrend until it was too late. That was not at all true. I submit that it is quite possible to have used VSS in conjunction with The Law of Charts to get into and out of the gold trend, but also to have used VSS along with The Law of Charts to get into and remain with the gold downtrend.
Furthermore, there was no need to change the VSS parameters in order to make use of a combination of The Law of Charts, the Traders Trick Entry (TTE), and the VSS. The long entry into the uptrend could have been made in several places. For example, the breakout from the trading range could have been set lower. There was a Ross hook (first failure to move higher after a breakout from consolidation) lower than the Ross hook that gave the TTE shown for long entry. The chart below tells the whole story.
by Master Trader Joe Ross
Author, Trader, Trading Mentor, and Founder of Trading Educators, Inc.
I received a couple of emails asking whether or not I believe in support and resistance. In fact, one subscriber said if I didn't believe in support and resistance, then I couldn't possibly believe in trend! Why? Because in all cases the situation ends.
Here's what I believe: The trend is your friend until the end. The swing is the thing until it goes "ding."
What is support and what is resistance? Are those not simply convenient terms to describe an area of fair value? Prices bounce off of those areas of so-called support and they bounce off of areas of so-called resistance. Why? Because temporarily no one is willing to sell for less than "support" and no one is willing to pay more than "resistance." "Support" and "resistance" are equally as mythological as "trend." Why do I say that?
Every market is in a trading range between the highest price it ever achieved (resistance) and the lowest price it ever reached (support). So what is all that stuff in-between? Can we call the junk in between "support" and "resistance?" What are trends and swings? Are they not simply connectors connecting the temporary areas of fair value? So-called support areas fail to support, are broken, and are connected to a lower fair value area by a swing or trend. So-called resistance areas fail to resist, are broken, and are connected to a higher fair value area by a swing or trend.
Trend lines and swing lines are also broken, and lead to areas of fair value, where prices chop sideways for awhile. So, what's the bottom line of all this clap-trap about support, resistance, swings, and trends?
As far as I'm concerned, the only thing that counts is whether or not you have found a way to make money from any of this. If you are able to make money when prices bounce off of so-called support and resistance, then congratulations, you have probably made it as a trader. If you have found a way to make money from trends or swings, or have found a way to make money from broken trend or swing lines, then you deserve praise and are well on your way, or have already succeeded as a trader. The rest is just a mincing of words — semantics. Support, resistance, trend, swing — all are nothing more than ways to identify what prices appear to be doing. Any one of them can see the beginning of the end with the next price bar. If you tell me prices are at support, I will probably know what you mean. That is all the word "support" is good for! If you tell me prices are at "resistance," I will probably know what you mean. The same thing is true for the words "trend" and "swing" — I will probably know what you mean. We will have found a common way to communicate to one another as to the condition and location of prices.
Do I believe in support, resistance, trends, and swings? The answer is no! I do not believe in any of it. What I do believe, most of the time, are the numbers on the statement of my trading account. If they are getting bigger, then I am winning.
Developer: Joe Ross
Administration and New Developments: Philippe Gautier
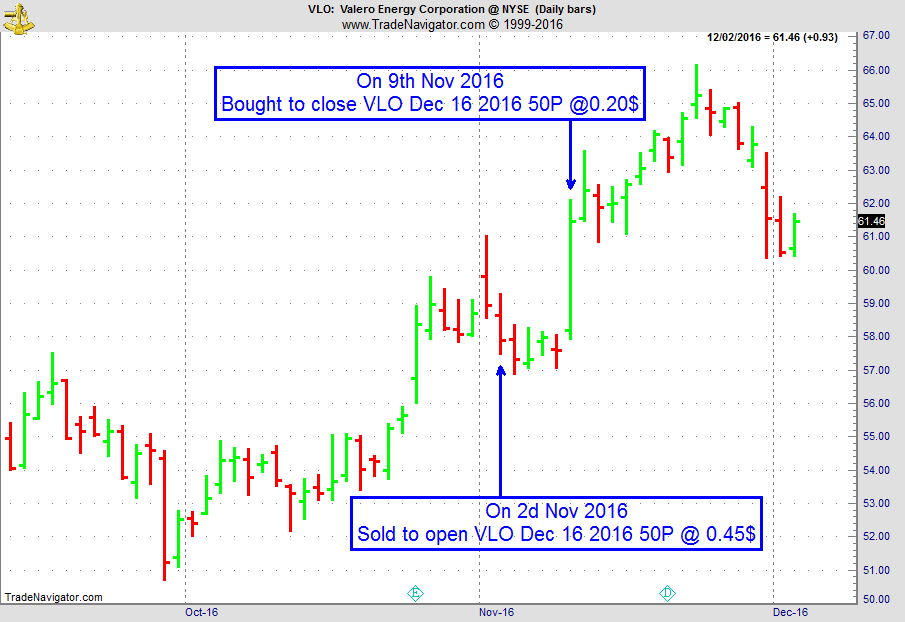
On 25th Oct 2016, we gave our IIG subscribers the following trade on VLO, for which we expected a retracement. We decided to sell price insurance as follows (we were filled on a GTC order on 2nd Nov 2016 at our minimum price):
We entered a "complex position" for a net credit (still working with OPM, i.e. other people's money, as usual), but with unlimited upside potential.
On 2nd November 2016, we sold to open VLO Dec 16, 2016 50P @ $0.45, i.e. $45 per option sold, with 44 days to expiration, and our short strike below a major support zone, about 13% below price action.
On 9th November 2016, we bought to close VLO Dec 16, 2016 50P @ $0.20, after 7 days in the trade, for quick premium compounding
Profit: $25
Margin: $1,000
Return on Margin annualized: 130.36%
We have also added new types of trades for our IIG daily guidance, "no loss" propositions with unlimited upside potential, still using other people's money to trade (see recent EWZ example in Newsletter Edition 649, log in to our members only area).
To view previous published Chart Scan newsletters, please log in or click on "Join Us,"
shown above, to subscribe to our free "Members Only" section.
A WEALTH OF INFORMATION & EDUCATION:
Joe Ross-Trading Educators' popular free Chart Scan Newsletter has been published since 2004.
Note: Unless otherwise noted, all charts used in Chart Scan commentary were created
by using Genesis Financial Technologies' Trade Navigator (with permission).
Legal Notice and Copyright 2017 Disclaimer - Published by Trading Educators, Inc.
Chart Scan is a complimentary educational newsletter.
"Teach our students the truth in trading - teach them how to trade,"
and
"Give them a way to earn while they learn - realizing that it takes time to develop a successful trader."
Derivative transactions, including futures, are complex and carry a high degree of risk. They are intended for sophisticated investors and are not suitable for everyone.
There are numerous other factors related to the markets in general or to the implementation of any specific trading program which cannot be
fully accounted for in the preparation of hypothetical performance results, and all of which can adversely affect actual trading results.
For more information, see the Risk Disclosure Statement for Futures and Options.








 Why Knowing When Not to Trade is an Edge