Trades in Stock Options. Receive daily trade recommendations. Can you imagine discovering a way to trade that promises instant income? If you think such a method is impossible, think again. It is definitely achievable, and everything you need to know is available online for one low price that includes special three-part online webinars.
Ambush is a time-proven mean-reversion day trading System focused on a variety of Futures markets around the globe. With Ambush Signals you can now easily follow the Ambush System on a subscription basis for educational purposes.
If you didn't fail early in your trading business, then you have probably been around long enough to realize that many of the problems you encounter as a trader are those that derive from your own individuality. Such problems are common among traders and, in fact, common among all human beings. Seeking spiritual help from a power much greater than your own is the area I address in the "Spiritual Side of Trading".
“We all get the exact same 365 days. The only difference is what we do with them.” – Hillary DePiano
Start your year off right with a free EBook "A Trader's Musings: A compliation Of Observations, Thoughts and Lessons From Over 50 Years of Trading" by Joe Ross. It's available at Amazon for free from January 6th through January 8th. Click here to get your copy. If you don't have a Kindle, you can download a free app.
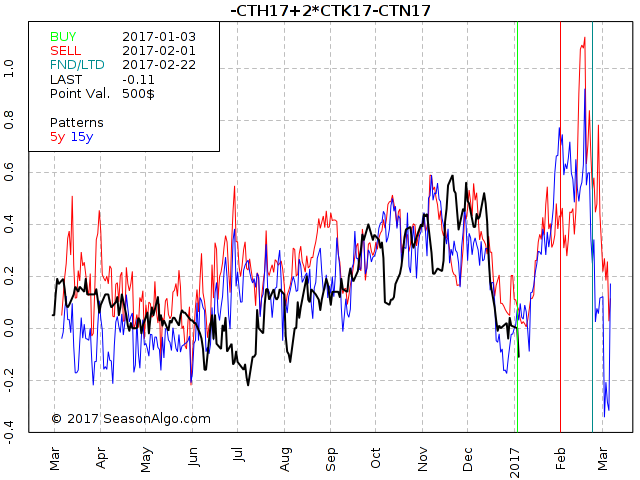
Trading Idea - Cotton Butterfly -CTH17+2CTK7-CTN17
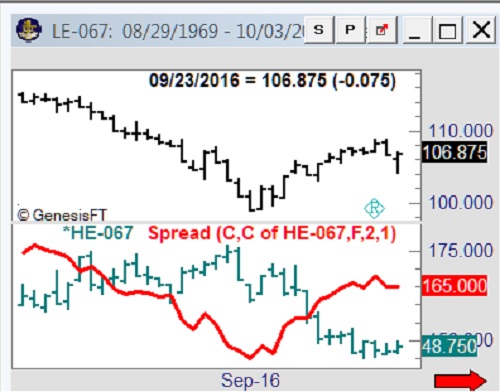
While outright futures in the so called “Softs” are usually difficult to trade, I like to trade spreads because they usually behave less “crazy”. Today I want to look into a Cotton Butterfly shown on the seasonal chart below. At the first look the spread looks kind of wild but at a closer look you might notice only the big moves, like the down move from November into January really matter in terms of US$. All the rest is just noise. The spread is also following its seasonal patter nicely and the seasonal up-move right in front of us looks promising.
If you want to know how we trade this spread in Traders Notebook, please follow the link below. There is a special deal available for the ones new to our Newsletter.
I’m sure you’ve all seen advertisements of trading systems that have 95% winning trades. And traders tend to get all excited when they see a high win rate. But while having a high win rate is nice, it can also be a very misleading performance metric.
The winning rate tells you how much percent of the trades in a backtest (or real past trades) have been winning trades. So if you have 100 trades in total, and 75 of those trades closed with a profit, you have a winning rate of 75%. Now the first thing to notice here is how those winning trades are defined. Are breakeven-trades included? What about commissions? If you have 100% winning trades in the E-Mini Dow Future and each of those trades was closed at 1 tick profit ($5) and you pay $7.50 per round turn, you actually lost money even if you hit your profit target 100% of the time.
Which leads us to the next fact. And that is that without knowing how much money was made on the winning trades vs. the losing trades, the winning rate is completely useless. Here’s an extreme example. Let’s say you have 90 out of 100 winning trades, a winning rate of 90%. Sounds great right? But what if on average you had an average profit of $100 per winning trade ($100 x 90 = $9000) but an average loss of 1000$ per losing trade ($1000 x 10 = $10000)? Right you have lost $1000 even with a winning rate of 90%. Of course this also works the other way around, if you only have 10% winners, but those are 10 times the size of your 90% losing trades, you’ll come out ahead!
Here things get interesting from a psychological point of view. Most traders are not ready to trade a strategy that only wins just 10 out of 100 times. Even if it’s numbers look amazing in the long run and it’s a really good system. Most traders simply can’t deal with this as it’s going to have long flat periods and you can easily have 10 and often 20 or more small losing trades in a row.
On the other side usually the drawdowns will be much steeper trading a system with a high win rate. When it finally hits those big losing trades, months of profits can be destroyed within a single day.
So to sum this up, the winning % is a key number to watch out for but it’s far less important than most traders think and without additional information completely useless. So you shouldn’t get all excited if you see a very high winning rate right away.
All of the 99% winning trade systems that try to capture a few pips on each trade I’ve seen in the past have blown up sooner or later. And any such systems that will come up in the future will end up in the same way. It’s always a ticking time bomb and the longer it’s been running and making money - the higher the odds are it will implode soon.
by Master Trader Joe Ross
Author, Trader, Trading Mentor, and Founder of Trading Educators, Inc.
Time Independent Charts
There is something I want to point out about trading methods. Very often you have to be discretionary when trading them. For example, we discovered that with one of the methods we used to use, 100% of the time the method made 2 1/2 - 3 points per contract very soon after entry. To use the method you had to do as we suggested and take something out of the trade as soon as you could. That meant trading at least 2 contracts—one for a short-term objective and the other to stay with the trade as long as possible.
Every method comes with a stated objective; however, discretion dictated that it was advisable to take some profit out of the trade as soon as it was possible to see at least 100 (it was up to the trader as to the amount). That way a trader was being paid to trade.
We told method users to not let greed overcome them by trying to get the stated objective every time.
During the time the method was working I took a trade in corn. The trade lost if I would have stayed in until I was stopped out. But there was ample opportunity to have taken something out of the trade. Discretion is what makes a method different from a mechanical trading system. When you know that a high percentage of the time you can make 125-150 dollars from the circumstances that created the trade entry, then isn't it wise to ensure that you are paid to trade? Take some profit and move your stop to breakeven. If you are stopped out, you will still be profitable or have mitigated any loss.
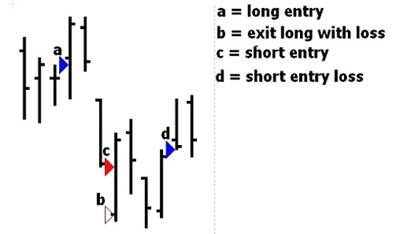
The long entry (a) was at 260 dollars. Prices moved as high as 263.50 dollars, i.e. 3.5 points = 175 dollars /contract before being stopped out at breakeven the same day. If I stayed in, this amount of profit or slightly less was available on 2 consecutive trading days.
The short entry (c) was at 252.50 dollars. Prices moved as low as 248.50 dollars after entry that same day; 4 points = 200 dollars before being stopped out the following day on a gap open at 250.50 dollars. The net gain available was 2 points = 100 dollars. If I stayed in, there was still another opportunity to have come out of the trade with a nice profit. The following day prices gapped down and 4 1/2 points = 225 dollars were available. Taking something there and moving my stop to breakeven would have avoided suffering a loss on the trade.
Trading Article - Chess and Trading. What do you think?
by Master Trader Joe Ross
Author, Trader, Trading Mentor, and Founder of Trading Educators, Inc.
Although I haven't the faintest idea of how to play chess, it certainly seems like a great idea. I imagine you can improve stock and futures trading by learning how to play chess. It might also help to develop an interest in physics. Every trader should learn to develop his problem-solving and pattern recognition abilities. I’ve been told that nothing does this better than learning how to play chess. Some of the first computer algorithms were designed to play chess. Just as chess taught the computer how to think, it seems likely chess can teach traders how to think more logically and effectively. Chess is something that might be taught in the first grade through high school in all schools to help children develop problem-solving abilities, and to create self-confidence and self-reliance. Chess, when taught to under-privileged children, was responsible for the greatest overall grade improvement for all students on all levels. Of course no one knows for sure what the social impact of such a plan might be. What about the kid who really has trouble seeing ahead; kids who have dyslexia like me? Pattern recognition is the key to understanding bar chart structure. Variations of similar patterns are constantly occurring in the markets. Prices move either up or down 100% of the time. Truly, prices do not move sideways. Markets move sideways, not prices. If a price moves, it is either up or down. Sideways for the market indicates virtually all price movement within a certain range. A key to correct technical analysis is simplicity; breaking the market down to its basic price structures for comparisons of highs, lows, opens and closes within various time periods. Profitable trading can be derived from recognition of simple recurring price patterns based on the action, reaction, and interaction of market perception.
To view previous published Chart Scan newsletters, please log in or click on "Join Us,"
shown above, to subscribe to our free "Members Only" section.
A WEALTH OF INFORMATION & EDUCATION:
Joe Ross-Trading Educators' popular free Chart Scan Newsletter has been published since 2004.
Note: Unless otherwise noted, all charts used in Chart Scan commentary were created
by using Genesis Financial Technologies' Trade Navigator (with permission).
Legal Notice and Copyright 2017 Disclaimer - Published by Trading Educators, Inc.
Chart Scan is a complimentary educational newsletter.
Edition 655 - December 30, 2016
New Year's Edition
Final Thoughts
by Master Trader Joe Ross
Author, Trader, Trading Mentor, and Founder of Trading Educators, Inc.
In a few days we begin a new year. Are you ready? Have you taken time to relax, make plans, and do a bit of self-examination? At Trading Educators we’ve done that, and we will be ready for 2017.
From where we sit it look as if the markets could be pretty wild, especially during the first quarter. The world is balancing on the edge of a razor blade, and there’s no telling what will fall and when. The fact is that maybe very little will fall and certain markets will race higher. 2017 looks to be a year where more than ever before, you will need to be in the right place at the right time. Crude oil could easily hit $60 a barrel. Gold could continue down below $1,000 before ultimately rising to as high as $2,500 by the end of the year.
If Mr. Trump and the World Trade Organization come to an agreement, look for the dollar to be devalued by close to 15%. It will be done in a way that few realize or expect. Imports will be taxed as a sort of semi-vat, while exports will be subsidized. The net effect will be to devalue the dollar. Few if any are talking about this, but it is real and the new administration will try hard to push it through. If it succeeds, it will affect all global trade. We are talking about something truly major.
If nothing else, 2017 promises to be exciting and will offer many opportunities to trade yourself into wealth. As usual, Trading Educators will be there to help you do it. We are traders, not investors, and because of that, we are able to go to wherever the money is being made. As traders, we need not do all the guessing and research that investors have to do. We don’t just write about trading, we actually do it. We always have skin in the game.
We hope you will join us for a successful 2017. We intend to be profitable, and want you to ride along with us.
To view previous published Chart Scan newsletters, please log in or click on "Join Us,"
shown above, to subscribe to our free "Members Only" section.
A WEALTH OF INFORMATION & EDUCATION:
Joe Ross-Trading Educators' popular free Chart Scan Newsletter has been published since 2004.
Note: Unless otherwise noted, all charts used in Chart Scan commentary were created
by using Genesis Financial Technologies' Trade Navigator (with permission).
Legal Notice and Copyright 2016 Disclaimer - Published by Trading Educators, Inc.
Chart Scan is a complimentary educational newsletter.
From the Staff at Trading Educators,
wishing you a very Merry Christmas and a Happy New Year!
Season Greetings and End of the Trading Year Thoughts
by Master Trader Joe Ross
Author, Trader, Trading Mentor, and Founder of Trading Educators, Inc.
Dear friends,
I keep wondering where 2016 went and now we are looking at 2017. 2016 just flew by, but lots of things happened. We finished the development of our new website. We introduced some new products, and we received lot of messages from you about your trading successes.
For me the milestone has been the continued success of our Instant Income Guaranteed program. We are now over 3 years without a losing trade. Do you know of anyone else who can say that?
As for 2017, we are expecting much turmoil and wild volatility in virtually all markets. We are living in interesting times. We are making every effort to be able to guide you safely through what we see ahead.
Today, as I write this, I personally begin my time away from the markets. It has been a lifelong habit to stay away from mid December until the end of the first week in January. The markets can be pretty crazy in the latter days of the year that will end, and the first days of the year that is coming. As a company, we take time to be grateful for what we have, and to think, plan, and just relax. It’s amazing how getting away can make things more clear.
However, this is the time of the year when I want you to know that we are thinking about you and how we can better serve. And please do let us know what you would like to see on our website. Hearing from you in addition to making what we offer, whether free or for a price, is the only way we can truly stay connected.
At Trading Educators we are very much aware that our main purpose is creating new value. That keep us busy evaluating and improving what we do and gives us the impetus to come up with something new.
We truly hope you will do the same in your own lives. Stop taking any new trades, carefully monitor what you already have and get as far away from the business of trading as you possibly can, until we are a week into 2017.
We wish you a wonderful holiday season. Have many happy days between now and the end of the year and then beyond as we sail into 2017.
As always during the last days of the year, I like to look back to see what happened in 2016 and what changes I would like to make for the next year.
While 2015 was not very productive, 2016 was much better and positive in all 3 different categories: Spread Trading, Options Trading, and Outright Futures Trading. Especially spread trading which was doing great in 2016 after not doing so well in 2015. Options trading was very slow this year and we had only a few trades in 2016, but finished the year positive almost at equity highs! And our new Outright Trading Service that started the end of July is already showing nice numbers.
Honestly, if I can stay on this track in 2017, I will be happy! OK, I’d like to get a few more options trades and maybe a few more spread trades, but all in all I’d be happy to repeat the results in 2017.
I am wishing all of you a great Christmas time, hopefully with your family and friends. I will shut down my trading office for a week and will be back on the 2nd to check the markets.
I'd like to thank all of you for a great year 2016! I really enjoyed being in exchange with many of you on a regular basis.
I'll spend the next two weeks with my family and friends, with my mind far away from the markets. That's what I strongly suggest to do during these days of low liquidity. Just do what everyone else does and relax during this time. It's often the only two weeks of the year where I'm really 100% away from the markets as I usually keep on trading my systems during vacations if somehow possible. So I'm always looking forward to that XMAS break also knowing how eager I'll be to resume trading after a two weeks break. Just love that feeling to start into a new year with a clean slate, especially as my trading results have been somewhat mixed in 2016.
So I'd like to wish all of you a Merry Christmas and a Happy New Year 2017. Enjoy the holidays with your family and friends, and I'm looking forward to a great trading year 2017 with you!
To view previous published Chart Scan newsletters, please log in or click on "Join Us,"
shown above, to subscribe to our free "Members Only" section.
A WEALTH OF INFORMATION & EDUCATION:
Joe Ross-Trading Educators' popular free Chart Scan Newsletter has been published since 2004.
Note: Unless otherwise noted, all charts used in Chart Scan commentary were created
by using Genesis Financial Technologies' Trade Navigator (with permission).
Legal Notice and Copyright 2016 Disclaimer - Published by Trading Educators, Inc.
Chart Scan is a complimentary educational newsletter.
“You have to find something that you want to accomplish, that you want to achieve…There has to be some goal that you set for yourself and, after you’ve reached that goal, you set a new one. You always have to be shooting for something, striving for something.” Larry Fitzgerald
Most traders start out with a dream. And usually part of that dream is that once you’re a successful trader you’ll have a lot more time for the things in life you enjoy spending time with. Your family, friends, hobbies, spend time in nature and start other business opportunities you’ve been dreaming of realizing. Besides making money, for many the main reason to start trading is actually that they no longer want to spend 40 hours a week sitting in a office staring at a screen.
Unfortunately many traders end up doing the exact opposite of that. Staring at their screens for hours each day, looking at charts and quotes. They don’t really have a precise plan of their trading day. Instead they wake up, turn on their charts and wait for what they perceive as a trading opportunity. No need to say that this often leads to overtrading, but let’s say our trader has matured enough to be mostly free from such flaws.
Still being an active day trader he’s trading a lot in and out during the day, but being very talented he usually comes out ahead at the end of the trading day. Trading the E-Mini S&P 500 he manages to make a profit of 2 points a day on average. He’s trading two contracts so that’s 2.0 x $50 x 2 = $200. Doing 10 trades on average each day, paying $5 round turn per trade, that’s 10 x 2 x $5 = $100 commissions we have to subtract. So his actual profit after commissions is $100. Trading for 8 hours each day, that’s $12.50 per hour…for doing a quite exhausting job! Ouch.
Let’s have a look at our second trader. He knows his business very well after having invested a considerable amount of time and money to learn about the markets. Our second trader trades a system with precise trading rules, also in the E-Mini S&P 500. Let’s call it Ambush. He knows exactly at what times of the day he has to take action. In his case, when to place his entry order and when to exit his positions each day. This way he can easily plan his day, knowing that he won’t have to watch the markets at all. Being a professional he takes his trading business very seriously and religiously tracks each trade, checks his fill prices and so on. Still he doesn’t need more than 10 minutes each day to run his trading business. On average he makes about $105 per trade per contract. Never making more than one trade a day, he just has to subtract $5 commissions which leaves him with $100. As he just needs 10 minutes each day to place his orders, that’s $600 per hour on the days where he actually trades! For doing a not very exhausting job…
What a difference compared to our chart watcher! Hope you see the light here. This is huge, and once you realized this truth you can make a big step forwards in your trading career. Herein lies the reason why I decided to move towards systematic trading many years ago. First of all watching charts all day does get really boring once you no longer trade for the excitement, and I had a very different dream of what my days would look like as a trader. But even more importantly I can use all that freed up time for other business ideas, hobbies, to create new systems and to write articles like this one and make additional money helping other traders.
At least I’d suggest that even if you’re day trading discretionary, take your time to really learn about the markets you’re trading. Get some statistics and you’ll discover that every market has times during the day where it makes most sense to trade. Focus your trading activity on these time periods. They’re hardly changing over time so you can plan your trading day nicely. Truth is that most of the time it simply is a waste of time and money to day trade. I can almost guarantee you that you’ll make more money this way than trading all day long, especially after subtracting trading costs.
by Master Trader Joe Ross
Author, Trader, Trading Mentor, and Founder of Trading Educators, Inc.
Spreads
I was cruising through my charts one morning looking for an easy spread to trade. I saw that the spread between long Lean Hogs, and short Live Cattle had reached an extreme and was beginning to bottom out. Looking at the prices themselves, I saw cattle price possibly rising, while hog prices continued to fall. I thought to myself, "Aha! Here is my opportunity for a simple observation spread."
The markets are full of these kinds of spreads, if you just look for them. Because cattle and hogs trade with equal point values, it is not necessary to use multipliers to truly see whether or not the spread is making money. Nevertheless, I wanted to see the dollar value of the spread, so I multiplied each leg of the spread by its full point value of $400. That means I entered the spread as 400*LE - 400*HE, and brought up the chart fully expecting to see some kind of entry point. It was there, a 1-2-3 low.
Trading Article - Do you think that what this guy wrote is true?
by Master Trader Joe Ross
Author, Trader, Trading Mentor, and Founder of Trading Educators, Inc.
"You can get ahead of yourself in this game, and it’s dangerous to get cocky. But I’ve had times where for an hour I could do no wrong. I’m trading and 99 percent of the trades are good, they’re all for 30 or 50 contracts, and I’ll make 10 grand. Then I’ll overextend myself and maybe buy 10 or 15 contracts, fighting the trend just because I know prices have hit a support level. Then prices blow through that support and I can’t get out without losing half of what I made earlier. When that happens, you’ve just got to sit back, take a deep breath, drink a glass of water, and get back in."
I think that there is some truth in what was written, but there is also a lot of bad advice there as well. You can get ahead of yourself in trading – and trading is not a game, it is a business in which it is dangerous to get cocky. We’ve all had our “magic” moments when we could do no wrong. But a truly great trader will learn to take his money off the table and be satisfied with what he made. It is the greedy trader who overextends himself. It is the foolish trader who fights the trend. It is an even greater fool who believes that there is such a thing as “support.” The foolish advice here is that whoever wrote what you quote readily admits that prices blew through so-called support, which makes it not support at all! He has already proved he is a fool by overtrading his account at what he determined to be support. Now he tells you to continue overtrading by gritting your teeth and jumping back in. Whoever wrote that “advice” sounds like a real blow-hard. He claims to trade big-time, but I don’t know any truly great traders who make that many mistakes and then pass it off as advice!
To view previous published Chart Scan newsletters, please log in or click on "Join Us,"
shown above, to subscribe to our free "Members Only" section.
A WEALTH OF INFORMATION & EDUCATION:
Joe Ross-Trading Educators' popular free Chart Scan Newsletter has been published since 2004.
Note: Unless otherwise noted, all charts used in Chart Scan commentary were created
by using Genesis Financial Technologies' Trade Navigator (with permission).
Legal Notice and Copyright 2016 Disclaimer - Published by Trading Educators, Inc.
Chart Scan is a complimentary educational newsletter.
Finding your trading nitch in the market just got easier! Trading Educators offers several Trading Advisory Services. Select the service that fits your trading style or look into entering a different market.
Trading on News Days - Ambush Day Trading the E-Mini S&P 500
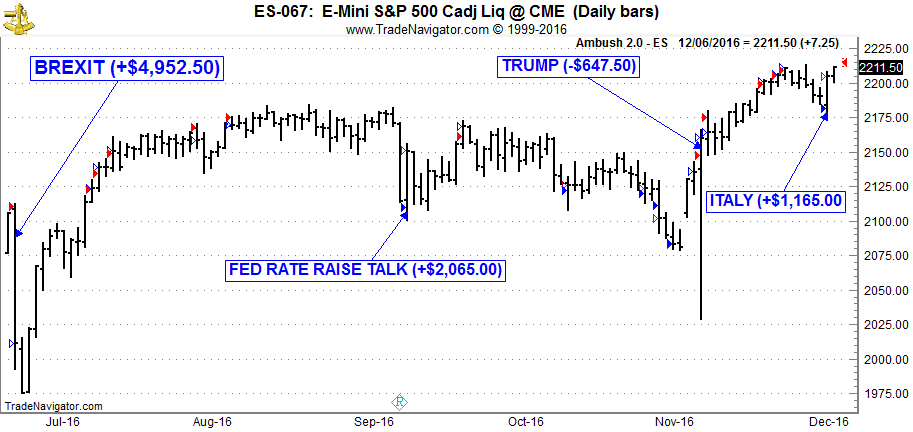
This year we’ve had a couple of events that were likely to have a strong impact on the markets:
BREXIT Decision in June
FED Rate Raise Comments in September
US Elections in November
Italy Referendum in December
All of them happened over a weekend so the question many traders have been asking themselves was whether to trade on these days or not. Ambush traders have been no exception here so I got a lot of emails asking what to do.
My answer is always the same. It’s impossible to know what the actual news will be and how the markets will actually react.
What we do know though is that on such days it’s very likely that volatility will be much higher than on average. How that volatility will play out is impossible to know. In case of Ambush this means it’s much more likely on such days to either get stopped out with a big loss or to catch a really big winner. Because of that the question comes back to the trader: Take the risk or not? Another option is of course to trade less size on such days, knowing that volatility is likely to explode.
Now the good news is that on most of these events Ambush traders who have been ready to accept the risk made a killing day trading in the E-Mini S&P 500. The only even where Ambush lost was on the Trump event where the stop loss avoided bigger losses and made most of it back already on the next day.
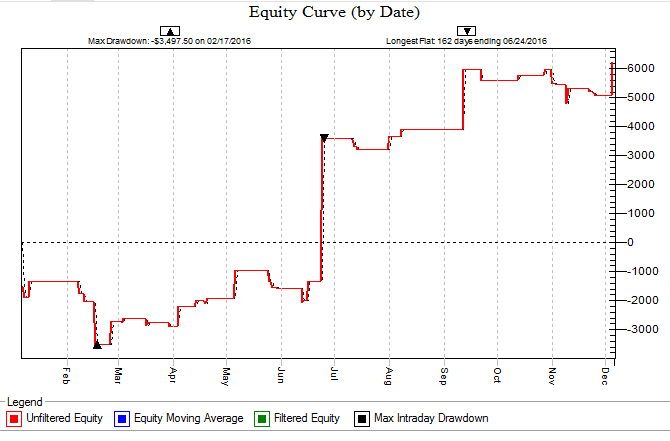
Overall Ambush had a great year in the E-Mini S&P 500 and thanks to the Italy-Trade the equity is now at new all time highs, here’s this years equity curve showing all E-Mini S&P 500 Day Trades, trading one contract including $10 per round-turn for commissions:
The average trade has been about $145 (including $10 commissions round-turn), which is amazing considering that Ambush is a Day Trading method, meaning you never keep positions over night!
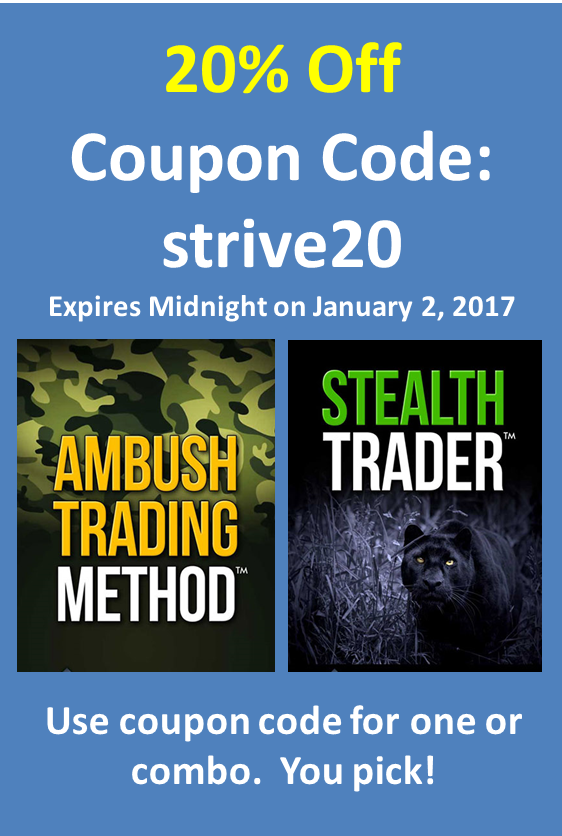
Now if you want to become an Ambush Trader too, there’s different ways to do so. You can either buy the Ambush eBook and learn all about how the method works and set everything up yourself.
Or you join Ambush Signals and simply get access to the daily Ambush Signals for all of the supported Futures markets. This way you can just follow Ambush without having to go through the hassle of setting up charts, indicators and taking care of getting the right data and so on.
by Master Trader Joe Ross
Author, Trader, Trading Mentor, and Founder of Trading Educators, Inc.
Ledges
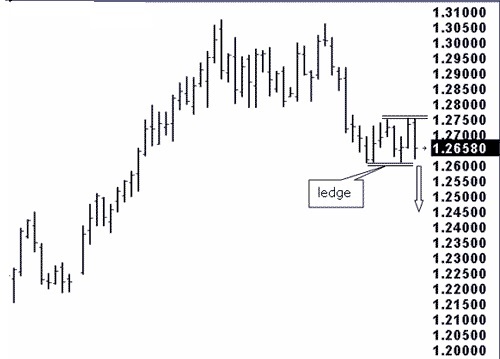
On the chart below we see that prices have formed an 8-bar ledge.
The Law of Charts states that a ledge begins with the profit taking that occurs during or at the end of a trend or swing. All ledges begin with Ross hooks. However, due to indecision, a sense of fair value, or confusion as to which way prices will go, the normal progression of the swing or trend does not continue.
The Law of Charts states that the percentage in favor for a successful trade is to take a breakout from a ledge in the direction of the former swing or trend. The arrow indicates that the best chance for success would be a breakout to the down side.
Trading Article - Looking at how the money supply affects trading in the markets.
by Master Trader Joe Ross
Author, Trader, Trading Mentor, and Founder of Trading Educators, Inc.
There are two important components of federal market activity which affect long- term economic activity and stock and commodity values; these are interest rates and money supply. A contracting money supply was one of the factors that caused the Great Depression of the 1930's.
In the early 1980's most traders focused almost totally on the money supply figures, which would cause cash bonds and T-Bill rates to react violently as soon as the M-1 and M-2 figures were released every Friday afternoon. The Fed Funds Rate and Discount Rate are the most important rates, and three consecutive increases or decreases establish a trend. When money supply decreases and interest rates increase, they tend to suppress economic growth.
The Fed also buys and sells government securities, through special authorized dealers, to affect the overall money supply.
Inflation becomes a problem when the CRB spot index and CRB raw industrial commodities begin to increase sharply. Stock traders will decrease holdings in interest rate sensitive stocks, like utilities, and buy cyclical stocks in the Dow Industrials, like Alcoa, or steel stocks. Expect higher interest rates to follow inflation. When interest rates move higher, T-Bonds, all T-Notes, T-Bills, and Eurodollars can be expected to feel downward pressure.
Usually, but not always, rising interest rates help the dollar as long as interest rates in the U.S. are relatively higher than those in other nations. By relatively, I mean that the differential between U.S. interest rates vs. those of competing nations is somewhat out of line to the up side.
To view previous published Chart Scan newsletters, please log in or click on "Join Us,"
shown above, to subscribe to our free "Members Only" section.
A WEALTH OF INFORMATION & EDUCATION:
Joe Ross-Trading Educators' popular free Chart Scan Newsletter has been published since 2004.
Note: Unless otherwise noted, all charts used in Chart Scan commentary were created
by using Genesis Financial Technologies' Trade Navigator (with permission).
Legal Notice and Copyright 2016 Disclaimer - Published by Trading Educators, Inc.
Chart Scan is a complimentary educational newsletter.
"Teach our students the truth in trading - teach them how to trade,"
and
"Give them a way to earn while they learn - realizing that it takes time to develop a successful trader."
Derivative transactions, including futures, are complex and carry a high degree of risk. They are intended for sophisticated investors and are not suitable for everyone.
There are numerous other factors related to the markets in general or to the implementation of any specific trading program which cannot be
fully accounted for in the preparation of hypothetical performance results, and all of which can adversely affect actual trading results.
For more information, see the Risk Disclosure Statement for Futures and Options.








 Trading Article -Why You Can Still Lose Money Winning 99% of Your Trades


 Merry Christmas,