Trades in Stock Options. Receive daily trade recommendations. Can you imagine discovering a way to trade that promises instant income? If you think such a method is impossible, think again. It is definitely achievable, and everything you need to know is available online for one low price that includes special three-part online webinars.
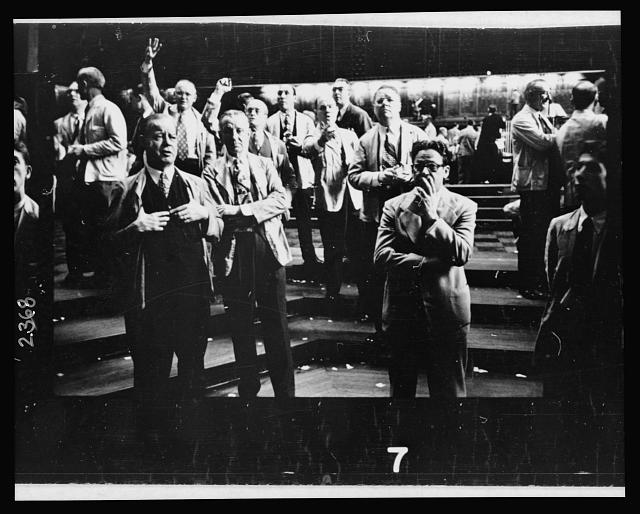
Ambush is a time-proven mean-reversion day trading System focused on a variety of Futures markets around the globe. With Ambush Signals you can now easily follow the Ambush System on a subscription basis for educational purposes.
If you didn't fail early in your trading business, then you have probably been around long enough to realize that many of the problems you encounter as a trader are those that derive from your own individuality. Such problems are common among traders and, in fact, common among all human beings. Seeking spiritual help from a power much greater than your own is the area I address in the "Spiritual Side of Trading".
Learn all you need to know about our Ambush Signals service during this presentation by Marco Mayer. What is the Ambush System? What's the idea behind it? Ambush Signals trades in a variety of markets:
Futures: Stock Index, Commodity, Currency, and Interest Rates
Spot Forex Markets
ETFs
CFDs on any of the supported markets (results may vary, depending on your broker's quotes)
Chart Scan with Commentary - Can you have it both ways?
by Master Trader Joe Ross
Author, Trader, Trading Mentor, and Founder of Trading Educators, Inc.
Many traders are highly concerned with reducing their risk, and/or getting out when their positions turn against them. The normal method for doing this is to use a stop order. In his books, William O’Neal advocates getting out after an 8-10% loss. Many other authors of trading books also suggest this approach.
This is an adequate approach, except for two details never mentioned in most books: the first is that you don’t know when the 8-10% is going to happen; the second is that the price can gap over your 8-10% stop, causing you to exit with a greater loss than planned.
However, there is a way to know exactly when to exit, and how much of a loss you are willing to accept. More importantly, the stock can gap as much as it wants, but you would lose only the predetermined amount you decided upon when you entered the position.
The Protective Put or Call is a synthetic options strategy that allows you to have predetermined risk and unlimited growth potential. A Protective Put is used for a bullish position, and a Protective Call is used for a bearish position. The following example shows Protective Puts. A good Protective Put position is usually one that limits your risk to about 6%. This strategy positions you at least 2 – 4% better than would using the conventional wisdom of an 8 – 10% stop.
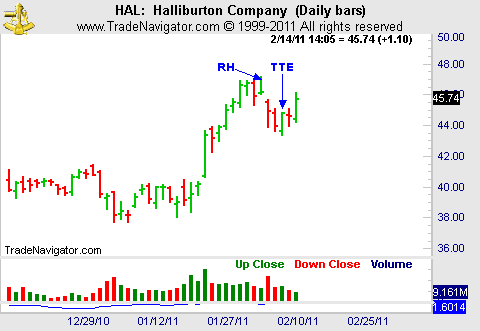
Additionally, there is a method for entering a Protective Put with very little, and sometimes negative, risk. You enter it using the Trader’s Trick Entry (TTE), using the principles of the Law of Charts. In the following example, our entry uses a Ross Hook (RH) chart formation with the TTE.
Trading is never without risk, but the length of time for which you accept that risk is under your control. When you are able to control events, the probability of your making a profit increases dramatically. The question is, how do you use the Law of Charts to create negative risk more quickly, without any additional risk when entering the position? Assume the following:
Stock/ETF price = $50
Put strike price is $60 and 6 months' out
The $60 Put premium is $13.80, creating a 6% ($3.80) risk on capital 1
7-Day Average Trading Range (ATR) is 1.50
Examining our situation using 100 shares, we have:
Traditional 8 – 10% stop loss
Cost of Stock/ETF
$ 5,000
Stop Risk (10%)
$ 500
Downside Gap Open Risk
???
Total Risk
Unknown
Protective Put
Cost of Stock/ETF
$ 5,000
Cost of Put
$ 1,380
Total Cost
$ 6,380
Put Sell Rights
$ 6,000
Total Risk
$ 380
Downside Gap Open Risk
$ 0
Total Risk Guaranteed
$ 380
From the initial entry, the Protective Put limits our risk without any potential for more.
How do you reduce the risk even more? With the above parameters you would have to make up $3.80 upon entering the position, without risking more than 6%. That would be the same risk as if you had entered the Protective Put directly. To make up the $3.80, you will use a combination of Options and Stock to reduce your risk to near zero or less.
First, you need to determine the Law of Charts' formation with which to enter. The preference would be to enter a position with momentum. Therefore, look for a Ross Hook in a trend, and select your entry point according to the Law of Charts.
1 Rounded to the nearest option premium.
As mentioned above, there is no such thing as risk-free trading. However, the amount of time for which you accept that risk is your decision. The total time to execute this entry strategy will be 1 day. During that day, you employ the traditional stop methodology for your positions. However, since you will enter the positions after the market opens, there is no chance of your experiencing a gap down on the open.
The second step is to divide the risk amount of $3.80 into a portion for the stock and a portion for the options you will use. You will then employ a technique like the double or triple ETF to gain an advantage. For a double advantage, buy a long Call for each 100 shares of stock purchased. For a triple advantage, buy 2 long Call contracts. Buying long Calls requires less margin than does selling short puts. Our allocation for the triple advantage will be:
Stock/ETF risk = $1.80
Long Call Risk = $1.00 x 2 = $2.00
Total Allocated Risk = 3.80
These are the stops you will use for the stock and 2 option contracts when you enter them according to the Law of Charts and TTE methodology. In this manner, you are risking the same amount as if you entered the Protective Put directly. Do not get greedy, you just want to reduce your risk.
The third step is to place contingent orders to enter the stock and 2 option contracts with stops of $1.80 and $1.00 respectively. Be sure to select an option with a delta of 75 or greater. It will not take much movement to get close to a negative risk Protective Put with this set up, as it is very likely to occur within one day.
The 7-Day ATR (Average True Range) is 1.50; its significance is how much you can expect the stock/ETF to move in one day. Do not expect to get 100% of the movement: 70% is good, and 80% is very good. This is what you should be looking for as your decision point to exit the Long Call options and enter the Protective Put.
Stock Increase of approximately
$ 1.20
Option increase of approximately $0.75 x 2
$ 1.50
Decrease in $60 Put of approximately
$ .40
Total Advantage
$ 3.10
Protective Put Risk
Cost of Stock/ETF
$ 5,000
Cost of Put
$ 1,380
Total Cost
$ 6,380
Put Sell Rights
$ 6,000
Total Risk
$ 380
Downside Gap Open Risk
$ 0
Total risk guaranteed
$ 380
TTE Strategy
$ -310
Total Risk
$ 70
% Risk
1.1%
Can and does this work? Yes, it does, but you have to have your plan in place before you jump into the market. You must have your plan in place BEFORE you enter the trade
There is one more step to this trade, and that is how to set yourself up for unlimited upside potential. This is a bullish strategy, and the two simplest methods are to do nothing and just let the stock appreciate, or to sell a Call at or above the strike price of the Put.
These are very effective and profitable strategies. However, selling a Call will remove you from any profits above the strike price of the Call. Doing nothing requires the stock to rise $10.70 before you have any profit. There is a third and more effective trade: sell a Bear Call Spread at or above the Protective Put strike price.
Total Current Risk
$ .70
Sell Bear Call for at least
$ .70
Total Position Risk
$ 0
% Total Risk
0%
The advantage of using a Bear Call Spread instead of the Covered Call is that you participate in the appreciation of the stock when it rises beyond the $75 strike price of the short Call. The worst you can do is 0% return, and the best is unlimited. However, as the expiry date approaches you will have to make a decision to sell the long Call to take your profits.
Other methodologies for adding profits include selling Puts when the stock/ETF is rising, taking small profits. When the stock is falling, selling the stock and buying it back at a lower price provides the same return as short selling, but without the risk.
In the above example we used a stock. You can use this strategy equally well with futures contracts with one precaution. Whereas a stock will not expire, a futures contract will expire, so you must carefully structure the trade with the understanding that the expiration date for a futures contract must be taken into consideration.
by Master Trader Joe Ross
Author, Trader, Trading Mentor, and Founder of Trading Educators, Inc.
Trading for a living involves more than getting in and out of the market at the right time, and more than thinking about moving averages and indicators. Trading is a business, not just a job, and every business in the world has to be managed. Every business involves the managerial functions of organizing, planning, delegating, directing, and controlling. If you, the trader, are to perform these functions well, you must learn to practice self-discipline and self-control.
It is actually painful to see traders who are highly successful in their present occupations, yet who come into the business of trading for a living using few, if any, of the managerial skills that make them winners in their own area of specialization. They have entered into a high-stakes venture, but are acting as if there were no way to lose. By omitting the functions of management, they often lose a considerable amount of money. They blindly throw themselves, their time, and their capital resources at the markets.
There is much more to the business of trading for a living than just trade, trade, trade, with no regard for the managerial aspects of trading. Traders are generally defeated by their own bad habits.
If you have any bad habits, expect the market to discover them and destroy you with them. In the business of trading, you have to take every step possible to save yourself the pain of having the markets discover your weaknesses. You need to find those weaknesses yourself, before you are hurt, and learn how to deal with them. Do you stay in too long? Do you expect too much from a trade? Are you greedy? Do you find yourself ending up "the greater fool?" Are you overtrading? Are you selfish? Are you fearful? If you have any of those bad habits, they are problems; and for problems, there are solutions.
If you think trading for a living is the same as investing, you are way off base. You need to realize there is a vast difference between the business of investing and the business of trading. You need a wake-up call if you are trading from desperation or the opinion of others — even your own opinion is worthless! You cannot change the market with your opinion. The only thing you can do if you want to win is to get in step with the market.
If you are looking for the holy grail of trading, or if you are trading because you’re bored, then you need to stop, think, and take a good look at yourself.
Until you establish your trading as a business, you will find that you don’t know what it means to let your profits run — you won’t have any consistent profits! Until you discover your real personal risk tolerance, you won’t really understand the meaning of risk. True risk management involves matching your risk tolerance with the risk in the marketplace.
If you are losing money, it’s because you don’t actually understand losing! Believe it or not, there’s an art to losing in the market. You have to learn how to control your losses; when you do, the wins will take care of themselves!
Are you a trader who tries to reinvent the wheel? Are you a trader who shoots his mouth off? Do you lie to yourself? Do you change your trading plan in mid-stream? You need to fix these bad habits.
Are you getting out of a trade too soon? Are you afraid to be wrong? What are your character faults? Do you see them?
Do you suffer from lack of humility? Are you throwing good money after bad? Just what is your sad but true story?
If you’re a losing trader, you need to be taken apart at the seams, put back together, and placed on the path to success.
The business of trading for a living involves making and taking profits. In addition to finding the solutions to your problems, you have to learn the chart patterns for success, as well as how to manage trades and manage yourself.
Over fifty-six years ago, I (Joe Ross) went through the very same problems you face today. I had to deal with those problems, and believe me, I had many of the bad habits discussed in this article.
Partly to help myself, and partly to help others, I wrote down the problems and solutions in what has become a classic manual for traders. It’s called Trading Is a Business, and it’s about making money in the markets. The book deals with solving the problems most traders have. Since I wrote the book, I have discovered that there are numerous traders who are successfully trading for a living through using what they learned in Trading Is a Business.
Trading Is a Business caused one trader to write, "I have been trading for six years with limited success. Joe’s techniques have really brought my trading into focus. Joe’s trade and money management techniques in particular, have helped me to become more consistent in my trading. Learning to take some profits early on has made a huge difference." Simon H.
I knew I had succeeded at getting my message across when I received this email: "Learning that trading is a serious business has changed my life. I was about to give up, when I began to fully realize just how serious this business really is. However, now that I finally woke up, I am a winning trader making money for myself and my clients." Mark C.
My book has helped thousands of traders. You, too, might consider studying your own copy of Trading Is a Business.
Developer: Joe Ross
Administration and New Developments: Philippe Gautier
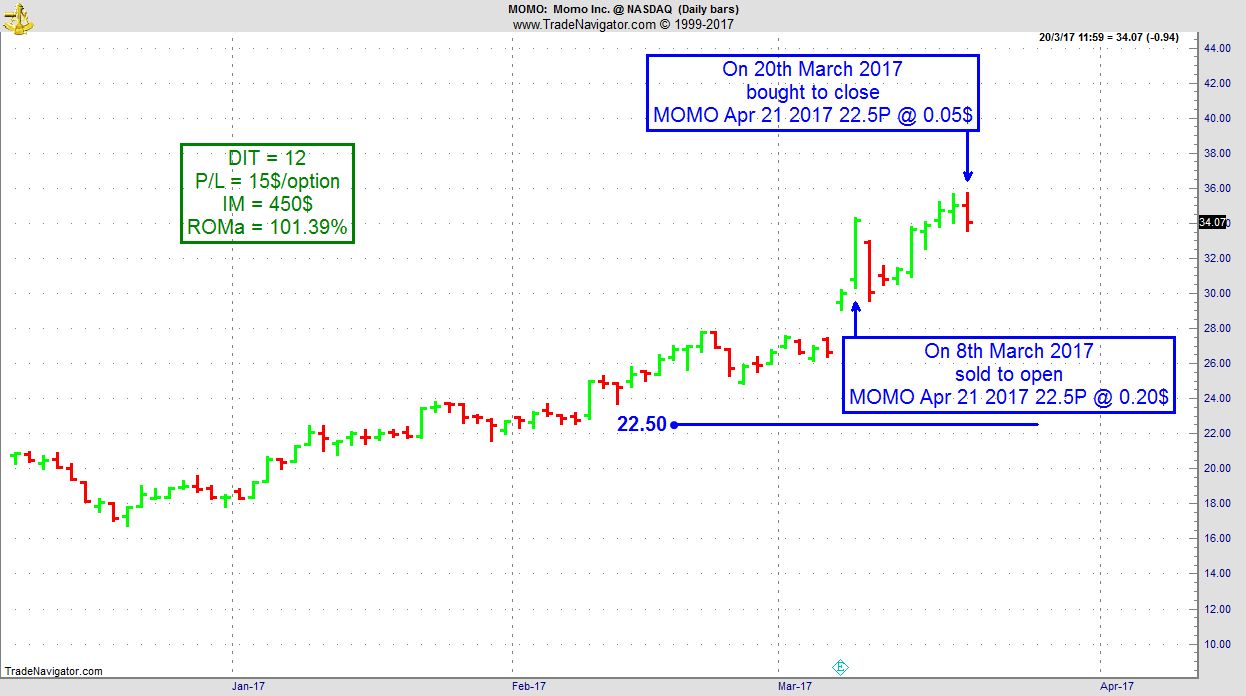
On 7th March 2017, we gave our IIG subscribers the following trade on MOMO, right after earnings. We decided to sell price insurance as follows:
On 8th March 2017, we sold to open MOMO Apr 21 2017 22.5P @ $0.20, i.e. $20 per option sold, with 43 days to expiration, and our short strike below a major support zone, about 25% below price action.
On 20th March 2017, we bought to close MOMO Apr 21 2017 22.5P @ $0.05, after 12 days in the trade, for quick premium compounding.
Profit: $15 per option
Margin: $450
Return on Margin annualized: 101.39%
This trade was pretty safe in spite of overall very low implied volatility levels.
We have also added new types of trades for our IIG daily guidance, "no loss" propositions with unlimited upside potential, still using other people's money to trade (see recent EWZ example in Newsletter Edition 649 found in our "member only" area under the archives tab).
To view previous published Chart Scan newsletters, please log in or click on "Join Us,"
shown above, to subscribe to our free "Members Only" section.
A WEALTH OF INFORMATION & EDUCATION:
Joe Ross-Trading Educators' popular free Chart Scan Newsletter has been published since 2004.
Note: Unless otherwise noted, all charts used in Chart Scan commentary were created
by using Genesis Financial Technologies' Trade Navigator (with permission).
Legal Notice and Copyright 2017 Disclaimer - Published by Trading Educators, Inc.
Chart Scan is a complimentary educational newsletter.
by Master Trader Joe Ross
Author, Trader, Trading Mentor, and Founder of Trading Educators, Inc.
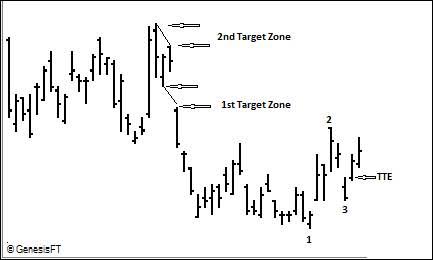
Prices formed a base at the end of a down swing, and then formed a 1-2-3 low. Prices thrust above the #3 point, and I was filled on a Traders Trick Entry. My first objective was for prices to reach to, or close near the #2 point, but what if prices continue higher? How should I set objectives for the remainder of my position?
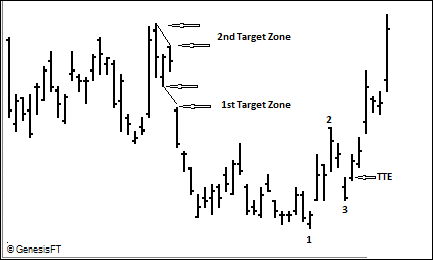
If prices break beyond #2 there were two immediate target zones. The first one was the gap that formed when prices moved down to squeeze out the last of the bulls (1st Target Zone). Traders become confused by gaps, and tend to move protective orders to the top and bottom of the gap. The second one is that of previous consolidation high (2nd Target Zone). Prices had held steady while in the area of the previous consolidation, but after a breakout to #1, a move back into the consolidation area will generally see a test of the highs.
The chart below shows what happened with this trade:
by Master Trader Joe Ross
Author, Trader, Trading Mentor, and Founder of Trading Educators, Inc.
Recently, someone sent me the following question: "Just how committed does a trader need to be?"
I don’t know that I can put a number to that. For instance, on a scale of 1-10 how committed should a trader be. But if I had to evaluate it on that basis, I would say he must be a "10."
What is the value of commitment? How do you measure such a thing?
Most people have an "interest" in becoming consistently profitable traders. However, few possess the essential ingredient of "total commitment." Total commitment is what is demanded for a high level of success from any endeavor. A trader with commitment will take the money from 100 traders who have only an "interest."
Commitment is seen as Cortez burning his ships upon landing in Mexico. With less than 100 men, Cortez rode into Mexico City against 100,000 Aztec warriors and placed Montezuma, leader of the Aztecs, in chains. Few people have ever accomplished any goals without commitment to success. For some traders, commitment to success is not optional but mandatory.
Developer: Joe Ross
Administration and New Developments: Philippe Gautier
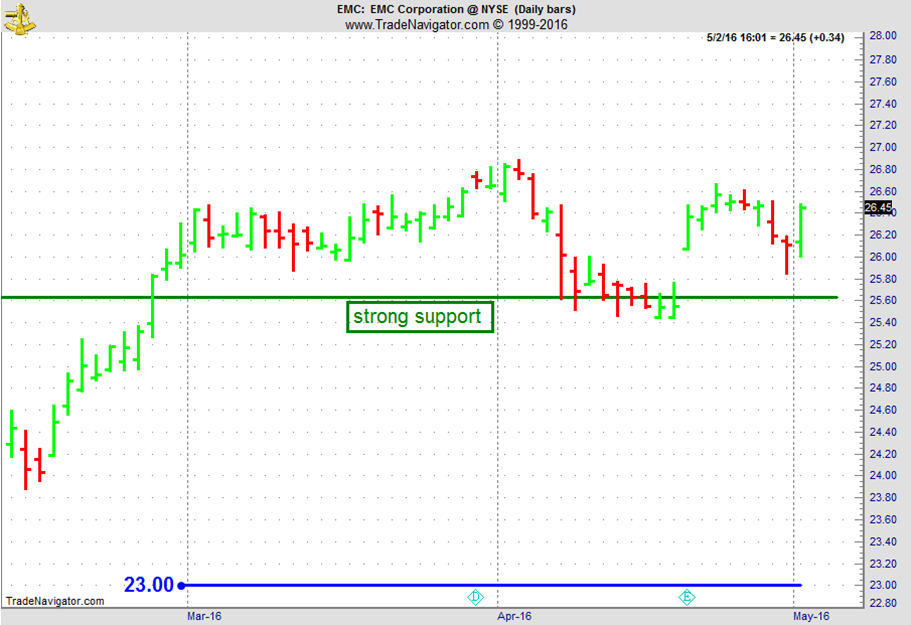
On 2nd May 2016 we gave our IIG subscribers the following trade on EMC, on a TTE on a RH on the daily chart. We decided to sell price insurance as follows:
On 3rd May 2016, we sold to open EMC Jun 17 2016 23P @ $0.38, i.e. $38 per option sold, with 44 days to expiration, and our short strike below a major support zone, about 13% below price action.
On 11th May 2016, we bought to close EMC Jun 17 2016 23P @ $0.19, after 8 days in the trade, for quick premium compounding.
Profit: $19 per option
Margin: $460
Return on Margin annualized: 188.45%
N.B. We have also added new types of trades for our IIG daily guidance, "no loss" propositions with unlimited upside potential, still using other people's money to trade.
If you missed the first blog in his series, be sure to check it out! Any fool can get into the market, but it takes a consistent successful trader to...read more.
To view previous published Chart Scan newsletters, please log in or click on "Join Us,"
shown above, to subscribe to our free "Members Only" section.
A WEALTH OF INFORMATION & EDUCATION:
Joe Ross-Trading Educators' popular free Chart Scan Newsletter has been published since 2004.
Note: Unless otherwise noted, all charts used in Chart Scan commentary were created
by using Genesis Financial Technologies' Trade Navigator (with permission).
Legal Notice and Copyright 2017 Disclaimer - Published by Trading Educators, Inc.
Chart Scan is a complimentary educational newsletter.
by Master Trader Joe Ross
Author, Trader, Trading Mentor, and Founder of Trading Educators, Inc.
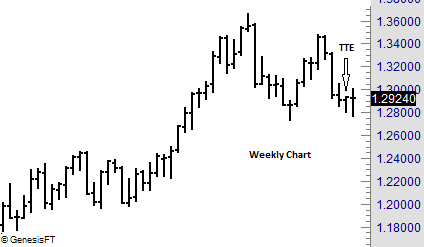
Prices have formed doji on the weekly chart. That doji bar, although it was an outside bar, also filled a Traders Trick Entry from the previous week. The question was “Would that entry also be fulfilled on the daily chart during the following week. By dropping down to the daily chart, would we see a chance for entry with a Traders Trick™ on the daily chart. Implementation of The Law of Charts™ teaches that entry signals from a larger time frame can often be entered and managed on a lesser time frame. So let's look at the daily chart and then see how we might have entered a trade based on a weekly signal on the daily time frame.
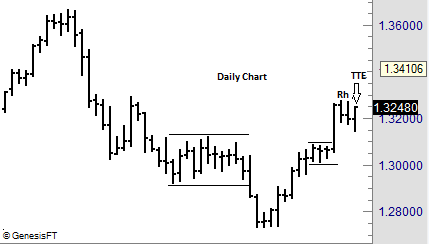
The Law of Charts states that a Ross hook is the first failure of prices to move higher following a breakout from congestion. The Law also states that a good way to enter such a trade is from a Traders Trick entry. In this case entry would be at 1.3253.
Now let’s go to a lesser time frame for actual entry and management with a daily chart.
by Master Trader Joe Ross
Author, Trader, Trading Mentor, and Founder of Trading Educators, Inc.
Some time ago I spent 4 days in a Forex trading office, teaching and working with the traders there. It was interesting to see how these traders speak with one another, and to listen to what they say. I couldn’t help making some observations which I will now share with you.
If you are a part- or full-time trader, you may have enjoyed the attention this wild and wooly occupation brings at social gatherings and events. Many are interested in trading, and find you interesting as a successful trader. At first, the attention may be enjoyable; but a need to maintain this reputation may impact your trading attitude and mindset, and therefore, your bottom line.
The best strategy you can use to avoid letting your reputation influence your performance—especially when enduring a drawdown period—is to keep your conversation low-key about your trading career. Why? The more you present yourself socially as a "successful trader," the more psychological effort you will spend defending this reputation. Several research studies have documented that one of the biggest obstacles to sound decision-making is the need to save face in social situations. People are so reluctant to face the adverse social consequences of having made a poor decision that they stay on a losing course of action, rather than admit they were wrong. For example, some traders are reluctant to sell off losers in order to avoid the possible social criticism that acknowledging a failure may bring.
Suppose you have told your friends about a large position, and within minutes, hours, or days, it tanked, hard and fast. Most folks can’t wait for the next opportunity to ask you (even though they probably know the answer) how your “hot trade” is doing. If you got rid of it, at least you have the solace of managing the trade properly—even though you must tolerate a volley of smug “you-thought-it-would-go up and such, but-it crashed-instead” comments. On the occasions when you ignored your protective stop, however, and held onto the bad trade, the “Boy, you-really-ARE-dumb” looks (and perhaps comments) can exacerbate the psychological devastation you've by now, surely, inflicted on yourself. And we all know the negative impact a negative attitude can have on our trading.
As another example, how many times has the market gapped up, then chopped through the rest of the day, handing you more losses than wins? Inevitably, those are the days when well-meaning friends call on the phone. “You must have made a fortune today!” they gush. “Not really,” you mumble with a sinking heart, remembering the frustrating trading environment. After you hang up the phone, the subsequent feelings can lead you to believe you must have been a dope that day; surely every trader in the world except you grabbed huge gains. In social environments, once you announce and identify yourself as a trader, you will feel a need to defend your reputation. Trading is hard enough, why introduce additional social and psychological pressures that will adversely influence your trading results? Keep the specifics of your trading career to yourself. There is no sound reason to discuss the specifics of your career socially. It’s often done just to build up your ego, and enjoy the attention of others. You'll pay a price for this short-term gratification in the long run. Avoid specific observations or trading choices. That way, you'll avoid embarrassing questions and comments that will interfere with your trading.
Developer: Joe Ross
Administration and New Developments: Philippe Gautier
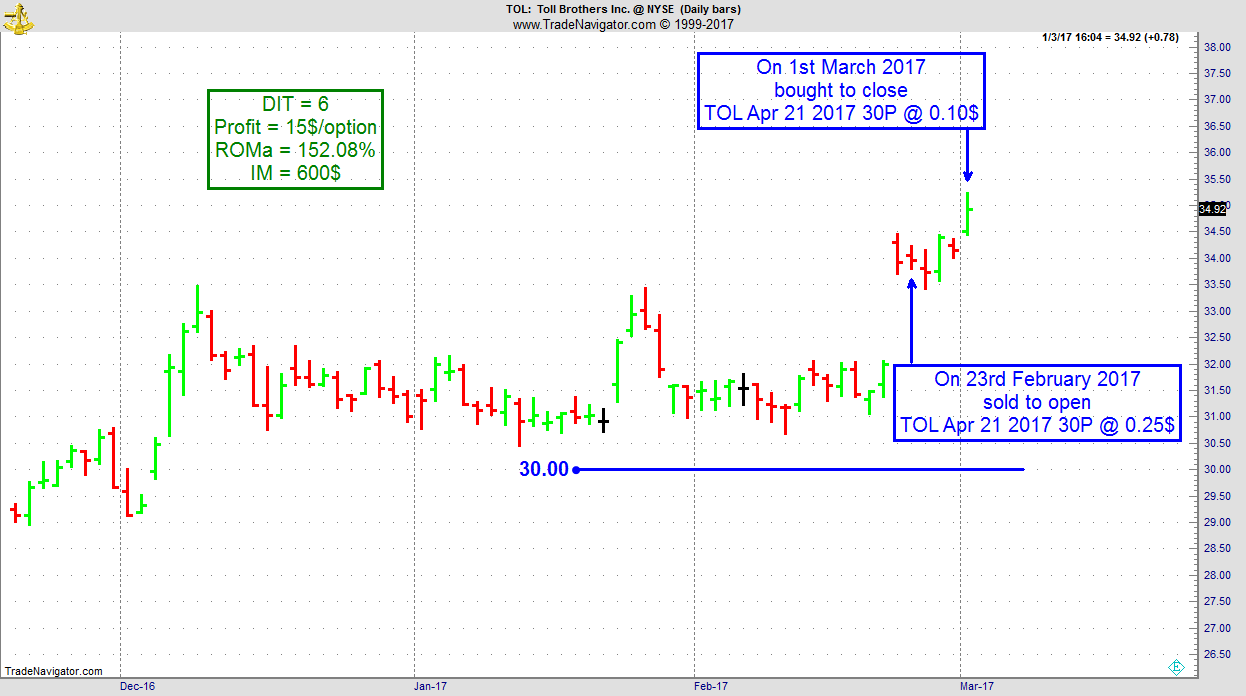
On 22nd February 2017 we gave our IIG subscribers the following trade on TOL, after an earnings gap. We decided to sell price insurance as follows:
On 23rd February 2017, we sold to open TOL Apr 21 2017 30P @ $0.25, i.e. $25 per option sold, with 58 days to expiration, and our short strike below a major support zone, about 12% below price action.
On 1st March 2017, we bought to close TOL Apr 21 2017 30P @ $0.10, after 6 days in the trade, for quick premium compounding
Profit: $15 per option
Margin: $600
Return on Margin annualized: 152.08%
This trade was pretty safe in spite of the very low implied volatility environment we are now in.
We have also added new types of trades for our IIG daily guidance, "no loss" propositions with unlimited upside potential, still using other people's money to trade.
This week, Andy includes a short podcast he found interesting and uses it to point out some revelant facts that many people don't take into consideration. Read more.
In addition, Andy continues his series on How to Approach trading with Part 5:
Follow the Markets
After you've determined your strategy and the market or markets you will trade, you can start following the price action. It is important to follow each market consistently and see the trading opportunities as they develop. Jumping around from one market to another often leads to missed or late execution of your method. I think it's important to let the market tell you what to do. I'm sure many of you have heard the saying, "The trend is your friend." There is truth in that, but not all good trading must follow the trend. Since these days markets trend so little that perhaps we should come up with a new saying: "The swing is your thing." How about this one: "The setup is my get up."
I don't generally concern myself a lot with how much a market is going move overall. But I am concerned with how much the market will move minimally. I want to guarantee myself a minimum move a high percentage of the time. I'm satisfied with being on the right side of the trade. However, I'm constantly asked; "Where do you think prices are going?" or "When should I get out of the move?" My answers are usually; prices will move in the direction of the trade—they will go where they want to go." And "Get out of a trade when it quits going your way, or you’re satisfied with the profits you’ve made." A potential objective number of points, ticks, or pips are most useful when you are trying to decide which of several different markets to trade or when deciding how much of your capital to allocate to a particular trade.
Stay on the Right Side
It is important to stay on the right side of the market, buying when it is going up, selling when it is going down, and staying out when it is not going anywhere. But again, this is a generality. There are plenty of traders who make their money when a market is not going anywhere. Option sellers who straddle and strangle love markets that are going nowhere at all. In any event, staying out is often easier said than done.
Sometimes you'll have to be pretty nimble to stay on the right side of the market.
It's important to not be committed to a direction when the market tells you otherwise and be willing to allow that the market is never wrong.
As traders, we’re always looking for useful data that might give us an extra edge. That’s even truer for technical/price focused traders where all we have is the open, high, low and close of a market (or tick data, but that usually ends up in some similar transformation as OHLC data). Sure there are thousands of indicators but these are all just transformations of that price data.
Now in many markets volume can be a useful addition to that. Knowing if there was heavy trading within a certain time period or not can be valuable information. It can be used as a filter for trade signals, looking for strong volume on a breakout for example. But there’s also a couple of volume based indicators that incorporate volume in a useful way.
In the futures markets, when you look at the volume you actually see how many contracts have been traded at the exchange during that time period. And you see all of it, of all market participants in that market as there’s just one exchange.
But Forex trading is decentralized, OTC trading. There is no single place to look at to see the actual volume of a currency pair. That’s why it’s often said that the volume provided by your broker is pretty useless. All you would see is the trading volume that happened at your broker, either between clients and liquidity providers in an ECN or if you’re trading at a market maker between your broker and it’s clients. But retail traders are not moving the markets, their volume is totally meaningless in a such a big marketplace.
And of course, the institutional traders that are responsible for the volume that matters don’t trade at a retail broker. They’re on Reuters, EBS or just trading directly with other banks/institutions. So if you just see the volume that happened at your retail broker, it’s useless information right? That’s what I thought too and so I never paid much attention to volume in FX.
Until recently when CLS FX volume data became available for the retail customer over at Quandl. CLS runs the largest FX settlement service in the world and therefore they have the information we’re looking for. Institutional Forex trading volume, the volume that actually matters and moves the markets. Now CLS does a great job here and as always, it’s super easy to use the data via Quandl. So if you can afford it, I think that data is the best forex volume data you can get and that is well worth its price.
So once that real volume data was available, I, of course, got very excited and curious. Maybe it was time to have another look at volume data in the Forex markets. How would the CLS volume data compare to different brokers data? What is it actually that you see at your broker? And how does it compare to the Futures contracts?
Two brokers that offer volume data and I already had an API to connect to are Oanda and Dukascopy. So I downloaded their data, merged both to the same daily time periods and compared them. The first surprise for me was that it was almost identical (over 90% correlated). So I decided to read more about that data and found out that what they’re providing is actually "tick volume" data. This means that whenever there’s a new quote from the source they’re using (Oanda probably uses Reuters and other similar data feeds, Dukascopy offering ECN trading probably use the quotes of each of their liquidity providers) that would make the volume go higher. That of course strongly increases the odds of their volume data actually being useful. It would mean that what we’re seeing is not what’s going on between them and their clients but on their quote data sources. And that indeed might be informative.
But is it? As traders we never want to rely on an assumption, we want actual numbers that proves our idea right or wrong. So let's find out! The first step was to get one of the free samples of CLS data available at Quandl. I picked the daily GBP/JPY spot data and compared it to Oanda's tick volume data.
First of all the actual absolute numbers are of course totally different. And if that's what you need, CLS is the only way to go. But as traders what we usually are interested in is "Is today's volume above/below average?" or "Is today's volume some standard deviation above/below average?" and so forth. And for this we're fine as long as the data is correct on a normalized basis.
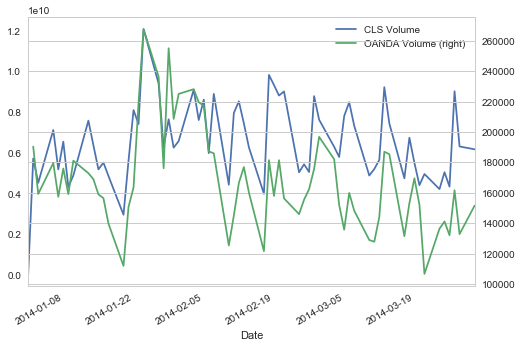
Here’s a graph of GBP/JPY volume from CLS and Oanda plotted on two Y axis (CLS left, Oanda right):
So again, yes the absolute numbers are totally different but on a relative basis, looking for volume rising/falling and most of the spikes they look quite similar.
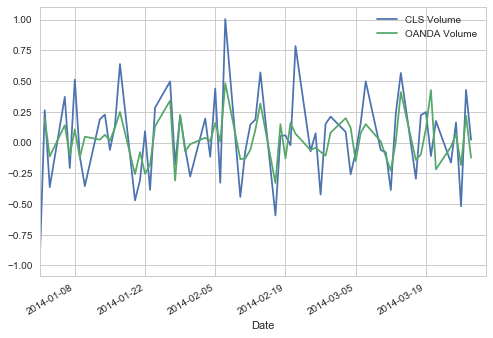
Looking at the same data showing the percent change between each day that becomes even more clear:
Now there are differences, but as you can see they’re highly correlated. Which leads me to the conclusion that FX brokers data might indeed be of some value.
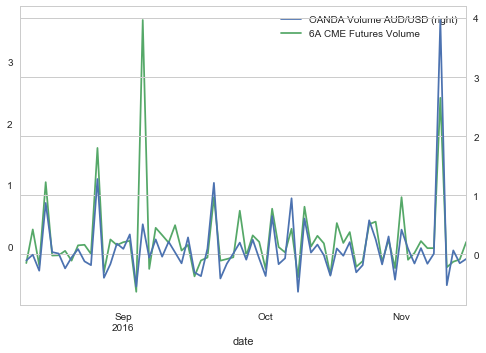
My next idea was to compare one of the spot Forex markets to a futures market. I picked AUD/USD spot FX, again using Oanda data and the Australian Dollar Future (6A) traded at the CME.
Again, on a relative basis looking at the percent change of day to day volume we get another confirmation:
Conclusion: Surprise! As so often in trading the result of that little investigation is very different from what I expected. The FX volume data provided by your broker/ECN might indeed be valuable information!
To view previous published Chart Scan newsletters, please log in or click on "Join Us,"
shown above, to subscribe to our free "Members Only" section.
A WEALTH OF INFORMATION & EDUCATION:
Joe Ross-Trading Educators' popular free Chart Scan Newsletter has been published since 2004.
Note: Unless otherwise noted, all charts used in Chart Scan commentary were created
by using Genesis Financial Technologies' Trade Navigator (with permission).
Legal Notice and Copyright 2017 Disclaimer - Published by Trading Educators, Inc.
Chart Scan is a complimentary educational newsletter.
by Master Trader Joe Ross
Author, Trader, Trading Mentor, and Founder of Trading Educators, Inc.
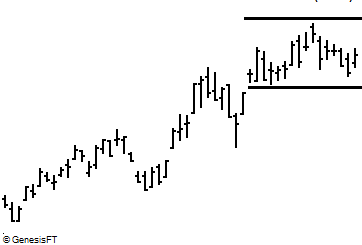
With prices overall being in an uptrend, what should be our anticipation for prices exiting the consolidation?
As we view the chart, we see that prices are off their recent highs and have made 5 correcting bars prior to the last bar shown. The question is will prices stay in consolidation, break out to the upside, or break to the downside?
According to the Law of Charts and the Traders Trick the current anticipation is for sideways action. When there are more than 3-4 bars of correction, the percentages change to favor consolidation. Adding to this concept is the fact that the last 5 bars have either opened or closed inside of a "measuring bar". The measuring bar is the long bar that took place on November 18. In fact, there is another way to look at this chart which you will see below.
Trading Article - When Low Probability Setups Seem Attractive
by Master Trader Joe Ross
Author, Trader, Trading Mentor, and Founder of Trading Educators, Inc.
“I’ll worry about it later?” When trying to deal with the fact that we must eventually cope with an unpleasant event, such statements help us get through life. We often put off things we don’t want to do, hoping that we will gather enough energy and enthusiasm to deal with them in the future. Take your taxes for instance. Do you wait until the last day to pay them? Why not start working on your taxes today? Most people avoid gathering and organizing their financial records until they need to. We prefer to put off facing an unpleasant reality, such as doing our taxes, until the very last minute. The same thing seems to happen when we make trading or investment decisions. Researchers suggest that people may be willing to invest in low probability setups as long as they don't have to deal with the consequences of the trade immediately.
Research participants were asked to imagine making various economic decisions and to indicate which economic decision they would prefer and under what conditions. In the first hypothetical economic decision, the payoff was high, but the chance of receiving the payoff was low. In the second economic decision, the payoff was low, but the chance of receiving the payoff was high. People’s preferences depended on whether the payoff was to be received immediately or in the distant future. People indicated that they would be willing to accept a low probability of success if the potential payoff was high and they didn't need to find out what happened until the distant future. People did not prefer an economic decision that had a low probability of success if they had to deal with the outcome of the decision in the near future. Indeed, if they had to make an economic decision that had consequences for the near future, they would take the option of receiving a low payoff as long as it had a high probability for success.
These research findings may explain how decisions about long-term trades and investments are made. When it comes to long-term investments, people are willing to risk money on a low probability setup as long as they believe the potential profit is high. This is somewhat irrational, however. The probability of success is an important element when deciding whether to risk capital. It doesn’t matter whether it is a long-term investment or a short-term trade, a trade setup should have a high probability of success. But people have a natural human tendency to accept a low probability setup as long as they don’t have to face the outcome until the distant future, and they believe that the potential payoff is high.
When making trading or investment decisions it's necessary to consider all possible aspects of a trade. It is essential to always trade high probability setups. If you trade low probability setups, you are likely to lose money in the long run. But greed can bias our decisions. If we believe that the potential profits are high, we tend to irrationally invest capital even when the odds of success are low. In the end, however, it's more beneficial to look for setups that have a high probability of success, even if it means standing aside until we find them.
Developer: Joe Ross
Administration and New Developments: Philippe Gautier
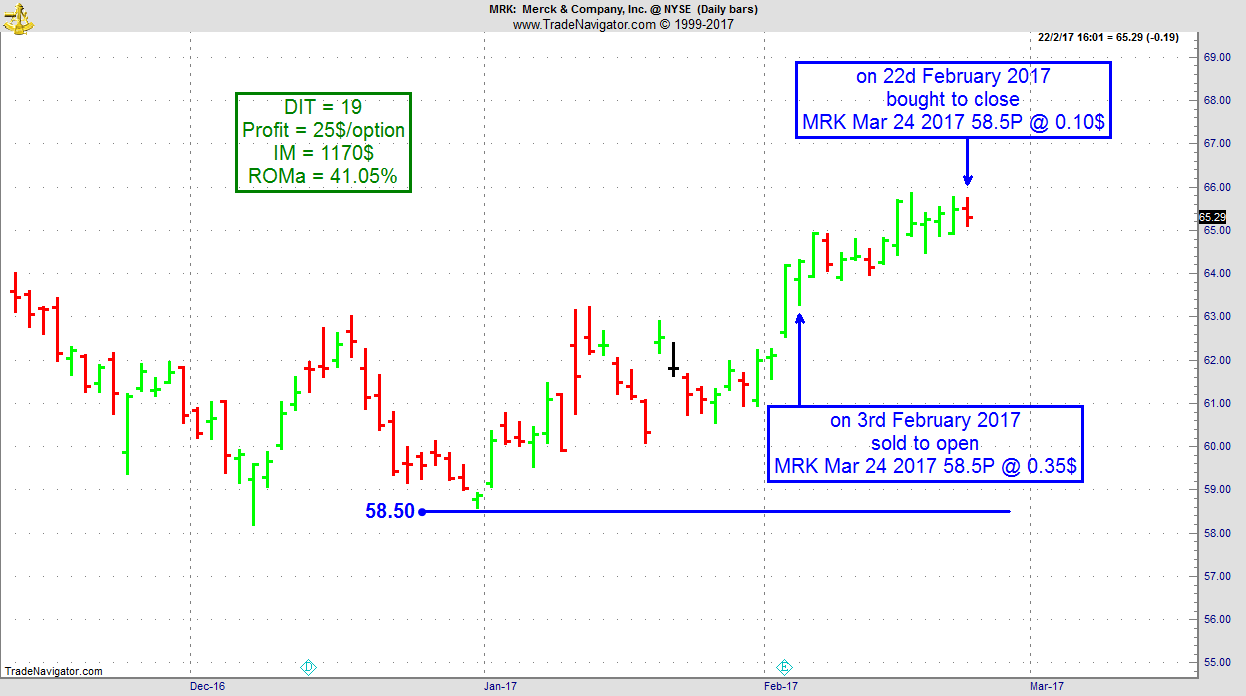
On 2nd February 2017, we gave our IIG subscribers the following trade on MRK, after an earnings gap. We decided to sell price insurance as follows:
On 3rd February 2017, we sold to open MRK Mar 24 2017 58.5P @ $0.35, i.e. $35 per option sold, with 51 days to expiration, and our short strike below a major support zone, about 9% below price action.
On 22d February 2017, we bought to close MRK Mar 24 2017 58.5P @ $0.10, after 19 days in the trade, for quick premium compounding.
Profit: $25 per option
Margin: $1,170
Return on Margin annualized: 41.05%
This trade was pretty safe in spite of the very low implied volatility environment we are now in.
We have also added new types of trades for our IIG daily guidance, "no loss" propositions with unlimited upside potential, still using other people's money to trade.
To view previous published Chart Scan newsletters, please log in or click on "Join Us,"
shown above, to subscribe to our free "Members Only" section.
A WEALTH OF INFORMATION & EDUCATION:
Joe Ross-Trading Educators' popular free Chart Scan Newsletter has been published since 2004.
Note: Unless otherwise noted, all charts used in Chart Scan commentary were created
by using Genesis Financial Technologies' Trade Navigator (with permission).
Legal Notice and Copyright 2017 Disclaimer - Published by Trading Educators, Inc.
Chart Scan is a complimentary educational newsletter.
Chart Scan with Commentary - Traders Trick - Does it work in all markets?
by Master Trader Joe Ross
Author, Trader, Trading Mentor, and Founder of Trading Educators, Inc.
The Australian dollar had been rising against the U.S. dollar. At the time, I had been in the Aussie dollar for at least 3 years, and in addition to dollar deposits using Australian interest bearing notes I had begun trading iShares. iShares are an index of some of the top companies in Australia. It is through iShares that a trader can trade in another nation and still have the convenience of trading in his own country. Australian companies had been doing quite well supplying China with foodstuffs and raw materials. But in addition to the fat profits these companies were making, their stocks were rising because of the gain of the Aussie Dollar against the U.S. currency at the time. Trading or investing this way is a great way to hedge against a falling U.S. dollar.
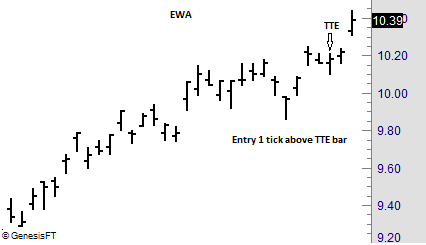
One day, iShares (Symbol EWA) offered up a Traders Trick for entry at a price of 10.24, 1 tick above the high shown at the arrow. Entry was actually made at 10.19, and the shares Closed two days later at 10.39 for a gain of 30 cents, or $300 on 1,000 shares.
The Law of Charts and the Traders Trick work in all markets, even markets as little known as Exchange Traded Funds or iShares.
by Master Trader Joe Ross
Author, Trader, Trading Mentor, and Founder of Trading Educators, Inc.
If your financial losses have injured or hurt your personal relationships, you must apologize and ask those persons for their forgiveness. Most people will forgive you immediately but whether or not they forgive you is unimportant. It is most important that you forgive yourself and resolve not to repeat the same mistakes. It’s also important to realize that if the offended person does not forgive you, it becomes his or her problem. Once you ask forgiveness, the problem is no longer yours. Self-forgiveness and resolution not to repeat mistakes is the best antidote for fear, anger and guilt, the three emotions of personal and financial destruction. Never use living expense money to trade the markets. Traders should only trade disposable income, an oxymoron if there ever was one.
Markets seldom make major tops or bottoms based on any one government report. Many traders have a look of shock on their faces when markets fall after a bullish report, but that is what the market wanted to do before the report was released. There is a natural tendency of professional traders to discount reports and state that the price action was already in the market before the report was released. Fundamental traders should rate reports as: + = bullish, + + = very bullish, 0 = neutral, - = bearish, and - - = very bearish. I traded cattle in the late 1970's and early 1980's and the market moved opposite the reports over 60% of the time the next day and over 70% of the time by the following week.
Developer: Joe Ross
Administration and New Developments: Philippe Gautier
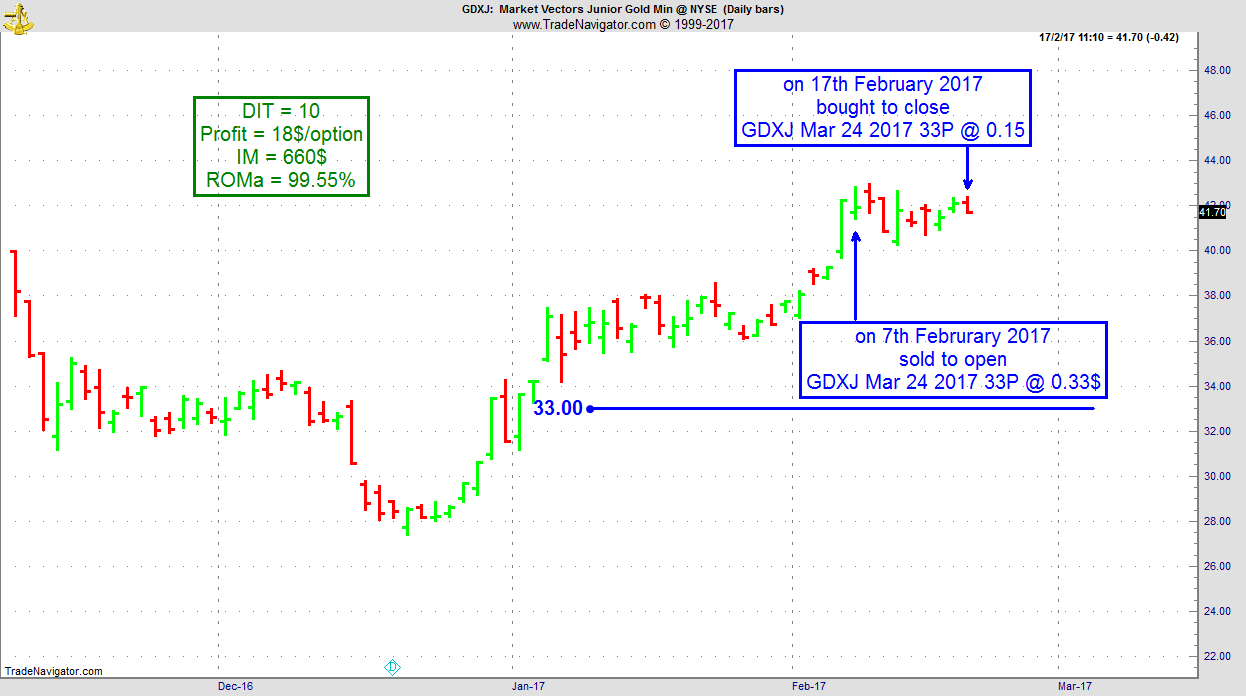
On 6th February 2017, we gave our IIG subscribers the following trade on GDXJ (Market Vectors Junior Gold Miners ETF), which had a strong up day. We decided to sell price insurance as follows:
On 7th February 2017, we sold to open GDXJ Mar 24 2017 33P @ $0.33, i.e. $33 per option sold, with 47 days to expiration, and our short strike below a major support zone, about 22% below price action.
On 17th February 2017, we bought to close GDXJ Mar 24 2017 33P @ $0.15, after 10 days in the trade, for quick premium compounding.
Profit: $18 per option
Margin: $660
Return on Margin annualized: 99.55%
This trade was pretty safe.
We have also added new types of trades for our IIG daily guidance, "no loss" propositions with unlimited upside potential, still using other people's money to trade.
In Part 3 of his series, Andy takes a look at what a good trading plan includes and answers an often asked question, "How do I get started?" Read more.
I don’t know if there are still brokers out there advertising that there are no trading costs in trading Forex. But you all do know better by now. If there are no commissions, they’ll simply mark up the spread to get their share, or worse (see latest FXCM scandal) in some way profit from your positions. That’s why I always prefer to pay commissions, this way there’s at least a chance you’re actually trading and your broker isn’t just on the other side of your "trades". Also paying commissions results in smaller spreads which will save you more money in the long run than the commission you’ll pay.
Let’s have a look at the major trading costs in Forex. First of all the BID/ASK spread you almost always have to pay (unless it’s 0 which can happen, and sometimes you’ll even get filled at a better price than expected), then volume-based commissions you pay to your broker for executing your trade and if you keep your trade overnight you got to pay some overnight commissions/swaps. Depending on what kind of orders you are using to enter/exit trades, you’ll also have to deal with slippage to some extent.
As trading costs are a reality, it’s important to be aware of them. If you think you can ignore them, maybe because you believe your trading strategy is so good that a couple of pips don’t matter to you then you should think again. There’s a reason why so many professionals are literally obsessed in trying to reduce trading costs all the time. Over hundreds of trades, trading costs will make a huge difference and many strategies that look very profitable without trading costs will look much worse once reality is factored in.
Now each currency pair has slightly different trading costs and it’s important to keep track of these. To keep things simple, I’ll focus just on the BID/ASK spread for now. But you definitely should also pay close attention to the overnight swaps, especially if you’re trading longer term positions and to trading commissions and slippage if you’re day trading.
A day trading strategy might work nicely in EUR/USD for example when your average spread during liquid market hours usually is about 0.25 pips and the average daily trading range (high-low) is about 80 pips. That gives you a daily range (80) to spread (0.25) ratio of 320 (80/0.25 = 320). If either volatility or liquidity dries up in a market, this ratio will drop too. The higher the ratio, the better and for every strategy, there is a point where it will stop being profitable should the ratio drop below. That’s why this is an important ratio you should always keep track of.
Now let’s compare that daily range to spread ratio to EUR/CHF where your average spread during liquid market hours is about 0.5 pips and the daily range is about 30 pips. That’s a ratio of just 60, meaning trading in EUR/USD is about 5 times „cheaper“ in our example. Due to the lower volatility, you’ll also need to trade more contracts than in EUR/USD to get the same bang for the buck which means you’ll also have to pay more commissions. Will your day trading strategy still work in EUR/CHF despite the higher trading costs? That, of course, depends on the strategy but you better do the math and see if it’s still worth trading it in that market after trading costs.
The higher your trade frequency, the more important trading costs are and the fewer markets will your strategy be profitable in. The reason for this is the ratio between the average trade result and the BID/ASK spread + commissions. If on average you make 3 pips per trade, an average spreads of 0.5 pips is much more of an issue than if you’re trading on a longer timeframe and make 30 pips on average.
That’s why it’s so easy to come up with a strategy that trades on a 5-minute chart and looks like it will make you rich in no time until you add trading costs. Trading costs will kill you here unless you’re very efficient in your trade execution (which most retail traders simply cannot afford).
Whenever I develop a new trading system, I run different kinds of simulations to get a good idea of how sensitive the system is to trading costs. This way I get a pretty good idea if it’s actually worth trading the system in the real world. Once I start to actually trade a system, I keep close track of its trading costs. Then I compare the simulated trading costs (what I expect) vs. real trading costs (what I get in real trading). This way I’ll find out rather quickly if I underestimated trading costs or maybe have been too pessimistic and overestimated them. During the last 6 months, for example, I got about 25% better execution on average than my simulated results for AlgoStrats:FX. That’s fine for me as it’s a close enough estimation for my trading style and I’m rather slightly too pessimistic about trading costs than the other way around.
There’s a lot more to say about this topic, but for now, I’d like to wrap it up with my advice that you better pay close attention to trading costs.
To view previous published Chart Scan newsletters, please log in or click on "Join Us,"
shown above, to subscribe to our free "Members Only" section.
A WEALTH OF INFORMATION & EDUCATION:
Joe Ross-Trading Educators' popular free Chart Scan Newsletter has been published since 2004.
Note: Unless otherwise noted, all charts used in Chart Scan commentary were created
by using Genesis Financial Technologies' Trade Navigator (with permission).
Legal Notice and Copyright 2017 Disclaimer - Published by Trading Educators, Inc.
Chart Scan is a complimentary educational newsletter.
"Teach our students the truth in trading - teach them how to trade,"
and
"Give them a way to earn while they learn - realizing that it takes time to develop a successful trader."
Derivative transactions, including futures, are complex and carry a high degree of risk. They are intended for sophisticated investors and are not suitable for everyone.
There are numerous other factors related to the markets in general or to the implementation of any specific trading program which cannot be
fully accounted for in the preparation of hypothetical performance results, and all of which can adversely affect actual trading results.
For more information, see the Risk Disclosure Statement for Futures and Options.








 Ambush Signals